Perceptions About Network Security: Survey of IT & IT security practitioners in the U.S. pptx
Bạn đang xem bản rút gọn của tài liệu. Xem và tải ngay bản đầy đủ của tài liệu tại đây (758.59 KB, 25 trang )
Perceptions About Network Security
Survey of IT & IT security practitioners in the U.S.
Ponemon Institute© Research Report
Sponsored by Juniper Networks
Independently conducted by Ponemon Institute LLC
Publication Date: June 2011
Ponemon Institute© Research Report Page 2
Perceptions about Network Security
Ponemon Institute, June 2011
Part 1. Introduction
Ponemon Institute is pleased to present the results of a study conducted to determine what IT
and IT security practitioners in the US, UK, France and Germany think about how well their
organizations are responding to threats against network security. Sponsored by Juniper
Networks, we believe this research is important because it can provide insights from those who
are dealing daily with the prevention and detection of these attacks. Specifically, what do they
think about the current threat landscape and what are the most effective strategies to keep
networks secure?
In this report, we focus only on the responses of US IT and IT security practitioners. Some of the
topics addressed include:
Are threats to network security increasing in frequency and sophistication?
Is their organization’s IT infrastructure secure enough to prevent successful attacks?
What is the nature of the attacks and are the attackers and attack vectors known?
Do organizations see complexity as a barrier to effective enterprise-wide network security?
We surveyed 583 IT and IT security practitioners in the US with an average of 9.57 years of
experience. More than half (51 percent) are employed by organizations with more than 5,000
employees.
Some of the most salient findings are as follows:
Organizations are experiencing multiple breaches. More than half of respondents (59
percent) say they have had two or more breaches in the past 12 months and 10 percent do
not know. Ninety percent of organizations in our study have had at least one breach.
The financial consequences can be severe. When asked to consider cash outlays, internal
labor, overhead, revenue losses and other expenses related to the security breach, 41
percent of respondents report that it was $500,000 or more and 16 percent say they were not
able to determine the amount.
As a result of these multiple breaches, more than one-third (34 percent) of respondents say
they have low confidence in the ability of their organization’s IT infrastructure to prevent a
network security breach.
Insufficient budgets are an issue for many organizations in our study. Fifty-two percent of
respondents say 10 percent or less of their IT budget is dedicated to security alone.
In the next 12 to 18 months, 47 percent say their organizations will spend the most IT security
dollars on network security.
Complexity and lack of resources are the greatest challenges to improving network security.
Almost half (48 percent) cite complexity as one of their biggest challenges to implementing
network security solutions. The same percentage of respondents (48 percent) says it is
resource constraints. Consequently, 76 percent are for streamlining or simplifying network
security operations and 75 percent believe their effectiveness would increase by developing
end-to-end solutions.
Ponemon Institute© Research Report Page 3
Part 2. Key Findings
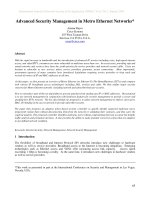
Organizations are experiencing multiple successful attacks against their networks. Bar
Chart 1 shows 59 percent (32+18+9) of respondents say their organization’s network security has
been successfully breached at least twice over the past 12 months. Ten percent do not know and
90 percent of organizations in our study have had at least one breach.
Bar Chart 1
The number of successful network security breaches over the past 12 months
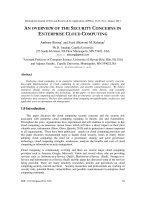
Bar Charts 2 and 3 on the following page show perceptions about the security of the IT
infrastructure and the level of confidence in the ability to prevent network security breaches. We
believe the fact that so many organizations are having multiple breaches is resulting in a low
opinion about security preparedness and a low level of confidence they have to prevent a future
attack. As shown in Bar Chart 2, 34 percent (11 + 23) of respondents say they have a low
perception about their network security.
Bar Chart 2
Perceptions about the security of the IT infrastructure to prevent network security breaches using
a 10-point scale from 1 = insecure to 10 = completely secure.
10%
21%
32%
18%
9%
10%
0%
5%
10%
15%
20%
25%
30%
35%
None
1 time
2 to 3 times
4 to 5 times
More than 5
times
Cannot
determine
11%
23%
29%
26%
11%
0%
5%
10%
15%
20%
25%
30%
35%
1 to 2
3 to 4
5 to 6
7 to 8
9 to 10
Ponemon Institute© Research Report Page 4
Bar Chart 3 reveals that 53 (23 + 30) percent of respondents have little confidence that they can
avoid one or more cyber attacks in the next 12 months.
Bar Chart 3
Respondents’ perceptions about the level of confidence that their organization will not experience
one or more cyber attacks sometime over the next 12 months using a 10-point scale from 1 = no
confidence to 10 = absolute confidence.
The financial impact of a security breach can be severe. According to 41 percent of
respondents, the financial impact of these breaches was $500,000 or more, as shown in Bar
Chart 4. However, 16 percent cannot determine the amount. Respondents were asked to
consider cash outlays, internal labor, overhead, business disruption, revenue losses and other
expenses.
Bar Chart 4
How much did cyber attacks cost your company over the past 12 months?
Respondents’ estimate about the cost is consistent with two other studies Ponemon Institute
conducts annually: the Cost of a Data Breach and the Cost of Cyber Crime. According to the
findings, the average cost of one data breach for U.S. organizations participating in the 2010
23%
30%
23%
13%
11%
0%
5%
10%
15%
20%
25%
30%
35%
1 to 2
3 to 4
5 to 6
7 to 8
9 to 10
1%
3%
16%
23%
22%
15%
3%
0%
1%
16%
0% 5% 10% 15% 20% 25%
Less than $10,000
$10,000 to $100,000
$100,001 to $250,000
$250,001 to $500,000
$500,001 to 1,000,000
$1,000,001 to $2,500,000
$2,500,001 to $5,000,000
$5,000,001 to $10,000,000
More than $10,000,000
Cannot determine
Ponemon Institute© Research Report Page 5
study was $7.2 million and the average cost of one cyber attack for U.S. organizations
participating in the 2010 study was $6.4 million.
1
Security breaches most often occur at off-site locations but the origin is not often known.
Mobile devices and outsourcing to third parties or business partners seem to be putting
organizations at the most risk for a security breach. As shown in Bar Chart 5, 28 percent say the
breaches occurred remotely and 27 percent say it was at a third party or business partner
location.
Bar Chart 5
Where did these security breaches occur?
However, as shown in Bar Chart 6, there is uncertainty as to where the breaches originate. Forty
percent of respondents do not know the source of the network security breaches. Of the 60
percent who say they know the source of all (11 percent) most (16 percent) or some of the
attacks (33 percent), more than one-third (34 percent) of respondents say the source is China
(not shown in the chart).
Bar Chart 6
What is the source of network security breaches experienced over the past 12 months?
1
See 2010 Annual Cost of a Data Breach, conducted by Ponemon Institute and sponsored by Symantec,
March 2011. Cost of a Cyber Crime, conducted by Ponemon Institute and sponsored by ArcSight, an HP
company, July 2010.
9%
16%
20%
27%
28%
0% 5% 10% 15% 20% 25% 30%
Regional center
Headquarters
Branch or local office
Third party or business partner
Remotely (mobile workforce)
11%
16%
33%
40%
0% 5% 10% 15% 20% 25% 30% 35% 40% 45%
Yes, we know the source of all attacks
Yes, we know the source of most attacks
Yes, we know the source of some attacks
No, we do not know the source of attacks
Ponemon Institute© Research Report Page 6
Attacks are coming from external agents but insider abuse is prevalent. Bar Chart 7 shows
the person(s) most responsible for the attack. Both external agents and insiders (employees) are
most often behind the security breaches according to 55 percent and 49 percent of respondents,
respectively. Respondents also report that multiple sources can be blamed for the breaches.
Bar Chart 7
Who was behind security breaches experienced over the past 12 months?
Fifty-two percent say the breaches were caused by insider abuse and 48 percent say it was
malicious software download and 43 percent say it was malware from a website. Sixteen percent
do not know the cause.
Bar Chart 8
How were these security breaches caused?
3%
8%
17%
29%
48%
49%
55%
0% 10% 20% 30% 40% 50% 60%
Guest
Business partner
Insider – contractor(s)
Cannot determine
Multiple sources
Insider – employee(s)
External agent(s)
2%
3%
16%
19%
29%
43%
48%
52%
0% 10% 20% 30% 40% 50% 60%
Malware from instant message
Malware from text message
Do not know
System glitch
Malware from social media
Malware from a website
Malicious software download
Insider abuse
Ponemon Institute© Research Report Page 7
Employee mobile devices and laptops are seen as the most likely endpoint from which
serious cyber attacks are unleashed against a company. Bar Chart 9 shows that 34 percent
of respondents say attacks occurred from infected laptops or remotely due to an employee’s
insecure mobile device. Further, the top two endpoints from which these breaches occurred are
employees’ laptop computers (34 percent) and employees’ mobile devices (29 percent). Twenty-
eight percent say it is employees’ desktop computers.
Bar Chart 9
What are the most likely endpoints from which serious cyber attacks are unleashed? (Top two
choices)
Despite knowing that mobile devices are putting organizations at risk, Bar Chart 10 reveals that
60 percent of respondents say their organizations permit mobile devices such as smartphones
and tablets (including those personally owned by the employee) to access their company’s
network or enterprise systems.
Bar Chart 10
Do you allow mobile devices such as smartphones and tablets (including those personally owned
by the employee) to access your company’s network or enterprise systems?
1%
4%
5%
6%
10%
11%
28%
29%
34%
0% 5% 10% 15% 20% 25% 30% 35% 40%
Other
Contractor’s mobile device
Guest’s mobile device
Guest’s laptop computer
Contractor’s laptop computer
Do not know
Employee’s desktop computer
Employee’s mobile device
Employee’s laptop computer
60%
34%
6%
0%
10%
20%
30%
40%
50%
60%
70%
Yes
No
Unsure
Ponemon Institute© Research Report Page 8
Complexity and availability of resources are the most serious challenges to combating
cyber attacks. As shown in Bar Chart 11, almost half (48 percent) cite complexity as one of their
biggest challenges to implementing network security solutions. The same percentage of
respondents (48 percent) says it is resource constraints. These challenges are followed by lack of
employee awareness, which contributes to the insider risk. In addition to simplifying their security
operations and increasing available resources, organizations should consider the importance of
training and awareness.
Bar Chart 11
Serious challenges to ensuring network security operations are effective. (Top three choices)
Because almost half believe complexity is a major obstacle to fighting cyber crime, 76 percent of
respondents favor streamlining or simplifying network security operations and 75 percent of
respondents believe their effectiveness would increase by developing end-to-end solutions. See
the following bar chart.
Bar Chart 12
The following statements were rated using a five-point scale from strongly agree to strongly
disagree.
3%
5%
15%
18%
29%
33%
48%
48%
0% 10% 20% 30% 40% 50% 60%
Monitoring and enforcement
Policies and procedures
Lack of leadership and accountability
Availability of enabling technologies
Conflicting priorities
Employee awareness
Available resources
Complexity of security operations
76%
75%
0% 10% 20% 30% 40% 50% 60% 70% 80%
Our company’s efforts to combat cyber attacks
can be made more effective by streamlining or
simplifying network security operations.
Our company’s efforts to combat cyber attacks
can be made more effective by developing
holistic or end-to-end solutions to network
security.
Ponemon Institute© Research Report Page 9
To address the challenge of awareness and training, all organizations should have written
corporate security policies that define the responsibilities of employees to help keep the network
secure. As shown in Bar Chart 13, slightly more than half (56 percent) of organizations in our
study say they have a written corporate security policy. Less than half (49 percent) say the
corporate security policy is readily accessible by employees and other authorized users.
Bar Chart 13
Does your organization have a security policy that is readily accessible?
Attacks are becoming more frequent and severe. Bar Chart 14 reveals that the IT practitioners
in our study are worried about continuing and more serious attacks. Seventy-eight percent of
respondents say there has been a significant (43 percent) or some (33 percent) increase in the
frequency of cyber attacks during the 12 months, and 77 percent say these attacks have become
more severe or difficult to detect, or contain.
Bar Chart 14
Are attacks against your organization becoming more frequent and severe?
49%
56%
0% 10% 20% 30% 40% 50% 60%
If yes, is the corporate security policy readily
accessible, either online or offline, by your
employees and authorized users?
Does your company have a written corporate
security policy?
78%
77%
0% 10% 20% 30% 40% 50% 60% 70% 80% 90%
Did the frequency of cyber attacks increase over
the past 12 to 18 months?
Have cyber attacks against your company
become more severe or difficult to prevent,
detect or contain over the past 12 to 18 months?
Ponemon Institute© Research Report Page 10
According to respondents and shown in Bar Chart 15, by far the most serious types of cyber
attacks are web-based attacks and SQL injections. The least serious attacks are phishing, social
engineering and malware.
Bar Chart 15
The most serious types of cyber attacks experienced by your company? (Top two choices)
Respondents also believe theft of information assets and business disruption are considered the
most serious consequences of these attacks (see Bar Chart 16). The least serious
consequences concern customer turnover, reputation effects and damage to critical
infrastructure.
Bar Chart 16
The most severe consequence of cyber attacks? (Top two choices)
Given the current threat landscape, organizations should make prevention and detection
of security breaches a primary focus. Bar Chart 17 shows that while it is the largest
percentage, only 32 percent of respondents say their primary focus or approach to network
security is on preventing attacks. Sixteen percent say it is on fast detection and containment and
5%
6%
11%
14%
19%
29%
49%
55%
0% 10% 20% 30% 40% 50% 60%
Phishing
Social engineering
Malware
Viruses
Denial of service
Hacking
SQL injection
Web-based attacks
5%
5%
11%
11%
15%
19%
21%
36%
59%
0% 10% 20% 30% 40% 50% 60% 70%
Customer turnover
Reputation damage
Damage to critical infrastructure
Revenue losses
Productivity decline
Regulatory and legal action
Cost of data breach
Business disruption
Theft of information assets
Ponemon Institute© Research Report Page 11
15 percent say it is on network intelligence. Twenty-three percent say their network security
strategy is to baseline their approach against best practices and 14 percent say it is IT
governance.
Bar Chart 17
What one statement best describes your company’s primary focus or approach to network
security?
Bar Charts 18a and 18b show the types of security currently in use by organizations. The top
three securities running on networks are: firewall/VPN, secure router and intrusion detection and
prevention appliances. The top three securities running on their approved corporate endpoints
today are: anti-virus, anti-malware and anti-spam.
Bar Chart 18a
What type of security is running on your
network today?
Bar Chart 18b
What type of security is running on your
approved corporate endpoints today?
14%
15%
16%
23%
32%
0% 5% 10% 15% 20% 25% 30% 35%
IT governance & policies
Network intelligence
Fast detection and containment
Baselining against best
practices
Preventing attacks
39%
40%
41%
42%
59%
63%
78%
80%
0% 25% 50% 75% 100%
Multi-purposed/UTM
appliances
SIEM / log system
SSL VPN
NAC
Virtual firewall
IDS & IPS
Secure router
Firewall / VPN
11%
20%
30%
47%
61%
77%
79%
0% 25% 50% 75% 100%
Anti-theft
Anti-phishing
Encryption
Personal firewall
Anti-spam
Anti-malware
Anti-virus
Ponemon Institute© Research Report Page 12
Part 3. Methods
Table 1 summarizes the sample response for this study conducted over a five-day period ending
in June 2011. Our sampling frame of practitioners consisted of 21,337 individuals located in the
United States who have bona fide credentials in the IT or IT security fields. From this sampling
frame, we invited 20,519 individuals. This resulted in 688 individuals completing the survey of
which 105 were rejected for reliability issues. Our final sample before screening was 583, thus
resulting in a 2.7% response rate.
Table 1: Sample response
US
Total sample frame
21,337
Returns
688
Reliability rejections
105
Final sample
583
Response rate
2.7%
On average, respondents held 9.57 years of experience in either the IT or IT security fields.
Twenty-one percent of respondents are female and 79 percent male. Table 2 shows the position
levels of respondents. As shown, 62 percent of respondents are at or above the supervisory
level.
Table 2: Organizational level that best describes respondents’ position
Pct%
Senior Executive
2%
Vice President
1%
Director
17%
Manager
23%
Supervisor
19%
Technician
34%
Staff
2%
Contractor
2%
Total
100%
Table 3 shows the headcount (size) of respondents’ business companies or government entities.
As can be seen, 51 percent of respondents are employed by larger-sized organizations with more
than 5,000 individuals.
Table 3. Worldwide headcount of respondents’ organizations
Pct%
Less than 500 people
9%
500 to 1,000 people
13%
1,001 to 5,000 people
27%
5,001 to 25,000 people
26%
25,001 to 75,000 people
13%
More than 75,000 people
12%
Total
100%
Ponemon Institute© Research Report Page 13
Pie Chart 1 shows the industry distribution for respondents who are employed by private and
public sector organizations. As can be seen, the largest sectors include financial services
(including banking, insurance, credit cards, investment management), public sector (including
federal, state and local government organizations), and healthcare & pharmaceuticals.
Pie Chart 1: Industry segments of respondents’ organizations
Table 4 reports the geographic footprint of respondents’ organizations. In total, 76 percent of
organizations have operations (headcount) in two or more countries. In addition, 65 percent have
operations in one or more European nations. Finally, a total of 43 percent have operations in all
major regions of the world.
Table 4 reports the geographic footprint of respondents’ organizations. In total, 64 percent of
organizations have operations (headcount) in two or more countries. In addition, 61 percent have
operations in one or more European nations. Finally, a total of 44 percent have operations in all
major regions of the world.
Table 4: Geographic footprint of respondents’ organizations
Pct%
United States
100%
Canada
64%
Europe
61%
Middle East & Africa
20%
Asia-Pacific
58%
Latin America (including Mexico)
52%
20%
16%
12%
10%
6%
6%
6%
5%
5%
5%
3%
2%
1%
1%
Financial services
Public sector
Health & pharma
Retail
Industrial
Services
Transportation
Communications
Entertainment & media
Technology & Software
Hospitality
Defense
Education
Energy
Research
Other
Ponemon Institute© Research Report Page 14
Part 4. Conclusion
We believe our research provides evidence that many organizations are lacking the right strategy
to prevent cyber attacks against networks and enterprise systems. This study suggests
conventional network security methods need to improve in order to curtail internal and external
threats.
We believe organizations should consider incorporating the following recommendations in their
network security strategy:
Understand the risk employees’ mobile devices create in the workplace. In addition to
problems created when inappropriately being connected to the network, breaches involving
lost or stolen laptop computers or other mobile data-bearing devices remain a consistent and
expensive threat. According to Ponemon Institute’s 2010 Annual Cost of a Data Breach
Study, 35 percent of organizations report that a lost or stolen mobile device caused the data
breach they experienced.
Create a comprehensive policy (including detailed guidelines) for all employees and
contractors who use mobile devices in the workplace. The policy should address the risks
associated with each device and the security procedures that should be followed. Guidelines
can range from such topics as to what types of data should not be stored on these devices,
how to determine if an application can be safely downloaded and how to report a lost or
stolen device.
Improve ability through expertise and enabling technologies to detect and prevent breaches.
Understanding the source of the breaches can help organizations strengthen their cyber
security strategy.
Address the insider threat through the creation of an enterprise-wide security policy that
includes the responsibilities of employees to help protect network security. The policy should
be easily accessible. In addition, there should be a training and awareness program to
ensure employees understand the various risks to the network and how they can contribute
to preventing security breaches.
Complexity is recognized as a barrier to effective network security strategy. Organizations
should assess their current procedures and technologies to understand how best to
streamline their approach and have an end-to-end (holistic) approach to network security.
Our studies consistently show that the cost of cyber attacks is increasing. Reducing an
organization’s vulnerability to such attacks through the combination of proper staffing, enabling
technologies and training programs can help prevent the pattern of multiple breaches
experienced by so many in our study.
Ponemon Institute© Research Report Page 15
Part 5. Caveats
There are inherent limitations to survey research that need to be carefully considered before
drawing inferences from findings. The following items are specific limitations that are germane to
most Web-based surveys.
Non-response bias: The current findings are based on a sample of survey returns. We sent
surveys to a representative sample of IT and IT security practitioners, resulting in a large
number of usable returned responses. Despite non-response tests, it is always possible that
individuals who did not participate are substantially different in terms of underlying beliefs
from those who completed the survey.
Sampling-frame bias: The accuracy is based on contact information and the degree to which
the list is representative of individuals who are IT or IT security practitioners who deal with
network security issues. We also acknowledge that responses from paper, interviews or
telephone might result in a different pattern of findings.
Self-reported results: The quality of survey research is based on the integrity of confidential
responses received from respondents. While certain checks and balances were incorporated
into our survey evaluation process, there is always the possibility that certain respondents did
not provide responses that reflect their true opinions.
Ponemon Institute© Research Report Page 16
Appendix: Detailed Survey Findings
The following tables provide the percentage frequencies of responses to our survey instrument
completed over a five-day period in June 2011. Respondents were located in the United States.
Part 1. Perceptions about network security
Q1. How secure is your IT infrastructure in terms of preventing network security
breaches (cyber attacks)? Please use the following 10-point scale from 1 = insecure to
10 = completely secure.
Pct%
1 to 2
11%
3 to 4
23%
5 to 6
29%
7 to 8
26%
9 to 10
11%
Total
100%
Q2. How many times has your company’s network security been successfully breached
over the past 12 months?
Pct%
None (SKIP to Q7)
10%
1 time
21%
2 to 3 times
32%
4 to 5 times
18%
More than 5 times
9%
Cannot determine
10%
Total
100%
Q3. Approximately how much did cyber attacks cost your company over the past 12
months? Please consider cash outlays, internal labor, overhead, business disruption,
revenue losses and other expenses in your cost range selection. Expressed in US
dollars.
Pct%
Less than $10,000
1%
$10,000 to $100,000
3%
$100,001 to $250,000
16%
$250,001 to $500,000
23%
$500,001 to 1,000,000
22%
$1,000,001 to $2,500,000
15%
$2,500,001 to $5,000,000
3%
$5,000,001 to $10,000,000
0%
More than $10,000,000
1%
Cannot determine
16%
Total
100%
Q4. Where did these security breaches occur?
Pct%
Headquarters
16%
Regional center
9%
Branch or local office
20%
Remotely (mobile workforce)
28%
Third party or business partner
27%
Other (please specify)
0%
Total
100%
Ponemon Institute© Research Report Page 17
Q5a. Do you know the source (origin) of the network security breaches experienced by
your company over the past 12 months?
Pct%
Yes, we know the source of all attacks
11%
Yes, we know the source of most attacks
16%
Yes, we know the source of some attacks
33%
No, we do not know the source of attacks
40%
Total
100%
Q5b. If yes, please check all the countries where these attacks originate.
Pct%
Brazil
3%
China (PRC)
34%
Russian Federation
19%
Taiwan
2%
United States
6%
Other [pull down menu]
21%
Cannot determine
15%
Total
100%
Q6a. Do you know who was behind security breaches experienced over the past 12
months?
Pct%
External agent(s)
55%
Insider – employee(s)
49%
Insider – contractor(s)
17%
Business partner
8%
Guest
3%
Multiple sources
48%
Cannot determine
10%
Do not know (SKIP to Q7)
19%
Total
209%
Q6b. How were these security breaches caused? Please check all that apply.
Pct%
Malware from a website
43%
Malicious software download
48%
Malware from social media
29%
Malware from text message
3%
Malware from instant message
2%
Insider abuse
52%
System glitch
19%
Other (please specify)
1%
Do not know
16%
Total
213%
Ponemon Institute© Research Report Page 18
Q6c. What was the endpoint (a.k.a. transport vehicle) from which these security
breaches occurred? Please check all that apply.
Pct%
Employee’s desktop computer
28%
Employee’s laptop computer
34%
Employee’s mobile device (smartphone, tablets, others)
29%
Contractor’s laptop computer
10%
Contractor’s mobile device
4%
Guest’s laptop computer
6%
Guest’s mobile device
5%
Other (please specify)
1%
Do not know
11%
Total
128%
Q7. How confident are you that your company will not experience one or more cyber
attacks sometime over the next 12 months? Please use the following 10-point scale
from 1 = no confidence to 10 = absolute confidence.
Pct%
1 to 2
23%
3 to 4
30%
5 to 6
23%
7 to 8
13%
9 to 10
11%
Total
100%
Q8. Do you allow mobile devices such as smartphones and tablets (including those
personally owned by the employee) to access your company’s network or enterprise
systems?
Pct%
Yes
60%
No
34%
Unsure
6%
Total
100%
Q9. What do you see as the most likely endpoints from which serious cyber attacks are
unleashed against a company? Please select only two top choices.
Pct%
Employee’s desktop computer
23%
Employee’s laptop computer
58%
Employee’s mobile device (smartphone, tablets, others)
55%
Contractor’s laptop computer
28%
Contractor’s mobile device
21%
Guest’s laptop computer
6%
Guest’s mobile device
5%
Other (please specify)
2%
Total
198%
Ponemon Institute© Research Report Page 19
Q10. What one statement best describes your company’s primary focus or approach
to network security?
Pct%
Preventing attacks
32%
Fast detection and containment
16%
Network intelligence
15%
Baselining against best practices
23%
IT governance including policies and enforcement
14%
Other (please specify)
0%
Total
100%
Q11. What type of security is running on your network right now? Please check all that
apply.
Pct%
Firewall / VPN
80%
Secure router
78%
Virtual firewall
59%
Intrusion Detection and Prevention appliances
63%
Multi-purposed/UTM appliances
39%
SIEM / log system
40%
SSL VPN
41%
NAC
42%
Other (please specify)
2%
Total
444%
Q12. What type of security is running on your approved corporate endpoints today?
Pct%
Anti-virus
79%
Anti-spam
61%
Anti-malware
77%
Personal firewall
47%
Anti-phishing
20%
Anti-theft
11%
Encryption
30%
Other (please specify)
3%
Total
328%
Q13a. Does your company deploy a secure virtual private network (VPN) for remote
access to your company’s network?
Pct%
Yes
72%
No
24%
Unsure
4%
Total
100%
Q13b. If yes, what type of VPN does your company deploy?
Pct%
SSL VPN
50%
IPsec VPN
44%
Other (please specify)
4%
Unsure
2%
Total
100%
Ponemon Institute© Research Report Page 20
Q14. In your opinion, did the frequency of cyber attacks increase over the past 12 to 18
months?
Pct%
Yes, significant increase
43%
Yes, some increase
35%
No
18%
Unsure
4%
Total
100%
Q15. In your opinion, have cyber attacks against your company become more severe or
difficult to prevent, detect or contain over the past 12 to 18 months?
Pct%
Yes
77%
No
18%
Unsure
5%
Total
100%
Q16. What do you see as the most serious types of cyber attacks experienced by your
company? Please select only two choices.
Pct%
Viruses
14%
Malware
11%
Hacking
29%
Web-based attacks
55%
SQL injection
49%
Phishing
5%
Social engineering
6%
Denial of service
19%
Other (please specify)
2%
Total
190%
Q17. What do you see as the most severe consequence of cyber attacks? Please
select only two choices.
Pct%
Business disruption
36%
Theft of information assets
59%
Damage to critical infrastructure
11%
Revenue losses
11%
Customer turnover
5%
Productivity decline
15%
Cost of data breach
21%
Regulatory and legal action
19%
Reputation damage
5%
Other (please specify)
0%
Total
182%
Q18. Do you feel security planning is given sufficient emphasis and funding within your
organization?
Pct%
Yes
43%
No
55%
Unsure
2%
Total
100%
Ponemon Institute© Research Report Page 21
Please rate the following two statements using the scale provided below each
item.
Q19a. Our company’s efforts to combat cyber attacks can be made more effective by
streamlining or simplifying network security operations.
Pct%
Strongly agree
32%
Agree
44%
Unsure
9%
Disagree
8%
Strongly disagree
7%
Total
100%
Q19b. Our company’s efforts to combat cyber attacks can be made more effective by
developing holistic or end-to-end solutions to network security.
Pct%
Strongly agree
30%
Agree
45%
Unsure
10%
Disagree
9%
Strongly disagree
6%
Total
100%
Q20. What percentage of your IT budget is dedicated to security alone?
Pct%
Less than 5%
16%
5 to 10%
36%
11 to 25%
21%
26 to 50%
6%
51 to 75%
0%
More than 75%
1%
Cannot determine
20%
Total
100%
Q21. In which area of security do you plan to spend the most IT dollars in the next 12 to
18 months?
Pct%
Network security
47%
Device or endpoint security
26%
Mobile security
18%
Cloud security
9%
Other (please specify)
0%
Total
100%
Ponemon Institute© Research Report Page 22
Q22. Who in your organization is most responsible for ensuring that network security
operations are effective at combating cyber attacks?
Pct%
Chief information officer
54%
Chief information security officer
21%
Chief security officer
10%
Chief compliance officer
4%
Risk management leader
6%
Fraud prevention unit leader
2%
Data center management
3%
Chief executive officer
0%
Chief financial officer
0%
Other (please specify)
0%
Total
100%
Q23. What are the most serious challenges to ensuring that network security operations
are effective at combating cyber attacks? Please select only the top three choices.
Pct%
Available resources
48%
Conflicting priorities
29%
Lack of leadership and accountability
15%
Complexity of security operations
48%
Availability of enabling technologies
18%
Employee awareness
33%
Policies and procedures
5%
Monitoring and enforcement
3%
Other (please specify)
0%
Total
199%
Q24a. Does your company have a written corporate security policy?
Pct%
Yes
56%
No
25%
Unsure
19%
Total
100%
Q24b. If yes, is the corporate security policy readily accessible, either online or offline,
by your employees and authorized users?
Pct%
Yes
49%
No
45%
Unsure
6%
Total
100%
Ponemon Institute© Research Report Page 23
Part 2. Your role and organization
D1. What organizational level best describes your current position?
Pct%
Senior Executive
2%
Vice President
1%
Director
17%
Manager
23%
Supervisor
19%
Technician
34%
Staff
2%
Contractor
2%
Other
0%
Total
100%
D2. Is this a full time position?
Pct%
Yes
99%
No
1%
Total
100%
D3. Check the Primary Person you or your immediate supervisor reports to within the
organization.
Pct%
CEO/Executive Committee
0%
Chief Financial Officer
2%
General Counsel
2%
Chief Information Officer
53%
Chief Technology Officer
5%
Chief Information Security Officer
19%
Compliance Officer
2%
Chief Privacy Officer
1%
Human Resources VP
2%
Chief Security Officer
4%
Chief Risk Officer
6%
Other (please specify)
4%
Total
100%
D4. Total years of relevant experience:
Pct%
Total years of IT or security experience (mean value)
9.57
Total years in current position (mean value)
4.19
D5. Gender
Pct%
Female
21%
Male
79%
Total
100%
Ponemon Institute© Research Report Page 24
D6. What industry best describes your organization’s industry focus?
Pct%
Communications
5%
Defense
2%
Education
1%
Energy
1%
Entertainment & media
5%
Financial services
20%
Health & pharmaceutical
12%
Hospitality
3%
Industrial
6%
Public sector
16%
Research
1%
Retail
10%
Services
6%
Technology & Software
5%
Transportation
6%
Other
1%
Total
100%
D7. Where are your employees located? (Check all that apply):
Pct%
United States
100%
Canada
64%
Europe
61%
Middle East & Africa
20%
Asia-Pacific
58%
Latin America (including Mexico)
52%
D8. What is the worldwide headcount of your organization?
Pct%
Less than 500 people
9%
500 to 1,000 people
13%
1,001 to 5,000 people
27%
5,001 to 25,000 people
26%
25,001 to 75,000 people
13%
More than 75,000 people
12%
Total
100%
Ponemon Institute© Research Report Page 25
Ponemon Institute
Advancing Responsible Information Management
Ponemon Institute is dedicated to independent research and education that advances responsible
information and privacy management practices within business and government. Our mission is to conduct
high quality, empirical studies on critical issues affecting the management and security of sensitive
information about people and organizations.
As a member of the Council of American Survey Research Organizations (CASRO), we uphold strict
data confidentiality, privacy and ethical research standards. We do not collect any personally identifiable
information from individuals (or company identifiable information in our business research). Furthermore, we
have strict quality standards to ensure that subjects are not asked extraneous, irrelevant or improper
questions.