Risk of cancer from diagnostic X-rays: estimates for the UK and 14 other countries docx
Bạn đang xem bản rút gọn của tài liệu. Xem và tải ngay bản đầy đủ của tài liệu tại đây (112.31 KB, 7 trang )
For personal use. Only reproduce with permission from The Lancet publishing Group.
ARTICLES
THE LANCET • Vol 363 • January 31, 2004 • www.thelancet.com
345
Summary
Background Diagnostic X-rays are the largest man-made
source of radiation exposure to the general population,
contributing about 14% of the total annual exposure
worldwide from all sources. Although diagnostic X-rays
provide great benefits, that their use involves some small
risk of developing cancer is generally accepted. Our aim was
to estimate the extent of this risk on the basis of the annual
number of diagnostic X-rays undertaken in the UK and in
14 other developed countries.
Methods We combined data on the frequency of diagnostic
X-ray use, estimated radiation doses from X-rays to
individual body organs, and risk models, based mainly on
the Japanese atomic bomb survivors, with population-based
cancer incidence rates and mortality rates for all causes of
death, using life table methods.
Findings Our results indicate that in the UK about 0·6% of
the cumulative risk of cancer to age 75 years could be
attributable to diagnostic X-rays. This percentage is
equivalent to about 700 cases of cancer per year. In 13
other developed countries, estimates of the attributable risk
ranged from 0·6% to 1·8%, whereas in Japan, which had the
highest estimated annual exposure frequency in the world, it
was more than 3%.
Interpretation We provide detailed estimates of the cancer
risk from diagnostic X-rays. The calculations involved a
number of assumptions and so are inevitably subject to
considerable uncertainty. The possibility that we have
overestimated the risks cannot be ruled out, but that we
have underestimated them substantially seems unlikely.
Lancet 2004; 363: 345–51
See Commentary page 340
Introduction
Diagnostic X-rays are the largest man-made source of
radiation exposure to the general population,
contributing about 14% of total worldwide exposure
from man-made and natural sources.
1
However,
although diagnostic X-rays provide great benefits, that
their use involves some risk of developing cancer is
generally accepted. The risk to an individual is probably
small because radiation doses are usually low (typically
<10 mGy), but the large number of people exposed
annually means that even small individual risks could
translate into a considerable number of cancer cases.
Small risks are difficult to study directly in epidemio-
logical studies.
2
However, the risk from diagnostic
X-rays can be estimated by extrapolating risk estimates
from populations exposed to a range of doses, such
as the Japanese atomic bomb survivors exposed at
0–4 Gy.
1
In 1981, Doll and Peto
3
estimated that about 0·5% of
cancer deaths in the USA were attributable to diagnostic
X-rays. Since then, use of this diagnostic method has
increased in most developed countries.
1
There is also
wide variation in frequency of use from country to
country.
1
Our aim was, therefore, to estimate the risk of
cancer on the basis of the annual use of diagnostic X-rays
in the UK and in 14 other developed countries for which
sufficient data are available.
Methods
We estimated the cumulative risk, to age 75 years, that an
individual will develop a cancer caused by diagnostic
X-rays,
4
using models for the risk of incident cancer
after radiation exposure, estimates of the average annual
frequency of exposure for each type of diagnostic
X-ray, estimates of the organ-specific radiation doses
delivered by each X-ray type, and cancer incidence
and all-cause mortality rates for the 15 populations
being studied—ie, UK, Australia, Canada, Croatia,
Czech Republic, Finland, Germany, Japan, Kuwait, the
Netherlands, Norway, Poland, Sweden, Switzerland, and
the USA. The source of this information is described
below, and details of the calculations are provided in
the webappendix (http:// image.thelancet.com/extras/
03art4007webappendix.pdf).
Models for risk of cancer from radiation exposure
For cancers of the oesophagus, stomach, colon, liver,
lung, bladder, and thyroid, we used linear models in
which the extra risk from the X-ray exposure multiplies
the population cancer rate by a specific amount—ie,
excess relative risk models. These models were based on
cancer incidence data from the Japanese atomic bomb
survivors and were taken from a review by the United
Nations,
1
except the model for lung cancer risk, which
was taken from an analysis of smoking and radiation
exposure in the atomic bomb survivors.
5
For leukaemia
Risk of cancer from diagnostic X-rays: estimates for the UK and
14 other countries
Amy Berrington de González, Sarah Darby
Cancer Research UK Epidemiology Unit (A Berrington de González DPhil)
and Clinical Trial Service Unit and Epidemiological Studies Unit
(Prof S Darby
PhD), University of Oxford, Radcliffe Infirmary,
Oxford, UK
Correspondence to: Dr Amy Berrington de González, Cancer
Research UK Epidemiology Unit, University of Oxford, Gibson
Building, Radcliffe Infirmary, Oxford OX2 6HE, UK
(e-mail: )
Articles
For personal use. Only reproduce with permission from The Lancet publishing Group.
and breast cancer, we used models in which the extra risk
from diagnostic X-ray exposure adds to the population
rate—ie, excess absolute risk models. For leukaemia,
excluding chronic lymphocytic leukaemia, we used a
linear-quadratic model based on data from the Japanese
atomic bomb survivors.
6
For breast cancer, we used a
linear risk model based on a pooled analysis of four
selected cohorts, including the Japanese atomic bomb
survivors.
7
The lung cancer model included parameters
for sex and attained age. All other models included
parameters for sex and age at exposure, and for leukaemia
and breast cancer attained age was also included.
UK exposure frequency
We based the frequency of exposure of the population to
diagnostic X-rays on a worldwide survey of medical
radiation use between 1991 and 1996.
1
This survey,
which is the most recent that is available, gives the total
annual number of exposures per 1000 population for the
most common diagnostic X-ray and CT examinations in
each country, but does not give the frequency according
to age and sex. The most detailed information available
on the age and sex distribution of diagnostic X-rays is
provided in a British survey undertaken in 1977.
8
Therefore, we estimated the age-specific (0–1, 2–4, 5–9,
. . ., 30–39, . . ., and у60 years) and sex-specific annual
frequencies by combining the most recent estimate of
total annual frequency of each examination type from the
worldwide survey
1
with the age-specific and sex-specific
frequencies from the British survey (see webappendix).
8
We estimated the distribution of CT examinations by age
and sex in the same way, using age (0–9, . . .,
70–79 years) and sex frequencies from a British survey
9
of
CT practice in the UK undertaken in 1989 combined with
the most recent total annual frequency data from the
worldwide survey.
1
For mammography screening, average
annual exposure was based on data from the UK National
Health Service (NHS) Breast Screening Programme,
10
which suggest that 70% of women aged 50–64 years attend
for breast screening once every 3 years.
ARTICLES
346 THE LANCET • Vol 363 • January 31, 2004 • www.thelancet.com
Organ
Bladder Breast Colon Liver Lung Oesophagus* RBM Stomach Thyroid
X-ray type
Abdomen 1·14 0·05 1·63 1·10 0·27 0·03 0·37 1·64 0·03
Coronary angiography 0·23 0·42 0·51 1·54 37·69 13·79 7·39 0·67 1·08
Cerebral angiography 0·00 0·02 0·00 0·01 1·14 1·98 9·27 0·01 25·06
Barium meal 0·28 0·62 1·82 9·48 1·23 0·54 1·69 8·24 0·22
Barium enema 14·45 0·14 21·51 3·55 0·39 0·06 7·49 4·98 0·01
Cardiac catheterisation 0·23 0·42 0·51 1·54 37·69 13·79 7·39 0·67 1·08
Cervical spine 0·00 0·00 0·00 0·00 0·07 0·12 0·07 0·00 0·84
Chest 0·00 0·01 0·00 0·03 0·07 0·04 0·02 0·02 0·01
Hip 1·16 0·00 0·71 0·01 0·00 0·00 0·12 0·02 0·00
Hysterosalpingography 4·67 0·00 2·82 0·01 0·00 0·00 0·81 0·03 0·00
Intravenous urogram (IVU) 4·42 0·20 5·10 3·49 0·42 0·03 0·83 6·04 0·00
Lumbar myelography 7·90 0·01 10·85 1·30 0·04 0·01 4·06 1·62 0·00
Lumbar spine 2·49 0·03 2·40 2·16 0·15 0·02 0·68 1·51 0·00
Mammography (1-view screen) 0·00 2·00 0·00 0·00 0·00 0·00 0·00 0·00 0·00
Pelvis 2·13 0·01 1·85 0·13 0·01 0·00 0·25 0·29 0·00
Skull 0·00 0·00 0·00 0·00 0·01 0·02 0·12 0·00 0·14
Thoracic spine 0·00 0·47 0·00 0·57 2·25 1·15 0·55 0·25 2·97
CT: abdomen 5·07 0·72 6·60 0·05 2·70 0·56 5·58 22·20 0·05
CT: chest 0·02 21·40 0·07 5·64 22·40 28·30 5·94 4·06 2·25
CT: head 0·00 0·03 0·00 0·01 0·09 0·07 2·67 0·00 1·85
CT: internal auditory meatus 0·00 0·02 0·00 0·01 0·08 0·07 0·83 0·00 2·03
CT: orbits 0·00 0·01 0·00 0·00 0·04 0·03 1·05 0·00 0·87
CT: pituitary 0·00 0·01 0·00 0·00 0·04 0·03 0·96 0·00 0·77
CT: pelvis 23·20 0·03 15·10 0·68 0·05 0·01 5·62 1·06 0·00
CT: cervical spine 0·00 0·09 0·00 0·03 0·58 0·51 1·12 0·02 43·90
CT: thoracic spine 0·00 27·70 0·02 1·48 13·40 15·70 2·92 0·98 0·46
CT: lumbar spine 0·67 0·13 3·30 6·88 0·34 0·08 2·52 10·50 0·01
RBM=red bone marrow. *CT scan doses not available and assumed equal to thymus dose.
Table 1: Estimated organ-specific radiation doses (mGy)
11–13
by type of diagnostic X-ray
0–4
5–9
10–14
15–19
20–24
25–29
30–34
35–39
40–44
45–49
50–54
55–59
у60
Colon
Bladder
Stomach
Lung
Red bone marrow
Liver
Oesophagus
Thyroid
Breast
Age group (years)
Annual dose (mGy)
Males
Females
0
0·2
0·4
0·6
0·8
1·0
0
0·2
0·4
0·6
0·8
1·0
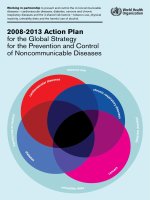
Figure 1: Estimated average annual radiation dose per person
from diagnostic X-rays in UK population for various organs
For personal use. Only reproduce with permission from The Lancet publishing Group.
UK organ-specific radiation doses
The relevant measure of dose for the risk of a specific
type of cancer is the absorbed dose to the appropriate
organ of the body, known as the organ-specific radiation
dose. We estimated these doses by combining
information from a Finnish study (1993–96)
11
with a
recent review of doses to patients from medical X-rays
in the UK
12
(see webappendix). We took organ dose
estimates for CT scans from the British survey of CT
practice.
13
Breast doses from mammography screening
were taken from a 1997–98 UK survey (assuming a two-
view screen at all screening rounds).
14
Frequency and organ-specific dose information were
available for 27 common types of X-ray procedures,
comprising 86% of the annual collective effective dose
from diagnostic X-rays.
15
Table 1 shows the organ-
specific doses for each procedure. We combined these
doses with the age-specific and sex-specific annual
X-ray frequencies and then multiplied by 100/86, to
account for the X-ray procedures for which frequency
and dose information were not available, to estimate the
average annual radiation dose per person delivered to
each main organ in the body, according to age and sex
(figure 1).
ARTICLES
THE LANCET • Vol 363 • January 31, 2004 • www.thelancet.com
347
Males Females
Cumulative Attributable Cancer cases Cumulative Attributable Cancer cases
risk (%) risk (%)* per year† risk (%) risk (%)* per year†
Radiation- Population Radiation- Population Radiation- Population Radiation- Population
induced induced induced induced
Cancer type (ICD-9 code)
Oesophagus (150) 0·002 0·67 0·3 5 1731 0·002 0·33 0·6 6 938
Stomach (151) 0·006 1·33 0·4 15 3370 0·005 0·55 0·9 14 1580
Colon (153) 0·014 1·56 0·9 34 4023 0·026 1·45 1·8 73 4243
Liver (155) 0·001 0·18 0·6 2 477 0·001 0·09 1·3 2 267
Lung (162) 0·007 5·50 0·1 21 13 850 0·013 2-46 0·5 40 7217
Breast (174) ·· ·· ·· ·· ·· 0·009 6·77 0·1 29 21164
Bladder (188) 0·034 1·70 2·O 85 4328 0·009 0·56 1·7 26 1623
Thyroid (193) <0·0001 0·06 0·4 1 184 0·001 0·15 0·8 3 495
Leukaemia (204–208, O·OO8 O·60 1·4 27 1736 0·008 0·42 1·9 26 1322
excluding 204.1)
All cancers listed above 0·072 11·60 0·6 190 29 699 0·074 12·77 0·6 219 38 849
All radiation-inducible cancers‡ 0·123 20·40 0·6§ 341 53 399 0·126 20·83 0·6§ 359 63 856
All cancers 0·123 21·68 0·6 341 57 178 0·126 21·79 0·6 359 66 881
*% of cumulative risk attributable to radiation=radiation-induced cumulative risk*100/population cumulative risk. †estimated number of cases per year based on
1998 UK population. ‡ICD-9 140–239, but excluding 200–203 (lymphomas and multiple myeloma) and 204.1 (chronic lymphocytic leukaemia). §Attributable risk
for all radiation-inducible cancers assumed equal to that for all cancers specifically listed.
Table 2: Estimated cumulative risk of cancer to age 75 years and number of cancer cases per year from diagnostic X-rays in
the UK
0–4
5–9
10–14
15–19
20–24
25–29
30–34
35–39
40–44
45–49
50–54
55–59
60–64
65–69
70–74
Colon
Bladder
Leukaemia
Lung
Oesophagus
Stomach
Liver
Thyroid
Breast
Females
Males
Age group (years)
Age-specific risk (%)
0·0025
0·0020
0·0015
0·0010
0·0005
0
0·0025
0·0020
0·0015
0·0010
0·0005
0
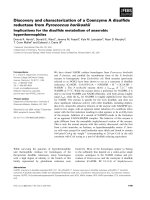
Figure 2: Estimated annual risk of radiation-induced cancer
from diagnostic X-rays in 5-year age groups in UK population
Cases of radiation-induced Cases per
cancer per year* million
Males Females Total
examinations*
X-ray type
Abdomen 16 15 31 30
Barium meal 5 6 11 40
Barium enema 27 28 55 170
Chest 1 3 4 1
Coronary 13 28 41 280
angiography
CT scan 31 39 70 60
Cerebral 1 1 2 180
angiography
Hip or pelvis 28 24 52 30
Lumbar spine 23 16 39 40
Screening ·· 888
mammography
Thoracic spine 2 4 6 20
Each other type <10 <10 <20 ··
*Includes only nine cancer sites listed in Table 2. Detailed estimation of
number of radiation-induced cases for all cancers is not possible, since
estimates of organ-specific doses are not available for other cancers.
Table 3: Estimated number of radiation-induced cases of
cancer per year in the UK by type of X-ray
For personal use. Only reproduce with permission from The Lancet publishing Group.
Extension to all cancers
For each of the nine cancer types mentioned, we had all
the necessary information to calculate site-specific
radiation-induced cancer risks. For other solid cancers,
neither detailed risk models nor appropriate organ-
specific radiation doses were available. However, when
these cancers are considered together as a group, there is
strong evidence that they are radiation-inducible with a
proportionate increase per Gy close to that for the nine
listed cancers combined.
1
In the UK these nine cancer
sites account for 56% of total cumulative risk of all solid
cancers to age 75 years in men and for 61% in women.
Among the remainder, the largest components are
prostate (9%) and rectal cancer (6%) in men, and ovarian
(6%), cervical (6%), and endometrial cancer (4%) in
women. Therefore, to obtain an estimate of the total risk
of solid cancers and leukaemia from diagnostic X-rays,
we assumed that the percentages of the cumulative
risk attributable to radiation from diagnostic X-rays
for the sum of the nine listed cancers and for all
radiation-inducible cancers were the same. Since there
is little evidence that chronic lymphocytic leukaemia,
lymphomas, or multiple myeloma are radiation-inducible
1
we excluded them from the estimation of radiation-
induced risk.
UK cancer incidence and all-cause mortality rates
We used cancer incidence rates for England and Wales
(1988–92) for male and female individuals in 5-year age
bands.
16
Lung cancer incidence rates for lifelong non-
smokers in a US cancer prevention study
17
were used for
the estimation of radiation-induced lung cancer. We
calculated all-cause survival probabilities with 1998 UK
all-cause mortality rates.
18
Sensitivity analysis for UK results
We assessed uncertainty in the UK estimated cumulative
risks by varying the assumptions in the calculations.
First, since individuals who receive diagnostic X-rays
are probably less healthy than the general population,
we increased all-cause mortality rates by 10% and by
50%. Second, we included a low-dose effectiveness
reduction factor of two, halving the risks per unit dose for
cancers other than leukaemia.
1
Third, we assumed that
the radiation-induced risk lasted for 40 years rather than
indefinitely. Fourth, we increased and decreased the
estimates of organ dose by 30%. Fifth, we calculated
95% CI for the cumulative risks with the standard errors
in the X-ray frequency data from the British survey.
8
Finally, we re-estimated risks with alternative excess
relative risk models based on studies of adults in Europe
or North America irradiated for medical purposes,
1
rather
than the models from the Japanese atomic bomb
survivors.
Data for populations other than the UK
We derived cumulative risk estimates for all populations
classified as health-care level 1—ie, more than one
doctor per 1000 population
1
—for which data on X-ray
frequency, cancer incidence, and all-cause mortality
rates were available from the same sources as for the
UK—namely, Australia, Canada, Croatia, Czech
Republic, Finland, Germany, Japan, Kuwait,
Netherlands, Norway, Poland, Sweden, Switzerland, and
USA. Since population-specific estimates were not
available, we used the UK age and sex distributions of
diagnostic X-rays and organ-specific radiation dose
estimates throughout. For the USA, only the frequencies
of CT scans and of all types of X-ray examinations
combined were available.
1
Therefore, we estimated USA
age-specific and sex-specific frequencies for each X-ray
type with the age-specific and sex-specific frequency in
the UK
8
multiplied by the ratio of 1991–96 total USA X-
ray frequency to 1991–96 UK total frequency. No data
were available for the annual frequency of CT
examinations in Japan. We therefore used the average
frequency for all health-care level 1 countries
1
in the main
calculations. We estimated mammography screening
ARTICLES
348 THE LANCET • Vol 363 • January 31, 2004 • www.thelancet.com
<1 year 1–14 years 15–34 years 15–54 years 55–74 years All
Males Females Males Females Males Females Males Females Males Females Males Females
Cancer type (ICD-9 code)
Oesophagus (150) 0 0 1 1 1 1 2 2 1 1 5 6
Stomach (151) 0 0 2 2 5 5 6 5 2 2 15 14
Colon (153) 1 2 6 12 11 27 11 24 4 8 34 73
Liver (155) 0 0 0 0 1 0 1 1 0 1 2 2
Lung (162) 0 0 2 7 6 8 9 19 3 6 21 40
Breast (174) 0 3 9 13 3 29
Bladder (188) 6 2 27 8 34 12 16 5 3 1 85 26
Thyroid (193) 0 0 0 1 0 2 0 0 0 0 1 3
Leukaemia (204–208, excluding 204.1) 0 0 2 1 7 4 11 13 6 7 27 26
All cancers listed above†‡ 8 5 41 36 65 68 57 81 19 28 190 219
All cancers‡ 15 8 74 59 117 112 103 133 35 47 341 359
% of total 4% 2% 22% 16% 34% 31% 30% 37% 10% 13% 100% 100%
% of total—both sexes 3% 19% 33% 34% 11% 100%
*Estimated number of cancer cases per year based on 1998 UK population. †Number of cancers contributed by CT scans for exposures at ages <1 year, 1–14,
15–34, 35–54, and 55–74 years estimated to be 1, 3, 10, 12, and 5 for males, and 1, 4, 11, 17, and 6 for females.
‡Number of cases in body of table rounded and
do not always, therefore, add up to the totals given.
Table 4: Estimated number of radiation-induced cases of cancer per year* in the UK by age at exposure
Radiation-induced
lifetime risk*
Males Females
Assumption
Original assumptions 100 100
All-cause mortality rates increased by 10% 93 95
All-cause mortality rates increased by 50% 80 87
Low-dose effectiveness reduction factor of 2 54 52
Risk persistence of 40 years rather than indefinitely 75 86
Organ dose estimates increased or decreased by 30% 70–130 70–130
X-ray frequency increased or decreased to limits 40–160 60–140
of 95% CI
Different risk models (lowest and highest)† 87–269 33–133
*Expressed as a percentage of risks calculated under original assumptions.
†Maximum and minimum risks obtained by considering different risk models
based on a recent survey.
1
Table 5: Effect of varying assumptions on UK radiation-induced
cumulative risk estimates
For personal use. Only reproduce with permission from The Lancet publishing Group.
exposures for countries with nationwide breast-screening
programmes (Australia, Finland, Netherlands, and
Sweden) and also for the USA, where mammography is
common.
19
For each of these countries, we assumed 70%
of women aged 50–69 years were screened biennially.
Where appropriate, we combined data from several cancer
registries to give an overall estimate for each population.
For the USA, we combined data for black and white
individuals.
Role of the funding source
The sponsors of the study had no role in study design, data
collection, data analysis, data interpretation, or writing of
the report.
Results
We estimate that diagnostic X-ray use in the UK causes
0·6% of the cumulative risk of cancer to age 75 years in
men and women (table 2), equivalent to 700 cases per
year for both sexes combined. Of the nine cancers
listed in table 2, bladder cancer accounted for the
largest number of radiation-induced
cases per year in men, followed by colon
cancer and leukaemia. In women, of the
nine listed cancers, colon cancer made
the greatest contribution to the annual
total followed by cancers of the lung and
breast. For most cancers, the estimated
annual radiation-induced cancer risk
started to rise from about age 40 years,
and was still rising at age 70 years
(figure 2): only 2% of radiation-induced
cases arose before age 40 years, and 56%
arose between age 65 years and 74 years.
The higher colon-cancer cumulative risk
in females compared with males was
mainly due to the larger parameter in the
radiation risk model, whereas the higher
cumulative risk of bladder cancer in
males compared with females was
mainly due to higher rates of bladder
cancer in the general population.
The number of cancer cases attributed
to each X-ray type depends in part on
frequency and radiation dose, but also
on the irradiated organs, their radiosensitivity, and the
age distribution of those given X-rays. CT scans were
responsible for the largest number of cases of the nine
listed cancers followed by barium enemas and hip and
pelvis X-rays (table 3). CT scans in childhood (before age
15 years) accounted for nine cancers (13% of the total
for CT scans; table 4). The estimated average number
of cases of cancer per million examinations varied
widely with the type of X-ray, from eight or fewer
for examinations such as mammography and chest X-rays,
which deliver low radiation doses and are predominantly
given to older adults, up to 280 for coronary angiography,
which delivers higher radiation doses, particularly to
the lungs (about 40 mGy per examination). Neonatal
exposures (age <1 year) accounted for 3% of radiation-
induced cancers, whereas exposures in childhood
(1–14 years) accounted for 19% (table 4).
Increasing all-cause mortality rates by 10% and 50%
reduced the radiation-induced risks by 7% and 20%,
respectively, in men and by 5% and 13% in women
(table 5). The introduction of a low-dose effectiveness
ARTICLES
THE LANCET • Vol 363 • January 31, 2004 • www.thelancet.com
349
Annual X-rays Males Females Total
per 1000*
Attributable Cases Attributable Cases Attributable Cases
risk (%) cancer per year risk (%) cancer per year risk (%) cancer per year
Country
Australia 565 1·22041·5 227 1·3431
Canada 892 1·14061·0 378 1·1784
Croatia 903 1·5662·2 103 1·8169
Czech Republic 883 0·9671·2 105 1·1172
Finland 704 0·7200·7300·750
Germany 1254 1·39631·7 1086 1·5 2049
Japan† 1477 2·9 3724 3·8 3863 3·2 7587
Kuwait 896 0·7250·6150·740
Netherlands 600 0·71000·7 108 0·7208
Norway 708 1·3281·1491·277
Poland 641 0·5990·7 192 0·6291
Sweden 568 1·1910·8710·9162
Switzerland 750 1·0931·0801·0173
UK 489 0·63410·6 359 0·6700
USA 962 0·9 2573 1·0 3122 0·9 5695
*Taken from worldwide survey.
1
†Estimates assume annual frequency of CT examinations in Japan was equal to that for all health-care level 1 countries. However,
number of CT scanners per million population in Japan is 3·7 times that for all health-care level 1 countries. If this number is reflected in annual frequency of CT
examinations, then for Japan estimated annual number of X-rays per 1000 increases to 1573 and the attributable risk increases to 4·4%, corresponding to
9905 cases of cancer per year.
Table 6: Frequency of diagnostic X-rays per 1000 population, percentage of cumulative cancer risk to age 75 years attributable to
diagnostic X-rays, and number of radiation-induced cases of cancer per year for 15 countries
Annual X-ray frequency (per 1000 population)*
Attributable risk (%)
0
0
250
0·5
UK
Australia
Netherlands
Poland
Kuwait
USA
Sweden
Norway
Croatia
Germany
Japan
Canada and Czech Republic
Finland
Switzerland
1·0
1·5
2·0
2·5
3·0
3·5
500 750 1000 1250 1500
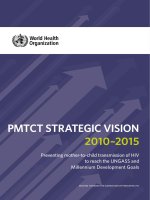
Figure 3: Risk of cancer attributable to diagnostic X-ray exposures versus annual
X-ray frequency
*Taken from worldwide survey.
1
For personal use. Only reproduce with permission from The Lancet publishing Group.
reduction factor of 2 for all cancers except leukaemia
(for which a linear-quadratic dose-response relation was
assumed throughout) approximately halved the risk. The
assumption that the radiation-induced risk lasted for
40 years rather than indefinitely reduced risks by 25%
in males and 14% in females. Increasing or decreasing
organ dose estimates increased or decreased the
estimated risks approximately proportionally, as did
uncertainty in the X-ray frequencies. Use of different risk
models can more than double the risks in males, mainly
due to higher lung-cancer coefficients. By contrast, use
of different risk models in females increased the risk by
no more than 30%, but could reduce it by up to 70%,
mainly due to lower colon-cancer coefficients.
Of the 15 countries studied, the UK had the lowest
annual frequency of diagnostic X-rays and Japan the
highest (table 6 and figure 3).
1
Japan also had the highest
attributable risks, with 3·2% of the cumulative risk
of cancer attributable to diagnostic X-rays, equivalent
to 7587 cases of cancer per year. In all other populations
less than 2% of the cumulative cancer risk was
attributable to diagnostic X-rays; Croatia and Germany
had the highest proportions at 1·8% and 1·5%,
respectively, whereas Poland and the UK had the lowest
(both 0·6%).
Discussion
Radiation is one of the most extensively researched
carcinogens, but the effects of low doses are still
somewhat unclear. Our estimates are based on the
assumption that small doses of radiation can cause
cancer. The weight of evidence from experimental and
epidemiological data does not suggest a threshold dose
below which radiation exposure does not cause cancer.
20
If there is no threshold then diagnostic X-rays will induce
some cancers.
To calculate our estimates, we had to make several
other assumptions. We assumed that individuals who
receive diagnostic X-rays have mortality rates equal
to those of the general population; that low doses
of radiation are as harmful per unit dose as doses up
to 4 Gy;
20
and that radiation-induced risks persist
indefinitely. If any of these assumptions is incorrect, the
radiation-induced cumulative risks will be lower than
those estimated, possibly by up to 50%. There is also
uncertainty in the organ doses associated with each X-ray
procedure, in the age-specific frequency of the various
procedures, in the appropriate model for radiation-
induced risks, and in the extension of risk from the nine
specified cancers to all radiation-inducible cancers. If the
latter assumptions are incorrect then the risks stated
could either increase or decrease.
The only previous estimates for diagnostic X-rays as a
whole were for the USA
3
and Germany.
21
Both studies
used cruder methods, which did not account for age and
sex variation in X-ray exposures or radiation risks.
Furthermore, neither study estimated risks for each
cancer site separately, using organ-specific radiation
doses. Our results for the USA suggest that 0·9% of
cancers could be caused by diagnostic X-rays, almost
double the 1981 estimate of 0·5% of cancer mortality.
3
This difference might be due to our detailed methods,
although our US estimates used cruder data than for
other populations. It might also be due to the use of
cancer incidence rather than mortality and to the 20%
increase in the average annual X-ray frequency between
1980–84
22
and 1991–96.
1
For Germany, our estimated
risk of 1·5% was slightly lower than the 1997 estimate
of 2%.
21
Organ-specific radiation doses could vary with age, with
doses in paediatric radiology probably being lower than in
adults for many common radiographic and fluoroscopic
examinations,
23
but possibly higher for CT scans.
24
Brenner
and colleagues
25
estimated that the cumulative risk of
cancer mortality from CT examinations in the USA is
about 800 radiation-induced cancer deaths per million
examinations in children aged younger than 15 years. This
calculation used age-specific adjustments, resulting in
doses for children up to four times higher than those for
adults. In a more recent study,
24
a detailed calculation of
age-specific adjustments estimated that doses to 0–1 year
olds were at most 2·5 times higher than adult doses, and
for children aged 2–15 years were at most 1·8 times higher
than adult doses. We estimated that childhood CT scans
cause nine cases of the nine specified cancers per year in
the UK. If we had used the recent estimates of the age-
specific radiation doses, this number would have increased
to 16 cases. There is concern that radiation doses from CT
scans are very variable and could still be unnecessarily
high,
26
especially since the frequency of CT examinations is
increasing in many countries, in particular for children.
26,27
Furthermore, results of a UK survey
28
noted that most
doctors generally underestimate the radiation doses
received from commonly requested radiological
investigations.
Our cumulative risks were truncated at age 75 years,
since cancer incidence and mortality data were not
available for older individuals for all the included
countries. However, in the UK, about 20% of cancer
cases are diagnosed in those aged 75 years and older.
Therefore, the total annual number of cases of cancer
attributable to diagnostic X-rays at all ages in the UK
could be around 20% higher than the number presented
here. Reducing either the radiation doses per examination
or the frequency of exposure could reduce, approximately
proportionally, the annual number of radiation-induced
cancer cases per year. However, of the countries studied,
the UK had the lowest annual X-ray frequency per 1000
population and the joint lowest estimate of the proportion
of cumulative cancer risk attributable to diagnostic
X-rays. A survey of UK practice
29
has suggested that the
comparatively low frequency of diagnostic X-ray use is
due in part to the detailed guidance for doctors on the
indicators for X-ray examinations issued by the Royal
College of Radiologists.
30
Although there are clear benefits from the use of
diagnostic X-rays, that their use involves some risk of cancer
is generally acknowledged. We provide detailed estimates of
these risks. Our calculations depended on a number of
assumptions, however, and so are inevitably subject to
considerable uncertainty. The possibility that we have
overestimated the risks cannot be ruled out, but it seems
unlikely that we have underestimated them substantially.
Contributors
A Berrington de González had the original idea for this study, acquired
the data, did the calculations, and wrote the initial draft of the
manuscript. Both authors contributed to design of the study,
interpretation of the results, and critical revision of the manuscript. Both
authors discussed and approved the final version.
Conflict of interest statement
None declared.
Acknowledgments
We thank Richard Doll and Valerie Beral from the University
of Oxford, UK, and Barry Wall and Colin Muirhead from the National
Radiological Protection Board, UK, for their helpful comments on
the calculations and on the manuscript. The study was sponsored
by Cancer Research UK.
ARTICLES
350 THE LANCET • Vol 363 • January 31, 2004 • www.thelancet.com
For personal use. Only reproduce with permission from The Lancet publishing Group.
References
1 United Nations Scientific Committee on the Effects of Atomic
Radiation. Sources and effects of ionizing radiation. New York:
United Nations, 2000.
2 Ron E. Cancer risks from medical radiation. Health Phys 2003;
85: 47–59.
3 Doll R, Peto R. The causes of cancer: quantitative estimates of
avoidable risks of cancer in the United States today. JNCI 1981;
66: 1193–266.
4 Thomas DC, Darby SC, Fagnani F, Hubert P, Vaeth M, Weiss K.
Definition and estimation of lifetime detriment from radiation
exposures: principles and methods. Health Phys 1992; 63: 259–72.
5 Pierce DA, Sharp GB, Mabuchi K. Joint effects of radiation and
smoking on lung cancer risk among atomic bomb survivors. Radiat
Res 2003; 159: 511–20.
6 Preston DL, Kusumi S, Tomonaga M, et al. Cancer incidence in
atomic bomb survivors, 3: leukaemia, lymphoma and multiple
myeloma, 1950–87. Radiat Res 1994; 137: S68–97.
7 Preston DL, Mattsson A, Holmberg E, Shore RE, Hildreth N,
Boice JD Jr. Radiation effects on breast cancer risk: a pooled analysis
of eight cohorts. Radiat Res 2002; 158: 220–35.
8 Kendall GM, Darby SC, Harries SV, Rae S. A frequency survey of
radiological examinations carried out in National Health Service
hospitals in Great Britain in 1977. Chilton: National Radiological
Protection Board, 1980.
9 Shrimpton PC, Hart D, Hillier MC, Wall BF, Faulkner K. Survey of
CT practice in the UK, 1: aspects of examination frequency and quality
assurance. Chilton: National Radiological Protection Board, 1991.
10 Statistical Bulletin. Breast Screening Programme, England: 2001/02.
London: Department of Health, 2003.
11 Ranniko S, Karila KTK, Toivonen M. Patient and population doses
of X-ray diagnostics in Finland. Helsinki: STUK, 1997.
12 Hart D, Hillier MC, Wall BF. Doses to patients from medical X-ray
examinations in the UK: 2000 review. Chilton: National Radiological
Protection Board, 2002.
13 Shrimpton PC, Hart D, Hillier MC, Wall BF, le Heron JC,
Faulkner K. Survey of CT practice in the UK, 2: dosimetric aspects.
Chilton: National Radiological Protection Board, 1991.
14 Young KC, Burch A. Radiation doses received in the UK Breast
Screening Programme in 1997 and 1998. Br J Radiol 2002; 73:
278–87.
15 Hart D, Wall BF. Radiation exposure of the UK popuation from
medical and dental X-ray examinations. Chilton: National
Radiological Protection Board, 2002.
16 Parkin DM, Pisani P, Ferlay J, Raymond L, Young J. Estimates of the
worldwide incidence of 25 major cancers in 1990. Int J Cancer 1999;
80: 827–41.
17 Peto R, Lopez AD, Boreham J, Thun M, Heath C Jr. Mortality from
tobacco in developed countries: indirect estimation from national vital
statistics. Lancet 1992; 339: 1268–78.
18 WHO. Statistical information system. />mort/text/download.cfm?/path=whosis,mort,mort_download&
language=english (accessed Dec 3, 2003).
19 International Agency for Research on Cancer. Breast cancer
screening. Lyon: IARC Press, 2002.
20 Upton AC. The state of the art in the 1990’s: NCRP report number
136 on the scientific bases for linearity in the dose-response
relationship for ionizing radiation. Health Phys 2003; 85: 15–22.
21 Kaul A, Bauer B, Bernhardt J, Nosske D, Veit R. Effective doses to
members of the public from the diagnostic application of ionizing
radiation in Germany. Eur Radiol 1997; 7: 1127–32.
22 United Nations Scientific Committee on the Effects of Atomic
Radiation. Sources and effects of ionizing radiation. New York:
United Nations, 1993.
23 Mooney R, Thomas PS. Dose reduction in a paediatric X-ray
department following optimization of radiographic technique.
Br J Radiol 1998; 71: 852–60.
24 Khursheed A, Hillier MC, Shrimpton PC, Wall BF. Influence of
patient age on normalized effective doses calculated for CT
examinations. Br J Radiol 2002; 75: 819–30.
25 Brenner DJ, Elliston CD, Hall EJ, Berdon WE. Estimated risks of
radiation induced fatal cancer from pediatric CT. Am J Roentgenol
2001; 176: 289–96.
26 Golding SJ, Shrimpton PC. Radiation doses in CT: are we meeting
the challenge? Br J Radiol 2002; 75: 1–4.
27 Maitino AJ, Levin DC, Parker L, Rao VM, Sunshine JH. Nationwide
trends in rates of utilization of noninvasive diagnostic imaging among
the Medicare population between 1993 and 1999. Radiology 2003;
227: 113–17.
28 Shiralkar S, Rennie A, Snow M, Galland RB, Lewis MH,
Gower-Thomas K. Doctors’ knowledge of radiation exposure:
questionnaire study. BMJ 2003; 327: 371–72.
29 Tanner RJ, Wall BF, Shrimpton PC, Hart D, Bungay DR. Frequency
of medical and dental examinations in the UK: 1997/98. Chilton:
National Radiological Protection Board, 2000.
30 Royal College of Radiologists. Making the best use of a department of
clinical radiology: guidelines for doctors, 5th edn. London: The Royal
College of Radiologists, 2003.
ARTICLES
THE LANCET • Vol 363 • January 31, 2004 • www.thelancet.com
351