Cancer of the Lung pot
Bạn đang xem bản rút gọn của tài liệu. Xem và tải ngay bản đầy đủ của tài liệu tại đây (475.01 KB, 8 trang )
National Cancer Institute 73 SEER Survival Monograph
INTRODUCTION
This study provides survival analyses for 201,067 histo-
logically confirmed adult cases of lung cancer diagnosed
from 1988 through 2001. Cases were obtained from the
Surveillance, Epidemiology, and End Results (SEER)
Program of the National Cancer Institute (NCI). The
SEER Program a sequel to two earlier NCI initiatives,
the End Results Program and the Third National Cancer
Survey has evolved in response to the National Cancer
Act of 1971, which requires the collection, analysis, and
dissemination of data relevant to the prevention, diag-
nosis, and treatment of cancer. This chapter focuses on
the influence of extent of disease, histologic grade, and
demographic factors on lung cancer survival.
MATERIALS AND METHODS
The NCI contracts with medically oriented nonprofit insti-
tutions such as universities and state health departments
to obtain data on all cancers diagnosed in residents of
the SEER geographic areas. SEER collects data on all
invasive and in situ cancers except basal cell and squamous
cell carcinomas of the skin and in situ carcinoma of the
uterine cervix.
SEER selects participating institutions on the basis of two
criteria: their ability to operate and maintain a population-
based cancer reporting system and the epidemiologic sig-
nificance of their population subgroups. At times, reg-
istries will withdraw; at times, registries will be added.
This analysis is based on data from 12 geographic areas,
which collectively contain about 14% of the total US
population. The areas are the States of Connecticut, Iowa,
New Mexico, Utah, and Hawaii; the metropolitan areas of
Detroit, Atlanta, San Francisco, Seattle, San Jose, and Los
Angeles; and 10 counties in rural Georgia. Los Angeles
contributed data for diagnosis years 1992 to 2001, the
others for 1988 to 2001.
To ensure maximal ascertainment of cancer cases, each reg-
istry abstracts the records of all cancer patients in hospitals,
laboratories, and all other health service units that provide
diagnostic services. Data collected by SEER registries
on each patient include patient demographics, primary
tumor site, tumor morphology, diagnostic methods, extent
of disease, and first course of cancer-directed therapy.
A separate record is coded for each primary cancer. All
patients are followed from diagnosis to death, allowing
detailed survival analysis.
SEER has collected extent of disease (EOD) information
on all cancers since the inception of the program. The
detail and amount of information collected, however, have
varied over time. In 1988, there were revisions to the lung
cancer EOD scheme allowing the SEER EOD informa-
tion to be collapsed into the TNM classification described
in the third edition of the American Joint Committee on
Cancer (AJCC) Manual for Staging of Cancer (1). The
AJCC TNM classification for lung cancer is the same as
that of the International Union Against Cancer.
Relative Survival
The survival analysis is based on relative survival rates
calculated by the life-table method. The relative rate is
used to estimate the effect of cancer on the survival of the
cohort. Relative survival, defined as observed survival
divided by expected survival, adjusts for the expected
mortality that the cohort would experience from other
causes of death. When relative survival is 100%, a patient
has the same chance to live 5 more years as a cancer-free
person of the same age and sex. For lung cancer, the
relative rate may underestimate survival slightly, since
the expected mortality tables are based on the entire US
population, whose expected survival is greater than the
smoking population’s expected survival.
Exclusions
The following were excluded from the analysis: patients for
whom lung cancer was not the first primary; cases identi-
fied through autopsy or death certificate only; persons of
unknown race; cases without active follow-up; patients
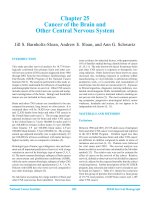
Lynn A. Gloeckler Ries and Milton P. Eisner
Chapter 9
Cancer of the Lung
Chapter 9 Cancer of the Lung
National Cancer Institute 74 SEER Survival Monograph
less than 20 years old; in situ cases; cases without micro-
scopic confirmation; and sarcomas. Table 9.1 details the
exclusions. There were 201,067 cases for analysis.
RESULTS
Overall, the relative survival rate was poor; only 15%
survived 5 years. In most of the following tables, each
prognostic factor is presented both individually and in
relation to a second factor.
Race and Sex
Overall, the 5-year relative survival rate for whites was
16% and for blacks was 12%. The overall 5-year relative
survival rates were 14% for males and 18% for females
(Table 9.2).
Geographic Location
Five-year relative survival rates in the 12 SEER areas
represented in this study ranged from 13% in New Mexico
and Rural Georgia to 17% in Connecticut (Table 9.3).
Stage of Disease
Lung cancer was seldom found (only 13.4%) when it
was still confined to the lung. Rather, over 60% of the
patients had stage III or IV disease at diagnosis. Twenty-
one percent of the cases did not have enough diagnostic
information to be staged. The stage distributions for
males and females were similar (Table 9.4).
Stage of disease was a strong predictor of survival, as
was expected. The 5-year relative survival rates ranged
from a high of 57% for stage I to a low of 2% for stage
IV (Table 9.4). Table 9.4 shows the survival rates for
males and females by stage. Females had higher survival
rates at all stages.
Sex, Stage, and Histology
Table 9.5 shows that the histologic type distributions of
lung cancers in males and females are somewhat differ-
ent. Adenocarcinomas comprise 41% of female cases but
only 33% of male cases, while squamous cell carcinomas
comprise 15% of female cases but 24% of male cases. The
other types are roughly equal in males and in females.
Based on 5-year relative survival rates for both sexes
combined, patients with adenocarcinoma survived longer
than those with squamous cell, large cell, or small cell
carcinoma for all stages combined and for stage I (Table
9.5). For stage II, however, patients with squamous cell
carcinoma had a slightly better survival rate than those
with adenocarcinoma.
For males, relative survival rates were similar for adeno-
carcinoma and squamous cell carcinoma for all stages,
but for stage I adenocarcinoma had higher survival and
for stage II squamous cell carcinoma had higher survival
(Figure 9.1). For females, relative survival rates were
higher for adenocarcinomas for stage I and II (Figure
9.2). Survival rates were more influenced by stage than
by histology. For non-small cell carcinoma and small cell
carcinoma, survival curves by stage are shown in figure
9.3 and 9.4, respectively. Survival rates are lower for
Table 9.1: Cancer of the Lung: Number of Cases and Exclusions by Reason, 12 SEER Areas, 1988-2001
Number Selected/Remaining Number Excluded Reason for Exclusion/Selection
273,521 0 Select 1988-2001 diagnosis (Los Angeles for 1992-2001 only)
225,617 47,904 Select first primary only
220,264 5,353 Exclude death certificate only or at autopsy
219,919 345 Exclude unknown race
219,768 151 Active follow-up and exclude alive with no survival time
219,713 55 Exclude children (Ages 0-19)
219,577 136 Exclude in situ cancers for all except breast & bladder cancer
201,502 18,075 Exclude no or unknown microscopic confirmation
201,067 435 Exclude sarcomas
Table 9.2: Cancer of the Lung: Number of Cases and 5-Year
Relative Survival Rates (RSR) (%) by Race and Sex, Ages
20+, 12 SEER Areas,1988-2001
Race
Male and
Female Male Female
Cases
5-Year
RSR
% Cases
5-Year
RSR
% Cases
5-Year
RSR
%
All
Races
201,067 15.5 117,472 13.6 83,595 18.0
White 165,487 15.9 94,728 13.9 70,759 18.4
Black 22,219 12.5 14,120 10.9 8,099 15.0
Other 13,361 ~ 8,624 ~ 4,737 ~
~ Rate not shown.
Chapter 9 Cancer of the Lung
National Cancer Institute 75 SEER Survival Monograph
small cell carcinoma, but even within small cell carcinoma,
survival rates vary by stage (Figure 9.4).
Sex, Stage, and Age
Table 9.6 presents the survival statistics by sex, stage,
and age at diagnosis. Females had better relative survival
rates than males. The largest differences were for stage I
cancers and very young or older patients. Females under
45 with stage I disease had a 72% 5-year relative survival
rate; in contrast, the rate was 41% for females 85 and
over. In general, younger patients survived better than
older patients for stage I and II disease. Survival rates
were poor for stage IV at all ages.
Laterality
Tumors were more frequently diagnosed in the right lung
than the left lung. But, survival rates were nearly identi-
cal for patients whose tumors arose in the right lung as
compared to the left lung (Table 9.7). ‘Other’ category
includes not a paired site, only one side - side unspeci-
fied, bilateral - single primary, and paired site (but no
information concerning laterality).
Subsite
Over 40% of the lung cancers originated in the upper
lobe no matter at which stage they were diagnosed. For
stage I, 61.6% of the cancers originated in the upper lobe
and 28.9% in the lower lobe. For stage II, 53.9% of the
cancers originated in the upper lobe and 34.1% in the
lower lobe. For stages III, IV, and unknown, the origin
Table 9.3: Cancer of the Lung: Number and Distribution of Cases and 1-, 2-, 3-, 5-, 8-, & 10-Year Relative Survival Rates (%) by
SEER Area, Ages 20+, 12 SEER Areas, 1988-2001
SEER Geographic Area Cases Percent
Relative Survival Rate (%)
1-Year 2-Year 3-Year 5-Year 8-Year 10-Year
Total 201,067 100.0 42.6 25.9 20.0 15.5 12.4 11.0
Atlanta and Rural Georgia 13,754 6.8 42.6 26.4 20.5 15.9 13.1 11.4
Atlanta (Metropolitan) - 1988+ 12,956 6.4 42.9 26.7 20.8 16.1 13.3 11.6
Rural Georgia - 1988+ 798 0.4 38.0 21.5 16.2 13.0 10.2 8.8
California
Los Angeles - 1992+ 30,677 15.3 41.3 25.1 19.4 14.8 11.8 10.1
Greater Bay Area 33,987 16.9 42.1 25.6 19.5 15.2 12.2 10.8
San Francisco-Oakland SMSA - 1988+ 23,746 11.8 41.8 25.0 19.0 14.7 11.6 10.3
San Jose-Monterey - 1988+ 10,241 5.1 42.7 26.9 20.8 16.5 13.7 11.9
Connecticut - 1988+ 26,207 13.0 45.0 28.1 21.9 17.2 14.0 12.3
Detroit (Metropolitan) - 1988+ 33,074 16.4 43.1 26.3 20.6 15.8 12.7 11.3
Hawaii - 1988+ 6,480 3.2 44.3 26.8 20.6 16.1 13.1 12.3
Iowa - 1988+ 21,548 10.7 41.9 24.5 18.6 14.0 10.7 9.3
New Mexico - 1988+ 7,159 3.6 38.4 22.3 17.3 13.0 10.4 9.3
Seattle (Puget Sound) - 1988+ 23,799 11.8 43.7 26.6 20.9 16.3 12.6 11.6
Utah - 1988+ 4,382 2.2 38.4 22.6 17.7 13.9 11.9 11.1
Table 9.4: Cancer of the Lung: Number of Cases, Stage Distribution, and 5-Year Relative Survival Rates (%) by AJCC
Stage (3rd edition) and Sex, Ages 20+, 12 SEER Areas, 1988-2001
AJCC Stage (3rd edition)
Male and Female Male Female
Cases Percent
5-Year
Relative
Survival
Percent Cases Percent
5-Year
Relative
Survival
Percent Cases Percent
5-Year
Relative
Survival
Percent
All Stages 201,067 100.0 15.5 117,472 100.0 13.6 83,595 100.0 18.0
I 26,879 13.4 56.9 14,598 12.4 53.5 12,281 14.7 60.8
II 5,635 2.8 33.7 3,402 2.9 32.4 2,233 2.7 35.7
III 50,254 25.0 9.4 29,863 25.4 9.0 20,391 24.4 10.1
IV 75,057 37.3 1.8 44,783 38.1 1.6 30,274 36.2 2.2
Unknown 43,242 21.5 18.0 24,826 21.1 15.0 18,416 22.0 21.9
Chapter 9 Cancer of the Lung
National Cancer Institute 76 SEER Survival Monograph
Table 9.5: Cancer of the Lung: Number of Cases and 5-Year Relative Survival Rates (RSR) (%) by Sex, Histology and AJCC Stage
(3rd edition), Ages 20+, 12 SEER Areas, 1988-2001
Sex/Histology
AJCC Stage (3rd edition)
Total I II III IV Unknown
Cases
5-Year
RSR % Cases
5-Year
RSR % Cases
5-Year
RSR % Cases
5-Year
RSR % Cases
5-Year
RSR % Cases
5-Year
RSR %
Male and Female 201,067 15.5 26,879 56.9 5,635 33.7 50,254 9.4 75,057 1.8 43,242 18.0
Squamous cell 41,212 16.8 7,196 51.3 1,698 35.1 12,061 9.9 10,263 1.9 9,994 12.7
Adenocarcinoma 73,535 20.3 14,432 63.8 2,802 34.4 17,587 10.2 27,593 2.2 11,121 20.2
Small Cell 33,008 6.0 953 31.4 270 19.3 8,213 8.4 16,962 1.5 6,610 10.7
Large Cell 14,945 12.1 1,705 50.2 365 33.7 3,931 9.5 6,014 1.7 2,930 12.2
Others 38,367 14.5 2,593 46.6 500 33.1 8,462 8.1 14,225 1.6 12,587 26.0
Male 117,472 13.6 14,598 53.5 3,402 32.4 29,863 9.0 44,783 1.6 24,826 15.0
Squamous cell 28,463 16.3 4,734 50.5 1,281 35.3 8,516 10.0 7,116 1.6 6,816 12.4
Adenocarcinoma 39,303 17.1 6,865 59.2 1,406 30.8 9,562 9.1 15,584 1.9 5,886 18.0
Small Cell 17,827 5.1 488 29.4 134 18.9 4,166 7.9 9,579 1.2 3,460 8.6
Large Cell 9,033 11.4 965 49.4 239 32.9 2,361 9.6 3,753 1.6 1,715 11.3
Others 22,846 11.7 1,546 46.6 342 32.0 5,258 7.6 8,751 1.4 6,949 19.3
Female 83,595 18.0 12,281 60.8 2,233 35.7 20,391 10.1 30,274 2.2 18,416 21.9
Squamous cell 12,749 18.0 2,462 52.8 417 34.7 3,545 9.8 3,147 2.6 3,178 13.3
Adenocarcinoma 34,232 23.7 7,567 67.7 1,396 37.8 8,025 11.4 12,009 2.5 5,235 22.5
Small Cell 15,181 7.1 465 33.4 136 19.7 4,047 9.0 7,383 1.8 3,150 12.9
Large Cell 5,912 13.1 740 51.1 126 34.6 1,570 9.4 2,261 1.9 1,215 13.4
Others 15,521 18.4 1,047 46.7 158 35.1 3,204 8.9 5,474 1.9 5,638 33.6
0
10
20
30
40
50
60
70
All Hist. Squamous Adeno Small Large Other
Relative Survival Rate (%)
Histology
All Stages I II III IV Unstaged
0
10
20
30
40
50
60
70
All Hist. Squamous Adeno Small Large Other
Relative Survival Rate (%)
Histology
All Stages I II III IV Unstaged
Figure 9.1: Male Lung Cancer: 5-Year Relative Survival
Rates (%) by Histology and AJCC Stage, Ages 20+, 12 SEER
Areas, 1988-2001
Figure 9.2: Female Lung Cancer: 5-Year Relative Survival
Rates (%) by Histology and AJCC Stage, Ages 20+, 12 SEER
Areas, 1988-2001
of the cancer was not specified 16.8%, 24.7%, and 17.9%,
respectively. Overall, the 5-year relative survival rates were
lower for patients whose tumor originated in the main stem
bronchus (a category that includes the carina and hilum)
than for those whose tumor originated in the upper, middle,
or lower lobe (Table 9.8). If the lobe was not specified,
the 5-year relative survival rate was 5%. For tumors that
crossed lobe boundaries, survival rates were intermediate.
For patients diagnosed at stage I, those whose tumor had
originated in the upper lobe had a survival rate (60%) more
than double that of those whose tumors originated in the
main bronchus, carina, or hilum (23%) (Table 9.9).
Extent of Disease
Only cases with no lymph nodes involved (approximately
one-fourth of the cases) were used to investigate the influ-
ence of extent of disease on survival (Table 9.10). Five-year
Chapter 9 Cancer of the Lung
National Cancer Institute 77 SEER Survival Monograph
Table 9.6: Cancer of the Lung: Number of Cases and 5-Year Relative Survival Rates (%) by Sex, Age (20+), and AJCC Stage (3rd
edition) at Diagnosis, 12 SEER Areas, 1988-2001
Sex/Age
(Years)
AJCC Stage (3rd edition)
Total I II III IV Unknown
Cases
5-Year
Relative
Survival
Percent Cases
5-Year
Relative
Survival
Percent Cases
5-Year
Relative
Survival
Percent Cases
5-Year
Relative
Survival
Percent Cases
5-Year
Relative
Survival
Percent Cases
5-Year
Relative
Survival
Percent
Male and
Female
201,067 15.5 26,879 56.9 5,635 33.7 50,254 9.4 75,057 1.8 43,242 18.0
20-44 6,148 21.6 497 69.7 132 52.5 1,450 14.8 2,734 2.4 1,335 46.7
45-49 7,995 17.5 759 64.9 234 42.5 1,934 13.6 3,681 2.3 1,387 32.4
50-54 13,789 17.6 1,549 66.5 470 42.3 3,361 13.2 6,029 2.5 2,380 24.9
55-59 20,684 17.0 2,620 62.1 626 36.8 5,048 12.2 8,733 2.2 3,657 22.4
60-64 29,038 16.4 3,829 61.2 910 36.8 7,090 11.2 11,677 1.7 5,532 19.1
65-69 36,469 16.2 5,443 57.6 1,102 32.3 8,872 9.7 13,518 1.8 7,534 16.9
70-74 36,666 14.8 5,512 53.9 1,130 27.2 9,166 7.6 12,745 1.7 8,113 14.7
75-79 28,228 12.3 4,074 48.9 713 26.0 7,101 5.6 9,391 1.0 6,949 11.5
80-84 15,235 10.2 1,963 42.6 251 24.6 4,114 3.7 4,637 1.5 4,270 10.2
85+ 6,815 6.6 633 33.9 67 16.9 2,118 2.1 1,912 0.7 2,085 7.6
Male 117,472 13.6 14,598 53.5 3,402 32.4 29,863 9.0 44,783 1.6 24,826 15.0
20-44 3,378 18.4 240 67.1 73 47.6 836 14.7 1,565 2.4 664 39.5
45-49 4,603 14.8 359 66.1 133 41.1 1,167 11.8 2,185 1.5 759 27.8
50-54 8,124 14.9 787 61.0 284 43.9 2,053 12.7 3,648 1.9 1,352 19.2
55-59 12,245 14.7 1,397 58.5 373 36.3 3,137 11.5 5,250 2.1 2,088 17.3
60-64 17,738 14.6 2,169 58.1 545 34.4 4,405 10.2 7,275 1.3 3,344 16.8
65-69 21,847 14.4 3,061 54.3 699 32.0 5,336 9.1 8,260 1.5 4,491 14.3
70-74 21,536 13.0 3,028 50.5 679 25.1 5,467 7.2 7,670 1.6 4,692 12.2
75-79 16,043 10.9 2,209 45.4 441 21.2 4,130 5.2 5,343 0.8 3,920 10.1
80-84 8,384 8.1 1,007 35.4 138 25.3 2,243 3.4 2,594 1.4 2,402 7.5
85+ 3,574 4.9 341 26.4 37 14.4 1,089 1.0 993 0.4 1,114 5.4
Female 83,595 18.0 12,281 60.8 2,233 35.7 20,391 10.1 30,274 2.2 18,416 21.9
20-44 2,770 25.5 257 71.9 59 58.5 614 14.9 1,169 2.5 671 53.6
45-49 3,392 21.1 400 63.8 101 44.5 767 16.3 1,496 3.4 628 37.8
50-54 5,665 21.4 762 72.2 186 39.5 1,308 13.9 2,381 3.2 1,028 32.1
55-59 8,439 20.3 1,223 66.1 253 37.7 1,911 13.4 3,483 2.4 1,569 29.1
60-64 11,300 19.3 1,660 65.2 365 40.1 2,685 12.6 4,402 2.3 2,188 22.3
65-69 14,622 18.6 2,382 61.7 403 32.6 3,536 10.6 5,258 2.1 3,043 20.6
70-74 15,130 17.1 2,484 57.9 451 30.0 3,699 8.1 5,075 1.8 3,421 17.8
75-79 12,185 13.9 1,865 52.5 272 32.7 2,971 5.9 4,048 1.3 3,029 13.1
80-84 6,851 12.4 956 48.9 113 23.5 1,871 4.1 2,043 1.3 1,868 13.1
85+ 3,241 8.1 292 40.6 30 17.2 1,029 2.8 919 1.1 971 9.6
relative survival ranged from a high of 60% for cases in
which the cancer was confined to one lung down to 4% for
those with metastases. For nearly every category, women
fared better than men. For those patients whose tumor was
confined to one lung, women had a 64% 5-year relative
survival rate compared to 56% for men.
Grade
Nearly 40% of the cases did not have histologic grade. But
for stage I, only 18% were not graded. For all stages com-
bined, survival was four times higher for grade 1 compared
to grade 4. Within stages, the survival differences by grade
were not as pronounced (Table 9.11). For stage I, grade 1
cases had better survival (73%) than grade 4 cases (48%).
Stage I adenocarcinomas had a similar range (Table 9.12).
For adenocarcinomas, grade III and IV had similar survival
and for stage IV, the survival was less than 4% no matter
which grade (Table 9.12).
DISCUSSION
While lung cancer survival rates overall are generally poor,
lung cancer survival rates vary by patient and tumor charac-
Chapter 9 Cancer of the Lung
National Cancer Institute 78 SEER Survival Monograph
Table 9.7: Cancer of the Lung: Number of Cases and 5-Year Relative Survival Rates (%) by AJCC Stage (3rd edition) and
Laterality, Ages 20+, 12 SEER Areas, 1988-2001
AJCC Stage
Laterality
Total Right Left Other
Cases
5-Year
Relative
Survival
Percent Cases
5-Year
Relative
Survival
Percent Cases
5-Year
Relative
Survival
Percent Cases
5-Year
Relative
Survival
Percent
All Stages 201,067 15.5 109,776 16.2 79,276 16.2 12,015 4.0
I 26,879 56.9 15,554 57.5 11,311 56.1 14 ~
II 5,635 33.7 2,994 32.2 2,637 35.5 <5 ~
III 50,254 9.4 28,596 9.5 20,287 9.6 1,371 5.2
IV 75,057 1.8 38,949 1.7 28,041 1.9 8,067 2.0
Unstaged/Unknown 43,242 18.0 23,683 18.9 17,000 18.1 2,559 9.4
~ Statistic not displayed due to less than 25 cases.
Table 9.8: Cancer of the Lung: Number of Cases and 5-Year Relative Survival Rates (%) by Subsite and Sex, Ages 20+,
12 SEER Areas, 1988-2001
Subsite
Male and Female Male Female
Cases
5-Year Relative
Survival
Percent Cases
5-Year Relative
Survival
Percent Cases
5-Year Relative
Survival
Percent
All Subsites 201,067 15.5 117,472 13.6 83,595 18.0
Main bronchus 11,384 7.0 6,620 6.4 4,764 7.8
Upper lobe 97,916 19.0 57,830 16.9 40,086 21.8
Middle lobe 8,496 19.7 4,632 16.5 3,864 23.2
Lower lobe 44,106 17.8 25,390 15.2 18,716 21.0
Overlapping 3,940 14.7 2,346 14.2 1,594 15.3
NOS 35,225 4.7 20,654 3.7 14,571 5.9
Table 9.9: Cancer of the Lung: Number of Cases and 5-Year Relative Survival Rates (%) by Subsite and AJCC Stage (3rd edition),
Ages 20+, 12 SEER Areas, 1988-2001
Subsite
AJCC Stage (3rd edition)
Total I II III IV Unknown
Cases
5-Year
Relative
Survival
Percent Cases
5-Year
Relative
Survival
Percent Cases
5-Year
Relative
Survival
Percent Cases
5-Year
Relative
Survival
Percent Cases
5-Year
Relative
Survival
Percent Cases
5-Year
Relative
Survival
Percent
All Subsites 201,067 15.5 26,879 56.9 5,635 33.7 50,254 9.4 75,057 1.8 43,242 18.0
Main bronchus 11,384 7.0 303 23.1 149 27.4 4,130 8.0 4,597 1.1 2,205 13.9
Upper lobe 97,916 19.0 16,567 59.9 3,036 38.3 24,834 11.6 32,845 2.2 20,634 18.7
Middle lobe 8,496 19.7 1,351 55.4 248 30.1 1,877 8.7 2,898 1.5 2,122 29.7
Lower lobe 44,106 17.8 7,763 53.5 1,921 28.1 9,756 8.5 14,813 1.7 9,853 20.9
Overlapping 3,940 14.7 478 50.0 183 33.5 1,219 9.8 1,353 1.3 707 19.9
NOS 35,225 4.7 417 34.9 98 20.7 8,438 4.7 18,551 1.5 7,721 10.4
Chapter 9 Cancer of the Lung
National Cancer Institute 79 SEER Survival Monograph
Table 9.10: Cancer of the Lung without lymph node involvement: Number and Distribution of Cases and 5-Year Relative Survival
Rates (%) by Extension and Sex, Ages 20+, 12 SEER Areas, 1988-2001
Extension
Male and Female Male Female
Cases Percent
5-Year
RSR
Cases Percent
5-Year
RSR
Cases Percent
5-Year
RSR
All Cases without Lymph Node Involvement 49,758 100.0 41.5 27,861 100.0 37.3 21,897 100.0 46.5
10-One lung 22,200 44.6 59.7 11,683 41.9 55.7 10,517 48.0 64.0
20-Involving MSB, away from carina 1,206 2.4 56.0 715 2.6 49.1 491 2.2 65.3
30-Localized, NOS 3,261 6.6 38.7 1,860 6.7 36.0 1,401 6.4 42.1
40-Atelectasis/obs. pneumonitis < entire lung,
w/o pleural effusion
6,459 13.0 51.6 3,629 13.0 47.3 2,830 12.9 56.7
50-Involving MSB, close to carina 344 0.7 24.8 223 0.8 25.2 121 0.6 23.8
60-Atelectasis/obstructive pneumonitis of
entire lung
1,765 3.5 27.1 1,143 4.1 25.2 622 2.8 30.4
65-Multiple masses - same lobe 293 0.6 + 137 0.5 + 156 0.7 +
70-Carina/trachea 1,837 3.7 17.5 1,207 4.3 17.2 630 2.9 17.9
71-Heart 135 0.3 13.6 94 0.3 11.9 41 0.2 16.8
72-Malignant pleural effusion 2,569 5.2 9.4 1,500 5.4 8.4 1,069 4.9 10.7
73-Adjacent rib 632 1.3 16.2 405 1.5 16.1 227 1.0 16.3
75-Sternum/vertebrae 304 0.6 14.7 193 0.7 14.3 111 0.5 15.2
77-Separate lobes (same lung) 255 0.5 ! 120 0.4 ! 135 0.6 !
78-Contralateral 494 1.0 11.2 258 0.9 7.8 236 1.1 14.4
80-Further extension 68 0.1 10.9 43 0.2 3.0 25 0.1 23.9
85-Metastasis 6,994 14.1 4.3 4,097 14.7 3.7 2,897 13.2 4.9
99-Unknown 885 1.8 16.2 519 1.9 14.7 366 1.7 18.1
Bases on 49,758 cases with no lymph node involvement. Extensions with fewer than 50 cases excluded.
+ The statistic could not be calculated.
! Not enough intervals to produce rate.
0
10
20
30
40
50
60
70
80
90
100
0 12 24 36 48 60 72 84 96 108 120
Relative Survival Rate (%)
Months after diagnosis
I II III IV
Figure 9.3: Non-small-cell Lung Cancer: Relative Survival
Rates (%) by AJCC Stage, Ages 20+, 12 SEER Areas, 1988-2001
0
10
20
30
40
50
60
70
80
90
100
0 12 24 36 48 60 72 84 96 108 120
Relative Survival Rate (%)
Months after diagnosis
I II III IV
Figure 9.4: Small-cell Lung Cancer: Relative Survival Rates (%)
by AJCC Stage, Ages 20+, 12 SEER Areas, 1988-2001
Chapter 9 Cancer of the Lung
National Cancer Institute 80 SEER Survival Monograph
Table 9.11: Cancer of the Lung: Number of Cases and 5-Year Relative Survival Rates (%) by Grade and AJCC Stage (3rd edition),
Ages 20+, 12 SEER Areas, 1988-2001
Grade
AJCC Stage (3rd edition)
Total I II III IV Unknown
Cases
5-Year
RSR
Percent Cases
5-Year
RSR
Percent Cases
5-Year
RSR
Percent Cases
5-Year
RSR
Percent Cases
5-Year
RSR
Percent Cases
5-Year
RSR
Percent
All Grades 201,067 15.5 26,879 56.9 5,635 33.7 50,254 9.4 75,057 1.8 43,242 18.0
1 6,831 41.4 2,645 73.3 237 39.3 1,143 15.9 1,187 3.6 1,619 33.9
2 25,993 29.8 8,000 63.0 1,685 37.7 6,086 12.8 5,319 2.8 4,903 22.2
3 61,072 15.8 9,364 54.3 2,467 33.7 16,349 11.4 22,116 1.9 10,776 14.1
4 27,991 9.4 1,940 47.8 533 30.6 7,270 9.5 12,632 1.6 5,616 11.9
Unknown 79,180 10.4 4,930 46.4 713 24.7 19,406 6.1 33,803 1.6 20,328 19.7
Table 9.12: Adenocarcinoma of the Lung: Number of Cases and 5-Year Relative Survival Rates (%) by Grade and AJCC Stage
(3rd edition), Ages 20+, 12 SEER Areas, 1988-2001
Grade
AJCC Stage (3rd edition)
Total I II III IV Unknown
Cases
5-Year
RSR
Percent Cases
5-Year
RSR
Percent Cases
5-Year
RSR
Percent Cases
5-Year
RSR
Percent Cases
5-Year
RSR
Percent Cases
5-Year
RSR
Percent
Total 73,535 20.3 14,432 63.8 2,802 34.4 17,587 10.2 27,593 2.2 11,121 20.2
1 4,915 46.5 2,248 76.2 174 36.8 625 19.9 906 3.9 962 34.7
2 13,284 35.7 4,915 67.5 992 37.0 2,446 15.9 3,080 3.1 1,851 29.1
3 26,197 17.6 4,567 56.3 1,226 33.4 6,762 12.3 10,053 2.0 3,589 16.9
4 1,470 16.2 218 50.5 84 35.8 413 11.1 545 3.4 210 16.0
Unknown 27,669 10.8 2,484 60.3 326 28.4 7,341 5.1 13,009 1.8 4,509 16.3
teristics. For lung cancer, stage had the most prognosis,
but other factors such as grade, age, sex, and histologic
type also played a role. Many of these results expand on
similar analyses performed on earlier SEER data (2).
While females have somewhat better survival than males,
it does not appear to be due to more cases with a favor-
able extent of disease; the differential also exists within
most of the detailed EOD categories.
Lung cancer is a major disease in the US for both males
and females; survival of lung cancer is worse than survival
of most other types of cancer. While overall survival was
poor, the 5-year relative survival rate for stage I patients
was 57%.
Females had better survival than males for most lung
cancer histologic types, even though females had a higher
proportion of small cell carcinoma (18% in women and
15% in men in our data set), which has a much worse
prognosis than the other tumor types (Table 9.5).
Although the prognosis for lung cancer is dismal for most
patients, there are some groups that are exceptional. For
instance, females under age 45 with stage I lung cancer
had a 5-year relative survival rate of 72%.
Since relative survival rates are higher for younger per-
sons than for older, some of the female-male survival
differential may be due to a greater proportion of younger
patients in the female group. However, even within age
groups, females tended to survive better than males.
TNM stage was a good predictor of survival even when
analyzed by various demographic and tumor factors. There
were, however, wide ranges of survival possible within
a particular stage, especially for stage I. For instance,
as mentioned above, young females with stage I lung
cancer had a 5-year relative survival rate of 72%; for
females aged 85 and over, the corresponding rate was
only 41%.
REFERENCES
1. Beahrs, OH, Henson DE, Hutter RVP, Myers MH (eds).
AJCC Cancer Staging Manual, Third edition. American Joint
Committee on Cancer. Philadelphia: Lippincott, 1988.
2. Ries LAG. Influence of extent of disease, histology, and
demographic factors on lung cancer survival in the SEER
population-based data. Semin Surg Oncol 1994;10:21-30.