Recent Developments in Banks’ Funding Costs and Lending Rates pdf
Bạn đang xem bản rút gọn của tài liệu. Xem và tải ngay bản đầy đủ của tài liệu tại đây (240.77 KB, 10 trang )
35BULLETIN | MARCH QUARTER 2010
Introduction
Australian banks raise funding from deposits and
in capital markets so their funding costs, and
consequently lending rates, are aected by nancial
market conditions. For several years up until mid
2007, with market conditions and spreads stable,
banks’ overall cost of funds tended to follow the
cash rate, and therefore banks tended to adjust their
lending rates mainly in response to changes in the
cash rate. Since then, the global nancial crisis has
pushed up banks’ funding costs relative to the cash
rate and this has been reected in their lending
rates. This article updates previous Reserve Bank
research on banks’ funding costs.
1
The article notes
that banks’ overall funding costs remain signicantly
higher relative to the cash rate than they were in
mid 2007, mainly due to the large increases in the
cost of deposits and long-term wholesale debt, and
a shift in banks’ funding mix towards these more
expensive, but typically more stable, types of
funding.
Banks’ lending rates have also risen relative to the
cash rate. The increases have been largest for
* The authors are from Domestic Markets Department.
1 Most data in this latest article are until end February 2010. The
previous article is Davies, Naughtin and Wong (2009).
Recent Developments in Banks’
Funding Costs and Lending Rates
Anna Brown, Michael Davies, Daniel Fabbro and Tegan Hanrick*
The global nancial crisis has affected the cost and composition of Australian banks’ funding,
with ow-on effects to their lending rates and net interest margins. Since mid 2007, Australian
banks’ overall funding costs have risen signicantly relative to the cash rate, mainly reecting
the higher cost of deposits and long-term wholesale debt, and changes in their funding mix.
Australian banks’ lending rates have also risen signicantly relative to the cash rate. For the
major banks, the increases in lending rates have more than fully offset their higher funding costs,
with their net interest margins in late 2009 about 20–25 basis points above pre-crisis levels. Since
then, margins may have narrowed slightly.
business and personal loans, in part reecting a
reappraisal of risk on this lending during the recent
slowdown in the Australian economy, and smallest
for variable-rate mortgages. The bulk of the increases
occurred during 2008 and early 2009.
Most of the increase in banks’ lending rates over
the cash rate since mid 2007 has been due to their
higher funding costs. For the major banks, however,
there has also been an increase in their net interest
margins (NIMs), which in late 2009 were about
20–25 basis points above pre-crisis levels. The major
banks’ higher NIMs have supported their return on
equity, partly osetting the negative eects of the
cyclical increase in their bad debts expense and
the additional equity that they raised during the
downturn. The regional banks’ NIMs have declined
steadily for much of the crisis period, mainly
reecting the larger increase in their funding costs,
though recently they have risen a little.
Composition of Banks’ Funding
Banks operating in Australia have diverse funding
bases, with most funding sourced from deposits,
short-term and long-term wholesale debt. The
funding mix diers somewhat across banks,
36 RESERVE BANK OF AUSTRALIA
RECENT DEVELOPMENTS IN BANKS’ FUNDING COSTS AND LENDING RATES
36
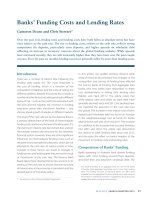
the nancial crisis has had a signicant impact on
the relative cost of banks’ various funding sources.
Globally, it has also led to a renewed focus on the
composition of banks’ funding. As a result, banks
in Australia have increased their use of deposits
and long-term debt, as these funding sources are
perceived to be relatively stable, and reduced their
use of short-term debt and securitisation.
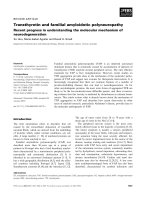
The share of funding that comes from deposits for all
banks in Australia has risen by 3 percentage points
since mid 2007 to 42 per cent, with most of this
increase occurring during the height of the nancial
however, with the major banks having a slightly
larger share of deposit funding than the banking
system as a whole and relying very little on
securitisation (Table 1). Regional banks generally
have more deposits and make greater use of
securitisation and less use of oshore funding,
while foreign-owned banks have less deposits and
correspondingly more funding from domestic capital
markets and oshore.
The funding mix of banks in Australia was fairly
stable during the few years leading up to the onset
of the global nancial crisis in mid 2007. However,
RESERVE BANK OF AUSTRALIA
Table 1: Funding Composition of Banks in Australia
(a)
Per cent of funding liabilities
June 2007 January 2010
Major Banks
Domestic deposits 43 48
Short-term wholesale debt
(b)
24 18
Long-term wholesale debt 21 25
Equity 7 8
Securitisation 5 1
Regional banks
Domestic deposits 39 47
Short-term wholesale debt
(b)
23 14
Long-term wholesale debt 10 17
Equity 11 13
Securitisation 17 9
Foreign-owned banks
Domestic deposits 27 24
Short-term wholesale debt
(b)
58 58
Long-term wholesale debt 11 16
Equity 2 2
Securitisation 2 0
(a) The classication of individual banks into major, regional and foreign-owned banks is the same in both periods, and is based
on their classication in January 2010. Hence the changes in funding composition are unaected by the recent merger and
acquisition activity in the Australian banking sector.
(b) Includes deposits and intragroup funding from non-residents.
Sources: APRA; RBA
37BULLETIN | MARCH QUARTER 2010
RECENT DEVELOPMENTS IN BANKS’ FUNDING COSTS AND LENDING RATES
combination of retained earnings and sizeable share
placements in late 2008 and during 2009. For the
banking system, the share of equity in total funding
liabilities has increased by 1 percentage point since
mid 2007 to about 7 per cent.
Cost of Funding
The cash rate still has a large inuence on banks’
funding costs. However, the global nancial crisis
and its ongoing eects have caused the costs of all of
the banks’ main sources of funding to rise relative to
the cash rate and relevant money market rates. The
increases have been particularly large for deposits
and long-term wholesale debt. The shift in banks’
funding mix towards these typically more stable, but
also more expensive, sources has also contributed to
the rise in their overall funding costs.
Deposits
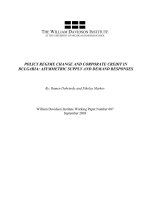
Competition for deposits in Australia has intensied
over the past two years, resulting in a signicant
increase in deposit rates relative to market benchmark
rates. Overall, it is estimated that the average cost of
the major banks’ new deposits is currently slightly
higher than the cash rate, compared with about
150 basis points below the cash rate prior to the
Graph 1
%
Funding Composition of Banks in Australia*
Per cent of funding, monthly
0
10
20
30
40
0
10
20
30
40
2010
Short-term debt**
Equity
Securitisation
20072006 2008
*Adjusted for movements in foreign exchange rates
** Includes deposits and intragroup funding from non-residents
Sources: APRA; RBA
Long-term debt
Domestic deposits
2009
%
crisis in 2008 and early 2009 (Graph 1). Term deposits
have accounted for most of the growth in banks’
deposit funding. The regional banks have had the
largest rise in deposit funding, while the major banks
have also increased their use of deposit funding. In
contrast, the foreign-owned banks have experienced
a fall in the proportion of funding coming from
domestic deposits. Looking forward, it is not clear
that there is much additional scope for the banking
system as a whole to materially increase its use of
deposit funding. Over the past year, the share of
deposits in the total funding of banks in Australia
has been little changed, even though banks have
been oering very high interest rates to try to attract
additional deposits.
The share of funding sourced from long-term
wholesale debt (domestic and foreign) for the overall
banking system has increased by 6 percentage
points since mid 2007 to about 24 per cent, with all
of the main groups of banks increasing their use of
this funding source. During late 2008 and the rst
half of 2009 the banks mainly issued government-
guaranteed bonds, but as market conditions
have improved they have increasingly issued
unguaranteed bonds.
2
Short-term wholesale debt (domestic and foreign)
currently accounts for about 24 per cent of banks’
funding; this is down from a little over 30 per cent
in mid 2007.
The share of banks’ funding that is from securitisation
has halved to 3 per cent over the course of the
nancial crisis, as outstanding residential mortgage-
backed securities (RMBS) have continued to amortise
and there has been very little new issuance. This
downward trend may start to change during 2010,
as there have recently been signs of improvement in
the cost and availability of securitisation funding.
The major and regional banks have also bolstered
their balance sheets by raising equity, through a
2 For more details on banks’ bond issuance see Black, Brassil and
Hack (2010), and for details on the Government wholesale funding
guarantee see Schwartz (2010).
38 RESERVE BANK OF AUSTRALIA
RECENT DEVELOPMENTS IN BANKS’ FUNDING COSTS AND LENDING RATES
onset of the nancial crisis (Graph 2). The regional
banks have likely seen a slightly larger increase in
their deposit costs, reecting their greater use of
term deposits.
Within the deposit market, competition has been
strongest for term deposits, which account for
about 40 per cent of the major banks’ deposits
and about 55 per cent of the regional banks’
deposits. The average rate on banks’ term deposit
specials – the most relevant rate for term deposit
pricing – is currently about 140 basis points above
money market rates over equivalent terms, whereas
in the few years prior to the global nancial crisis it
was generally about 60 basis points below it. The
banks have been oering signicantly higher rates
across all of their term deposit specials, from 1 month
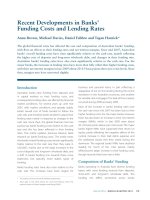
to 5 years. For the major banks, their rates on 3- and
5-year term deposits are currently 30–100 basis
points higher than the yields on their unguaranteed
bonds of equivalent maturity (Graph 3). For the
regional banks, the interest rates on their longer-
term deposits are estimated to be still a little
below the yields on their unguaranteed bonds, as
the spreads on their bonds are higher. The banks’
aggressive pricing of term deposits partly reects
a view that they are a reasonably stable source of
funding and that the xed rates on individual term
deposits allow banks to oer high interest rates to
attract new deposits without immediately repricing
their existing deposit base.
3
Rates on at-call savings deposits – including bonus
saver, cash management and online savings
accounts – have also risen relative to the cash rate
(from which these deposits are priced). The average
rate on the major banks’ at-call deposits, which
account for a little under half of their total deposits,
is currently around 60 basis points below the cash
rate, compared with around 100 basis points below
in mid 2007. The major banks have also started
3 The contractual maturity of term deposits (which is generally
between 3 and 12 months, but can be as long as 5 years) is longer
than the contractual maturity of at-call deposits (eectively 1 day).
However, there is likely to be much less dierence in the behavioural
maturities of term and at-call deposits, as banks normally allow
depositors to redeem their term deposits early by paying a break fee
and/or forfeiting some accrued interest, and it is easier for depositors
to switch their term deposits between banks as they are discrete
investments whereas at-call accounts are more ongoing in nature.
Graph 2
2
4
6
8
2
4
6
8
0
2
4
6
8
0
2
4
6
8
Major Banks’ Deposit Rates
Cash rate
Average rate on new deposits
(excluding CDs)
Cash rate
At-call deposits
Term deposit specials*
%
20042006 20082010200920072005
* Average of 1–12, 24-, 36- and 60-month terms at the major banks
Source: RBA
%
%%
Graph 3
Major Banks’ Pricing of Term Deposits
and Bonds
A$ debt
-100
0
100
200
-100
0
100
200
*Includes fee for guaranteed issues
** Prior to September 2008 it is the 24-month spread
Sources:Bloomberg; RBA; Thomson Reuters; UBS AG, Australia Branch
Unguaranteed debt
(rated AA)
Bps
3-year spreads to CGS
Bps
5-year spreads to CGS
2008 2008
Term deposit
specials**
Guaranteed debt*
(rated AAA)
20102010
39BULLETIN | MARCH QUARTER 2010
RECENT DEVELOPMENTS IN BANKS’ FUNDING COSTS AND LENDING RATES
oering higher introductory rates on some of their
at-call accounts to attract new customers. These
introductory rates are often well above the cash rate,
although they typically only last for a few months.
Wholesale debt
The higher cost of long-term wholesale debt
funding has also made a signicant contribution
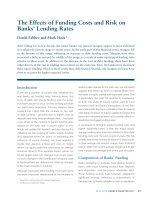
to the overall rise in banks’ cost of funds. For several
years up to mid 2007, the major banks were typically
able to issue 3-year bonds in Australia and oshore
at an overall spread (including the hedging costs on
foreign currency debt) of 10–20 basis points over
bank bill or swap rates (Graph 4).
4
However,
primary market spreads on banks’ bonds have
risen signicantly, as greater risk aversion has seen
investors demand larger risk premia to
provide term funding to banks. The cost
of hedging foreign currency debt back
into Australian dollars has also been high and
volatile. The overall cost to the major banks of
issuing new 3-year bonds peaked in early 2009 at
about 170 basis points over bank bill or swap rates
for debt issued in Australia and about 200 basis
points for debt issued oshore. The improvement
in capital market conditions over the past year has
seen the cost of issuing new debt decrease to
about 80–120 basis points.
The average cost of the major banks’ outstanding
long-term debt is estimated to have risen by less
– about 100 basis points relative to money market
rates – as the higher spreads described above
only aect banks’ new bond issuance, not their
outstanding stock of debt that was issued prior to
the onset of the nancial crisis. If bond spreads and
hedging costs remain around their current levels,
then as maturing bonds are rolled over, the average
4 The swap rate is the base interest rate for most xed-rate debt in
Australia. It is the xed rate that one party is willing to pay in exchange
for receiving the average bank bill rate over the term of the swap. See
Appendix A of Davies et al (2009) for a detailed description of the costs
of hedging foreign currency debt liabilities back into Australian dollars
using cross-currency interest rate swaps.
spread on banks’ outstanding long-term debt is
estimated to increase by about 30 basis points
over the next year and a half and broadly stabilise
thereafter.
The regional banks, which are smaller and have
lower credit ratings than the major banks, have
experienced an even larger increase in the cost of
long-term wholesale debt, but it is a smaller share
of their total funding. Prior to the onset of the
nancial crisis, regional banks were able to issue
3-year bonds at an estimated overall spread of about
30–50 basis points over bank bill or swap rates.
However, the overall cost to the regional banks of
issuing new unguaranteed 3-year bonds is currently
about 200–250 basis points, and was considerably
higher at the peak of the nancial crisis.
Short-term wholesale debt accounts for about one-
quarter of banks’ funding, and is priced mainly o
1- and 3-month bank bill rates. Prior to mid 2007, bank
bill rates closely tracked the market’s expectation
for the cash rate (the overnight indexed swap or
Graph 4
4
6
8
4
6
8
lllllll
2
4
6
8
2
4
6
8
Major Banks’ Long-term Capital Market Funding
Sources: APRA; Bloomberg; RBA; UBS AG, Australia Branch
New debt
%
Variable-rate bonds
%
%%
Fixed-rate bonds
Outstanding
debt
3-month bank bill
3-year swap rate
2004 2006 2008 2010
40 RESERVE BANK OF AUSTRALIA
RECENT DEVELOPMENTS IN BANKS’ FUNDING COSTS AND LENDING RATES
OIS rate) with the spread between 3-month bank
bills and 3-month OIS remaining stable at around
10 basis points (Graph 5). The onset of the global
nancial crisis saw bank bill rates rise well above OIS
rates, with the spread peaking at about 100 basis
points in October 2008. Due to the short maturity
of this debt, these higher spreads owed quickly
through to banks’ funding costs. Through 2009,
however, the sizeable risk premia that were evident
in bank bill rates for much of the previous two
years largely dissipated. Hence, major banks’ short-
term capital market debt is currently only about
15–20 basis points more costly relative to the
market’s expectation for the cash rate than it was
Graph 5
Rates
Money Market Interest Rates
Sources: AFMA; RBA; Tullett Prebon (Australia) Pty Ltd
%
4
6
8
4
6
8
llll
0
30
60
90
0
30
60
90
%
Bps Bps
Bank bill spread to OIS
3-month bank bill
3-month OIS
Cash rate
20082007 2009 20102006
in mid 2007, and is adding little upward pressure to
banks’ overall funding costs compared with other
sources. For the regional banks, the increase in the
cost of short-term debt has been slightly larger.
RMBS account for only a small share of the major
banks’ funding, but are reasonably important for
the smaller nancial institutions. The cost of new
securitisation funding (but not existing funding)
has risen signicantly since the onset of the global
nancial crisis and new issuance was scarce between
mid 2007 and mid 2009, as demand from private
investors fell away (Graph 6).
5
Much of the issuance
by Australian entities during late 2008 and early 2009
was purchased by the Australian Oce of Financial
Management (AOFM) under a Government plan
to support securitisation and so smaller housing
lenders. Since mid 2009, however, the securitisation
market has started to recover, with the volume of
issuance to private investors picking up and spreads
narrowing noticeably. Spreads on RMBS are similar
for the dierent types of banks (and also for non-
banks). This means that securitisation is relatively
more cost-eective for the smaller banks, given that
spreads on their on-balance sheet wholesale debt
(particularly long-term debt) are much higher than
for the major banks. Overall, securitisation is once
again a viable funding option for lenders, and going
forward, it is likely that they will increase their use of
this source.
The major and regional banks also issued a
signicant amount of new equity and hybrid
securities during late 2008 and 2009 to further
strengthen their balance sheets and support
lending growth. This additional capital was
expensive for the banks, as their share prices were
reasonably low through much of this period,
and spreads on hybrid securities have increased
markedly since mid 2007. While this has had
only a modest impact on overall funding costs
given their small shares in total funding, it has
contributed to the recent decrease in their return
on equity.
5 For a detailed discussion on developments in the Australian
securitisation market, see Debelle (2009).
Graph 6
Australian RMBS
BpsBps
AAA-rated secondary
market*
2006 2008 201020042002
●
Primary market**
● AOFM-sponsored primary market**
●
●
●
●
●
●
●
●
●
●
●
●
●
●
●
●
●
●
●
●
●
●
●
●
●
●
●
●
●
●
●
●
●
●
●
●●
●
●
●
●
●
●
●
●
●
●
●
●
●
●
●
●
●●
●
●
●
●
●
●
●
●
●
●
●
●
●
●●●
●
●
●
●
●
●
●
●
●
●
●
●
●
●
●
●
●
●
200
400
200
400
* 5-day rolling moving-average
** Primary RMBS spreads are face value weighted monthly averages of
AAA-rated RMBS with conservative average LVRs
Sources: RBA; Royal Bank of Scotland
0
10
20
0
10
20
0
10
20
0
10
20
Issuance
■
Offshore
■ Purchases by the AOFM
■ Onshore
Spreads to bank bill swap rate
$b$b
41BULLETIN | MARCH QUARTER 2010
RECENT DEVELOPMENTS IN BANKS’ FUNDING COSTS AND LENDING RATES
Overall funding costs
Taking into account the costs of individual funding
sources noted above, and weighting them by their
share of total bank funding, allows an estimate of the
overall change in banks’ funding costs. It is estimated
that the average cost of the major banks’ funding
is about 130–140 basis points higher relative to the
cash rate, than it was in mid 2007 (Graph 7). Most
of the increase in the major banks’ funding costs
occurred during 2008 and early 2009 when the
nancial crisis was at its worst. Since mid 2009, the
major banks’ overall funding costs are estimated
to have risen only a little more than the cash rate.
The higher cost of deposits has made the largest
contribution to the overall increase, reecting their
large weight in total funding and the 160–165 basis
point rise in deposit rates. Long-term wholesale
debt has also made a substantial contribution to the
increase in the major banks’ overall funding costs,
while the cost of short-term wholesale debt initially
rose but is now much closer to pre-crisis levels.
The available evidence suggests that the overall
increase in the regional banks’ funding costs since
the onset of the nancial crisis has been larger than
that experienced by the major banks. This mainly
reects the bigger rises in the cost of the regional
banks’ deposits and wholesale debt funding and
the shift in their funding mix from securitisation to
deposits, which is currently a relatively expensive
source of funding.
Banks’ Lending Rates and Margins
In setting interest rates on loans, banks take into
account changes in their overall cost of funds. For a
number of years prior to the global nancial crisis,
banks’ overall cost of funds followed the cash rate
reasonably closely as risk premia in markets were
low and stable, and therefore banks tended to
adjust their lending rates mainly in response to
the cash rate. The relationship between the cash
rate and the banks’ indicator rates on variable
housing and small business loans was particularly
close from 1998 to 2007, though the average actual
Graph 7
-0.5
0.0
0.5
1.0
1.5
-0.5
0.0
0.5
1.0
1.5
0.0
0.5
1.0
1.5
0.0
0.5
1.0
1.5
Major Banks’ Average Funding Costs*
Cumulative change in spreads to the cash rate since June 2007
*RBA estimates
** Spread to 3-year average CGS yield
Source: RBA
Deposits (excl CDs)
%
Total
%
%%
Long-term fixed-rate debt**
Long-term variable-rate debt
2008 2010 20082010
Short-term debt
(incl CDs)
Graph 8
150
300
450
150
300
450
0
200
400
600
0
200
400
600
Variable Lending Rates
Spread to cash rate
* Break reflects significant changes in banks’ lending products
** RBA estimates
Sources: APRA; Perpetual; RBA
2010
Small business indicator rate –
residentially secured, term loans
Business
Bps
Small and large business
– actual rate**
Small business indicator rate –
other security, overdraft*
20062002199819941990
Housing
Indicator rate
Actual rate
Bps
Bps
Bps
rates paid by housing and business borrowers
declined a little relative to the cash rate during
this period (Graph 8). Before then, however,
banks’ lending rates did not follow the cash rate
particularly closely.
42 RESERVE BANK OF AUSTRALIA
RECENT DEVELOPMENTS IN BANKS’ FUNDING COSTS AND LENDING RATES
As the global nancial crisis unfolded, banks’ lending
rates have risen relative to the cash rate, reecting
their higher funding costs. The banks have raised
their lending rates relative to the cash rate for all of
their loan products. The sizes of the increases have
varied considerably across the dierent loan types,
however, reecting factors such as changes in the
banks’ perceptions of the riskiness of the borrower,
the speed at which loans can be repriced, and the
sensitivity of the borrower to changes in lending
rates. While lending rates often do dier between
the banks, for equivalent products neither the major
banks nor other banks have materially higher or
lower lending rates.
The average rate on outstanding (xed and variable-
rate) housing loans has increased by around 145 basis
points relative to the cash rate since mid 2007. Rates
on variable housing loans have increased by around
110 basis points over this period (Graph 9). Spreads
on the major banks’ new 3- and 5-year xed-rate
housing loans have risen by 170–180 basis points
relative to equivalent maturity swap rates (and by
more relative to the cash rate because of the current
slope of the yield curve).
Personal and business loans have had larger
increases. For personal loans, interest rates have risen
by 340 basis points relative to the cash rate since mid
2007. This signicant increase partly reects the fact
that banks’ arrears and losses on personal loans have
risen more quickly than on their housing loans.
The major banks’ variable indicator rates on small
business lending have risen by around 200 basis
points relative to the cash rate since mid 2007, and
some individual borrowers may also have faced
additional increases in risk margins.
6
The higher
indicator rates have owed through immediately
to new and existing loans. For xed-rate loans to
small businesses, which account for about one-third
of outstanding lending, spreads over swap rates on
new loans have generally risen by 140–160 basis
points. Overall, interest rates on outstanding (xed
and variable-rate) loans to small businesses have
increased by about 200 basis points relative to the
cash rate since mid 2007.
There can be considerable variation in interest rates
across large businesses, as banks base their pricing
on the characteristics of the individual borrower.
Banks have increased their spreads (over bank bill
rates) on new loans (including renancings) over the
past two years, due to their higher funding costs and
a pick-up in arrears and losses on business lending
as the Australian economy slowed. The available
evidence suggests that the average spreads on new
term loans to large businesses increased by about
200 basis points from around 50–100 basis points in
mid 2007 to a peak of around 250–300 basis points
in mid 2009. Since then, spreads have declined a
little. These higher spreads have been gradually
owing through to the stock of outstanding large
business loans – since mid 2007, banks have repriced
about two-thirds of their outstanding loans. Overall,
the average interest rate on outstanding (xed- and
variable-rate) large business loans is estimated to
have risen by about 135 basis points relative to the
cash rate since mid 2007. This is less than the increase
on small business loans because a bigger share of
6 The higher risk margins apply mainly to non-residentially secured
loans. For residentially secured loans, which account for the bulk of
lending to small businesses, additional risk margins are generally
not applied.
Graph 9
-100
0
100
200
300
-100
0
100
200
300
2010
Variable Lending Rates
Cumulative change in spreads to the cash rate since June 2007
BpsBps
Housing
Personal
Large business
(outstanding)**
Large business
(new)**
Small business*
200820102008
*Indicator rate on residentially-secured term loans
** Loans greater than $2 million, RBA estimates
Sources: APRA; RBA
Household Business
43BULLETIN | MARCH QUARTER 2010
RECENT DEVELOPMENTS IN BANKS’ FUNDING COSTS AND LENDING RATES
large business loans are at variable rather than xed
rates and, to date, not all outstanding loans have
been repriced at the higher spreads.
Overall, the major banks’ average interest rate on
their outstanding household and business loans is
estimated to be around 160–165 basis points higher
relative to the cash rate, than it was in mid 2007.
This overall rise is at the lower end of the range of
increases in the main loan types, as through the crisis
period, the share of housing loans (which have lower
spreads) in the major banks’ overall loan books has
increased and the shares of business and personal
loans have decreased a little.
7
Regional banks have
likely recorded a slightly smaller increase in their
average lending rate, as more of their lending is
for housing. Most of the increases in the spreads
between household and business lending rates
and the cash rate took place during 2008 and in
the early months of 2009, when the global
nancial crisis was at its worst and banks were
facing increasing funding cost pressures.
For all banks, most of the increase in their lending
rates over the cash rate since mid 2007 has been
due to their higher funding costs. For the major
banks, however, there has also been some widening
in their lending margins. Information published by
the major banks in their nancial statements shows
that the average NIM on their Australian operations
was around 2.4 per cent in the second half of 2009,
about 20–25 basis points above pre-crisis levels
(Graph 10).
8
The major banks’ higher NIMs have supported their
return on equity, partly osetting the negative
eects of the cyclical increase in their bad debts
expense and the additional equity that they raised
during the downturn. In recent months, margins
7 Business credit grew steadily until late 2008, but over the past year
many businesses have sought to reduce their leverage by raising
equity to pay down debt. For more details see Black, Kirkwood and
Shah Idil (2009).
8 The major banks’ published NIM measure includes the interest
received on their total nancial assets (loans, liquid assets and other
debt securities), not just their loan assets, which is the focus of the
analysis in this article.
may have narrowed slightly, due to the ongoing
strong competition for deposits and a small decline
in spreads on new lending to large businesses.
The regional banks’ NIMs have declined steadily for
most of the crisis period, though in the latest half-
year there have been some signs that their NIMs
have risen a little. In the six months to December
2009 the regional banks’ average NIM was around
1.6 per cent, about 20 basis points lower than in
mid 2007. The narrowing in the regional banks’
average NIM is due to their overall funding costs
having risen by more than the major banks, and
their overall lending rates having risen by a little less,
reecting dierences in their lending mix. R
Graph 10
1.0
1.5
2.0
2.5
3.0
1.0
1.5
2.0
2.5
3.0
Banks’ Australian Net Interest Margin*
*From 2006 data are on IFRS basis; prior years are on AGAAP basis
** The latest data point is an estimate based on available data
Sources: RBA; bank reports
2010
%
2008200620042002
Major banks
Regional banks**
%
44 RESERVE BANK OF AUSTRALIA
RECENT DEVELOPMENTS IN BANKS’ FUNDING COSTS AND LENDING RATES
References
Black S, A Brassil and M Hack (2010), ‘Recent Trends
in Australian Banks’ Bond Issuance’, RBA Bulletin, March,
pp 27–33.
Black S, J Kirkwood and S Shah Idil (2009), ‘Australian
Corporates’ Sources and Uses of Funds’, RBA Bulletin,
October, pp 1–12.
Davies M, C Naughtin and A Wong (2009), ‘The Impact
of the Capital Market Turbulence on Banks’ Funding Costs’,
RBA Bulletin, June, pp 1–13.
Debelle G (2009), ‘Whither Securitisation?’, RBA Bulletin,
December, pp 44–53.
Schwartz C (2010), ‘The Australian Government Guarantee
Scheme’, RBA Bulletin, March, pp 19–26.