Banks’ Funding Costs and Lending Rates pdf
Bạn đang xem bản rút gọn của tài liệu. Xem và tải ngay bản đầy đủ của tài liệu tại đây (288.26 KB, 7 trang )
37Bulletin | march Quarter 2012
Introduction
There are a number of factors that influence the
lending rates banks set. The most important is
the cost of funding, which is a function of the
composition of liabilities and the costs of raising the
different liabilities. Beyond this, banks also consider a
number of other factors including pricing for different
types of risk – such as the credit risk associated with
the loan and the liquidity risk involved in funding
long-term assets with short-term liabilities – and
choices about growth strategies in different markets.
The level of the cash rate set by the Reserve Bank is
a primary determinant of the level of intermediaries’
funding costs and hence the level of lending rates. It is
the short-term interest rate benchmark that anchors
the broader interest rate structure for the domestic
financial system. However, there are other significant
influences on intermediaries’ funding costs, such as
risk premia and competitive pressures, which are not
affected by the cash rate. At various points in time,
changes in these factors can result in changes in
funding costs and lending rates that are not the result
of movements in the cash rate. The Reserve Bank
Board takes these developments into account in its
setting of the cash rate to ensure that the structure
of interest rates in the economy is consistent with the
desired stance of monetary policy.
In this article, we update previous Reserve Bank
research that has documented how changes in the
composition and pricing of funding have affected
the cost to banks of funding their aggregate loan
books, and how banks have responded to these
cost developments in setting their lending rates
(Fabbro and Hack 2011).
1
The article notes that
while deposit rates and yields on bank debt have
generally declined since mid 2011, the declines have
not matched the reduction in the cash rate over
this period. The increase in the relative cost of term
deposits and wholesale debt has led to an increase
in the weighted-average cost of funds for banks,
relative to the cash rate, since mid 2011. This increase
is in addition to the increase that occurred between
mid 2007 and 2010. The article also documents
the decline in bank lending rates since mid 2011,
and discusses the effect on banks’ margins of the
movement in funding costs and lending rates.
Composition of Banks’ Funding
Banks operating in Australia have diverse funding
bases, with most funding sourced from deposits,
and short-term and long-term wholesale debt. The
1 This article estimates, at an aggregate level, the cost to the banks
of funding their aggregate loan books and, in turn, their lending
rates. The funding structure of individual banks can differ quite
markedly from the aggregate. The Reserve Bank uses a wide range of
information to make these estimates. It supplements the analysis with
detailed discussions with financial institutions.
Banks’ Funding Costs and Lending Rates
Cameron Deans and Chris Stewart*
* The authors are from Domestic Markets Department.
Over the past year, lending rates and funding costs have both fallen in absolute terms but have
risen relative to the cash rate. The rise in funding costs, relative to the cash rate, reflects strong
competition for deposits, particularly term deposits, and higher spreads on wholesale debt
reflecting an increase in investors’ concerns about the global banking industry. While spreads
have narrowed recently, they are still noticeably higher than they have been over the past couple
of years. Over the past six months, lending rates have generally fallen by more than funding costs.
38 ReseRve bank of austRalia
banks’ funding Costs and lending Rates
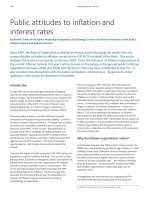
the growth in bank deposits since the onset of the
financial crisis and now account for about 45 per
cent of banks’ deposits, up from 30 per cent in the
middle of 2007 (Graph 2). The increase in the share of
deposits, particularly term deposits, reflects a number
of interrelated factors. First, banks have offered
relatively attractive rates to depositors (discussed
below). Second, strong business profits and business
caution have resulted in larger corporate cash
holdings, which have been increasingly invested
in deposits rather than other financial instruments,
particularly short-term bank paper. Third, households
have significantly increased their term deposits
placed directly with banks instead of investing in
other financial assets. There has also been a rise in
deposits placed via superannuation and managed
funds.
For banks, term deposits have the advantage of
generally being a relatively stable funding source:
while the average maturity of term deposits is
fairly short, at somewhere between four and seven
months, these deposits are typically rolled over a
number of times. The rates on new term deposits
can also be adjusted quickly to influence the growth
in this source of funding.
%
%
0
10
20
30
40
50
0
10
20
30
40
50
Short-term debt**
Equity
Securitisation
Long-term debt
Domestic deposits
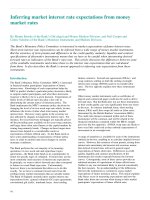
Per cent of funding
Funding Composition of Banks in Australia*
*Adjusted for movements in foreign exchange rates
** Includes deposits and intragroup funding from non-residents
Sources: APRA; RBA; Standard & Poor’s
20102008 201220062004
0
10
20
30
40
0
10
20
30
40
0
10
20
30
40
0
10
20
30
40
Term Deposits with Banks in Australia
Per cent of total A$ domestic deposits
*Includes stockbrokers and insurance brokers
** Authorised deposit-taking institutions
***Includes community organisations
Source: APRA
June 2007
%
%
January 2012
Household
Business
Super funds and fund managers*
Other non-ADI financials
ADIs**
Government***
Graph 1
Graph 2
relative importance of these funding sources has
undergone significant change over recent years in
response to a reassessment of funding risks by banks
globally, as well as regulatory and market pressures
(Graph 1). In particular, an increasing share of funding
has been sourced from deposits. There has also been
a shift away from short-term wholesale funding
towards long-term wholesale funding, as banks have
sought to reduce their rollover risk (that is, the risk
associated with replacing maturing wholesale debt).
These trends are consistent with the objectives of
the Basel III global liquidity standards.
The marked changes in the composition of funding at
the aggregate level are reflective of significant shifts
in the composition of funding for different sectors
within the banking industry. The major banks have
increased their use of deposits and reduced their use
of short-term debt while the regional banks have
significantly decreased their use of securitisation and
increased their use of deposits. There has also been a
marked reduction in foreign banks’ use of short-term
wholesale debt. Credit unions and building societies
continue to raise the vast majority of their funds via
deposits.
Within banks’ deposit funding, there has been a
marked shift towards term deposits, which pay
higher interest rates than other forms of deposits.
Indeed, term deposits have accounted for most of
39Bulletin | march Quarter 2012
Banks’ Funding Costs and lending Rates
While most of the competition among banks has
been for term deposits, banks have also offered
more attractive transaction and savings accounts,
particularly through paying higher interest rates on
these accounts. The increase in the value of funds
invested in these deposits has largely been placed in
online saver accounts and accounts with introductory
bonuses and/or bonuses for regular deposits. Banks
have reported little growth in the value of low-interest
transaction-style deposit accounts.
In wholesale markets, the major banks have raised
a sizeable amount of funding through covered
bonds in recent months. In total, the major banks
have issued more than $22 billion of covered bonds
following the passage of enabling legislation in
October 2011. While this has had little effect on the
composition of banks’ funding at this stage, given
the large stock of existing funding, it has allowed
the major banks to achieve funding at longer tenors
than is usually available with unsecured bonds.
Covered bonds have generally been issued for terms
of 5 to 10 years, whereas unsecured bank bonds
are generally issued with maturities of 3 to 5years.
In addition to the issuance of covered bonds, the
major banks issued about $10 billion of residential
mortgage-backed securities (RMBS) during the past
year. While this was their largest annual issuance
since mid2007, securitisation remains a small share
of the banks’ total funding. In contrast, there was a
slight decline in regional banks issuance of RMBS
in2011.
Cost of Funding
The absolute level of banks’ funding costs fell
over the second half of 2011, but by less than the
reduction in the cash rate. There were particularly
pronounced increases in the cost of term deposits
and long-term wholesale debt relative to the cash
rate as financial market conditions deteriorated in
late 2011.
Deposits
Competition for deposits, which had moderated
somewhat in early 2011, intensified in late 2011.
Consequently, while the cash rate has fallen by
50 basis points since mid 2011, the major banks’
average cost of deposits is estimated to have
declined by about 25basis points.
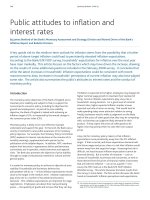
The average spread above market rates on the major
banks’ advertised term deposit ‘specials’ – the most
relevant benchmark rate for term deposit pricing
– has increased by about 35 basis points over the
past year (Graph 3). Furthermore, an increase in
the share of deposits written at rates higher than the
‘carded’ rates advertised by banks has meant that
the average rate on outstanding term deposits has
not fallen as quickly as benchmark rates as term
deposits have been rolled over.
The average advertised rate on at-call savings
deposits – including bonus saver, cash management
and online savings accounts – rose by around 20 basis
points relative to the cash rate over 2011 (although
again the interest rate declined in absolute terms).
Taking into account an increase in the proportion of
savings deposits earning bonus rates, the average
effective rate on these deposits is estimated to
have increased by between 35 and 50 basis points
relative to the cash rate. Interest rates on transaction
-150
-100
-50
0
50
100
-150
-100
-50
0
50
100
Major Banks’ Deposit Rates
Spreads over money market rates of equivalent maturity
*Spread to cash rate; existing customers only; excludes temporary
bonus rates
Sources: Bloomberg; RBA
Term deposit ‘specials’
Bp
sB
ps
2007 2012200
82
0112010
At-call saving deposits*
2009
Graph 3
40 ReseRve bank of austRalia
banks’ funding Costs and lending Rates
accounts have not fallen in line with the cash rate as
many only pay very low nominal interest rates.
Wholesale debt
The absolute cost of issuing new unsecured
wholesale debt fell during 2011 (Graph 4). Relative
to risk-free benchmarks, however, the cost of issuing
wholesale debt has increased materially since
mid 2011 (Graph 5). This increase was particularly
pronounced at longer maturities.
2
While spreads
on banks’ new wholesale debt have declined again
2 There is a very small amount of credit risk in overnight index swap
(OIS) rates. For more information, see Boge and Wilson (2011).
following the European Central Bank’s first three-year
longer-term refinancing operation at the end of 2011,
they remain higher than in mid 2011. The increase in
spreads on banks’ wholesale funding reflects global
investors demanding more compensation for taking
on bank credit risk, although the rise for Australian
banks has been less marked than it has been for other
banks globally. The decisions by Standard & Poor’s
and Fitch to downgrade the Australian major banks’
credit ratings by one notch, from AA to AA-, have
had no discernible effect on these banks’ borrowing
costs. There has also been an increase in the costs
associated with hedging the foreign exchange risk
on new foreign-currency denominated bonds.
While the relative cost of new long-term wholesale
funds is currently higher than that of maturing
funds, this has had only a moderate effect on the
major banks’ average bond funding costs relative
to the cash rate to date (Graph 6). This reflects the
fact that it takes at least 3 to 4 years for the major
banks’ existing bond funding to be rolled over. Since
spreads began to rise sharply in August 2011, the
major banks’ issuance of new bonds amounts to
about 12 per cent of their outstanding bonds. As
a result, the cost of the major banks’ outstanding
long-term wholesale debt is likely to have risen by
about 25basis points relative to the cash rate over the
past year. The increase is smaller at around 10basis
lllllll
2
4
6
8
2
4
6
8
3-year Interest Rates
%
Sources: RBA; UBS AG, Australia Branch
2012201020082006
%
Major banks’ senior
unsecured bonds
Swap
Commonwealth
Government
Spread to swap; 3–5 year
Major Banks’ Bond Funding Costs
Offshore*
Secondary market spread
Bps
100
200
100
200
100
200
100
200
0
100
200
0
100
200
0
100
200
0
100
200
Bps
Bps
Bps
2012201020082006
Domestic
Outstanding cost
*Secondary market spreads are assumed to equal domestic spreads
plus an estimate of foreign exchange hedging costs
Sources: APRA; Bloomberg; RBA; UBS AG, Australia Branch
Primary market spread
0
50
100
150
200
250
0
50
100
150
200
250
Major Banks’ Wholesale Funding Spreads
A$ unsecured debt, spreads to OIS and CGS
*Late 2008
** Average from 2005 to 2007
Sources: Bloomberg; RBA; Tullet Prebon (Australia) Pty Ltd; UBS AG,
Australia Branch
Crisis (peak*)
Bp
sB
ps
Maturity
Pre-crisis**
June 2011
Current
1m 1yr3m 6m 5yr 7yr2yr 3yr 4yr
Graph 4
Graph 6
Graph 5
41Bulletin | march Quarter 2012
Banks’ Funding Costs and lending Rates
points if fixed-rate wholesale debt is assumed to
be swapped back into variable-rate obligations.
The extent of the rise in relative costs for individual
banks varies according to each bank’s use of interest
rate derivatives. If the cash rate, bond spreads and
hedging costs remain at their current levels, the
average cost of banks’ long-term wholesale debt
will increase by a further 5 to 10basis points, relative
to the cash rate, by the end of 2012 as maturing
bonds and hedges are rolled over.
Short-term wholesale debt is mainly priced off 1- and
3-month bank bill rates. While these rates generally
fell over the latter half of 2011 due to the sharp fall
in the expected cash rate over this period, there was
an increase in the cost of short-term debt relative to
the expected cash rate as measured by the bank bill
to OIS spread over the same period (Graph 7). The
increase in this spread also contributed to a higher
average cost of long-term wholesale debt, relative
to the cash rate, given that most of this debt is
benchmarked to short-term bank bill swap rates.
3
These pricing conventions ensure that changes in
the cash rate, and expectations about its future level,
have a direct effect on both short- and long-term
wholesale funding costs. Since the beginning of
2012, the spread between bank bills and OIS has
3 Variable-rate bonds are generally benchmarked to the 3-month bank
bill swap rate, while fixed-rate bonds are generally swapped back into
variable-rate obligations that also reference the 3-month bank bill
swap rate.
narrowed noticeably which, if maintained, should
alleviate some of the upwards pressure, relative to
the cash rate, on the cost of funding banks’ aggregate
loan books.
Overall cost of funding
Taking the costs of individual funding sources noted
above, and weighting them by their share of total
bank funding, provides an estimate of the overall
change in the cost of funding banks’ aggregate
loan books. Compared with mid 2007, the average
cost of the major banks’ funding is estimated to be
about 120–130 basis points higher relative to the
cash rate (Graph 8). Most of the increase occurred
during 2008 and early 2009 when the financial crisis
was at its most intense. Since the middle of 2011,
however, there has been a further increase in banks’
funding costs relative to the cash rate of the order of
20–25basis points.
The increase in funding costs, relative to the cash
rate, differs across institutions given differences
in their funding compositions and the pricing of
different liabilities. The available evidence suggests,
for example, that the overall increase in the regional
banks’ funding costs since the onset of the financial
crisis has been larger than that experienced, on
average, by the major banks. This mainly reflects
l llll
-50
0
50
100
150
lllll
-50
0
50
100
150
0
50
100
150
0
50
100
150
Major Banks’ Funding Costs*
Cumulative change in spreads to the cash rate since June 2007
*RBA estimates
** Weighted-average spread to cash rate and CGS for long-term variable rate
and fixed-rate debt, respectively. Includes foreign currency hedging costs.
Sources: Bloomberg; RBA; UBS AG, Australia Branch
2008
Deposits (excluding CDs)
Bps Bps
Bps Bps
2010 20122008 2010 2012
Total
Long-term debt**
Short-term debt
(including CDs)
Graph 8
Rates
Money Market Interest Rates
Sources: AFMA; RBA; Tullett Prebon (Australia) Pty Ltd
%
4
6
8
4
6
8
lllll
0
30
60
90
0
30
60
90
%
Bps Bps
Bank bill spread to OIS
3-month bank bill
3-month OIS
20082007 2009 2010 20112012
Graph 7
42 ReseRve bank of austRalia
banks’ funding Costs and lending Rates
the larger increase in the cost of the regional
banks’ deposits and a more significant shift in their
fundingmix.
Banks’ Lending Rates
For close to a decade prior to the global financial
crisis, banks’ overall cost of funds followed the cash
rate closely, as risk premia in markets were low and
stable. There was also little change in the relative
importance of equity capital that, together with
debt, provides funds used to make loans and on
which banks seek a return. Likewise, there was little
change in the risk margins banks used to determine
loan rates. Accordingly, interest rates on business
and housing variable-rate loans tended to adjust in
line with the cash rate. Nevertheless, over this period
there was a gradual decline in the spread between
average interest rates paid on housing loans and
the cash rate, as the discount to the indicator rate
offered to new borrowers was increased. Indeed, the
spread between the average mortgage rate paid
and the cash rate declined from 275 basis points in
1996 to around 125basis points in 2007.
Since the onset of the financial crisis, banks have
increased the spread between lending rates and
the cash rate for all loan types. The increases have,
however, varied across the different types of loans,
partly reflecting differences in the reassessment
of the riskiness of those loans and expectations
regarding loss rates.
Over 2011, the average interest rate on new
variable-rate housing loans decreased by about
10 basis points relative to the cash rate as
banks increased the size of the discounts on new
mortgages amidst stronger competition for
mortgage lending (Graph 9). In the latter stages
of 2011 and early 2012 there was, however, a small
reduction in these discounts. Furthermore, in early
2012, most banks increased their standard variable
rates by an average of about 10 basis points.
Consequently, between early 2011 and early 2012,
the spread between new variable-rate loans and
the cash rate has increased by about 5basis points.
The spread between the average interest rate on
outstanding variable-rate housing loans and the
cash rate has risen by a similar amount.
Around two-thirds of business loan rates are tied
to the bank bill swap rate rather than the cash rate.
The level of interest rates on loans to large and
small businesses has fallen broadly in line with the
declines in benchmark rates over the past year,
although this resulted in some increase in these rates
relative to the cash rate since mid2011. Risk margins
on business lending have been little changed over
the past couple of years, although in the case of
large business lending some of the recent stability in
margins on outstanding loans is likely to reflect the
gradual repricing of facilities (Graph 10). This follows
a period in which there was a noticeable increase in
business lending rates relative to benchmark rates,
reflecting a combination of higher relative funding
costs and a reassessment of risk margins (RBA 2011).
Higher risk margins resulted in both an increase in
average spreads as well as a noticeable increase in
the range of spreads paid on the stock of business
lending. As a result of the former, small business rates,
even those secured against residential property, are
above the interest rates on housing loans.
0
100
200
300
0
100
200
300
0
100
200
300
0
100
200
300
Variable Housing Rates
Sources: ABS; APRA; Perpetual; RBA
Indicator rate
Bps Bps
Spread to cash rate
Average
new rate
2004 2008 2012
Average outstanding rate
20001996
Graph 9
43Bulletin | march Quarter 2012
Banks’ Funding Costs and lending Rates
Net Interest Margins
Over the past year, lending rates and funding costs
have both fallen in absolute terms but have risen
relative to the cash rate. Lending rates have generally
fallen by more than funding costs which, all else
being equal, would imply that the major banks’ net
interest margins have contracted a little. However,
while lending rates and funding costs are important
determinants, banks’ net interest margins are also
influenced by a number of other factors including:
• changes in the composition of banks’ assets;
• changes in banks’ use of equity funding (given
that equity does not incur interest payments but
banks seek a return on this source of funding
when setting their lending rates);
• changes in the interest income lost because of
impaired loans; and
• the use of derivatives to hedge the interest rate
risk on their assets and liabilities.
The contribution from these other factors varies
from year to year.
Recent movements in margins reported by the major
banks in their statutory results – to end September
2011 for three of the banks and end December
for the other – are relatively small compared with
the decline in margins experienced over the
Spreads on Outstanding Business Loans
0
100
200
300
400
500
0
100
200
300
400
500
*Spread to the end-month cash rate
** Spread to the three-month trailing average of the 90-day bank bill rate
Sources: APRA; RBA
Bps Bps
Variable-rate*
20122008
Small facilities Large facilities
Bills**
Variable-rate**
20122008
1
2
3
4
1
2
3
4
Banks’ Net Interest Margin*
*From 2006 data are on an IFRS basis; prior years are on an AGAAP basis
Sources: RBA; banks’ annual and interim reports
%
Domestic operations
%
2008 201220002004
1996
Major banks
Regional banks
Graph 10
Graph 11
preceding decade (Graph 11). The final observations
in Graph 11 do not include the full effect of the
increase in funding costs relative to the cash rate
since mid2011. December quarter trading updates
provided by three of the banks report a narrowing
in margins of around 5 to 10 basis points, consistent
with the above analysis.
The regional banks’ net interest margins continue
to be lower than those of the major banks, primarily
reflecting more expensive deposit and long-term
wholesale debt funding costs, and a larger share of
lower-margin housing lending.
R
References
Boge M and I Wilson (2011), ‘The Domestic Market
for Short-term Debt Securities’, RBA Bulletin, September,
pp39–48.
Fabbro D and M Hack (2011), ‘The Effects of Funding
Costs and Risk on Banks’ Lending Rates’, RBA Bulletin, March,
pp 35–41.
RBA (Reserve Bank of Australia) (2011), ‘Submission
to the Inquiry into Access for Small and Medium
Business to Finance’, Submission to the Parliamentary
Joint Committee on Corporations and Financial Services,
8 February. Available at < />publications/submissions/inquiry-access-small-med-
fin-0211.pdf>.