COST OF POLLUTION IN CHINA ECONOMIC ESTIMATES OF PHYSICAL DAMAGES potx
Bạn đang xem bản rút gọn của tài liệu. Xem và tải ngay bản đầy đủ của tài liệu tại đây (5.8 MB, 151 trang )
COST OF POLLUTION
IN CHINA
ECONOMIC ESTIMATES OF PHYSICAL DAMAGES
CONFERENCE EDITION
THE GOVERNMENT OF THE
PEOPLE’S REPUBLIC OF CHINA
COST OF POLLUTION IN CHINA
THE WORLD BANK
THE WORLD BANK
The State Environmental Protection Administration
115 Xizhimen Nanxiaojie, Beijing 100035, P. R. China
Tel: 86 (10) 6653.2331
Fax: 86 (10) 6653.2424
www.sepa.gov.cn
Rural Development, Natural Resources and Environment
Management Unit, East Asia and Pacific Region, The World Bank
1818 H Street, NW, Washington DC 29433, USA
Tel: + 1 (202) 458.4073
Fax: + 1 (202) 477.2733
www.worldbank.org/eapenvironment
The World Bank Office, Beijing
16th Floor, China World Tower 2
No. 1 Jianguomenwai Avenue
Beijing 100004, P. R. China
Tel: + 86 (10) 5861.7600.
Fax: + 86 (10) 5861.7800.
www.worldbank.org.cn
Environmental and Social Development Unit
East Asia & Pacific Region
Ph: 202-458-5660
Fax: 202-522-1666
e-mail:
IN CHINA
ECONOMIC ESTIMATES OF PHYSICAL DAMAGES
The World Bank
State Environmental Protection Administration, P. R. China
This publication is available online at www.worldbank.org/eapenvironment.
Front cover photos: John D. Liu. From the film “A Green Call” prepared by the Environmental Edu-
cation Media Project in Beijing in cooperation with the World Bank.
Cover design: Circle Graphics, Jostein Nygard
Rural Development, Natural Resources and Environment Management Unit
East Asia and Pacific Region
The World Bank
Washington, D.C.
February, 2007
This volume is a product of an expert team from China, international experts from various countries
and the staff of the World Bank. The findings, interpretations, and conclusions expressed in this paper
do not necessarily reflect the views of the Executive Directors of the World Bank of the governments
they represent. The World Bank does not guarantee the accuracy of the data included in this work.
The boundaries, colors, denominations, and other information shown on any map in this work do
not imply any judgment on the part of The World Bank concerning the legal status of any territory
or the endorsement or acceptance of such boundaries.
The material in this publication is copyrighted. Copying and/or transmitting portions of all of this
work without permission may be a violation of applicable law. The World Bank encourages dissem-
ination of its work and will normally grant permission to reproduce portions of the work promptly.
For permission to photocopying or reprint any part of this work, please send a request with complete
information to the Copyright Clearance Center, Inc., 222 Rosewood Drive, Danvers, MA 01923,
USA, telephone 978-750-8400, fax 978-750-4470, www.copyright.com.
All other queries on rights and licenses, including subsidiary rights, should be addressed to the
Office of the Publisher, The World Bank, 1818 H Street NW, Washington, DC 20433, USA,
fax 202-522-2422, e-mail
CHINA–ENVIRONMENTAL COST OF POLLUTION
iii
ACKNOWLEDGMENTS v
ABBREVIATIONS AND ACRONYMS vii
FOREWORD ix
EXECUTIVE SUMMARY xi
1 Overview 1
2 Health Impacts of Ambient Air Pollution 19
3 Health Impacts of Water Pollution 33
4 Valuation of Environmental Health Risks 67
5 Non-Health Impacts of Water Pollution 79
6 Non-Health Impacts of Air Pollution 111
Table of Contents
research effort by a joint Chinese and interna-
tional expert team being contracted by the
World Bank.
In Beijing, the overall team was lead by Guo
Xiaomin, a senior advisor to the State Environ-
mental Protection Administration (SEPA). His
team included Yu Fang from the China Acad-
emy of Environmental Planning (CAEP), who
has handled the overall technical coordination,
Zhou Guomei coordinated the Valuation of
Environmental Health Risk (VEHR) study
together with Zhang Kai, Zhou Jun and Wu
Yuping from the Policy Research Center for
Environment & Economy. Pan Xiaochuan at
the Medical College of Peking University lead a
team on dose response function development,
which included Wang Lihua, and Jiang Jinhua.
Monitoring data was provided by the China
National Monitoring Centre by Zhuo Jianping,
Ling Lixin, Fu Deqing and WuHuaimin. Zhao
Yaoming has participated from the Ministry of
Agriculture.
A team from the Water Resources and
Hydropower Planning and Design Institute of
the Ministry of Water Resources (MWR) lead
by Li Yuanyuan, which also included Zhou Zhi-
wei, Cao Jianting and Zhangwei provided assis-
tance on water scarcity subjects. Gao Jun and
Xu Ling from the Ministry of Health (MoH)
worked on statistical health data. A team from
the Rural Water Supply Central Disease Control
(CDC) lead by Fan Fucheng and Tao Yong pro-
vided assistance on particularly drinking water
and partly health related data.
In Shanghai, a team lead by Prof. Peng Xizhe
at the Fudan University, included Chen Yan, Tian
Wenhua and Cheng Yuan. In Chongqing, a team
lead by Ass. Prof. Chen Gangcai at the Chongqing
Academy of Environmental Science included
Wang Fei, Ran Tao, Zhou Zhien, Liu Lanyu, and
Chen Derong in addition to Yang Xioalin, Xiang
Xinzhi and Qin Lei from Chongqing CDC and
Tang Guil from Chongqing MoH.
International experts have included Haakon
Vennemo and Henrik Lindhjem (ECON),
Kristin Aunan and Hans Martin Seip (CICERO),
Alan Krupnick, Sandy Hoffmann and Michael
McWilliams (RFF), Bjorn Larsen and Ramon
Ortiz (independent consultants).
At the World Bank, the project was coordi-
nated by Jostein Nygard, task team leader
(EASRE) under the overall supervision of
Magda Lovei (EASOP). Substantive inputs were
provided by Maureen Cropper (DEC), Tamer
Samah Rabie (ECSHD), while technical sup-
port was provided by Marija Kuzmanovic and
Andrew Murray (EASEN/EASRE).
The current report has mainly be written by
Maureen Cropper, Tamer Rabie, Haakon Ven-
CHINA–ENVIRONMENTAL COST OF POLLUTION
v
Acknowledgments
nemo, Kristin Aunan, Hans Martin Seip, Yu
Fang, Guo Xiaoming and Jostein Nygard, while
the extensive Chinese expert team has mainly
been writing the progress and background
reports that this report builds upon. The RFF,
Shanghai and Chongqing teams have been writ-
ing the “Willingness to Pay for Reduced Mortal-
ity Risk Reduction in Shanghai and Chongqing”
study, which is also being published as a sepa-
rate World Bank discussion paper report.
Mainly based upon work by Bjorn Larsen, a
separate discussion paper report “China Health
Effects of Indoor Air Pollution” is also being
published.
Peer reviewers included Chris Nielsen (Har-
vard University), Hao Jiming (Tsinghua Uni-
versity), Kseniya Lvovsky (World Bank,
SASES), Rita Klees (World Bank, ENV), and
Anil Markandy (ECSSD). Additional reviews
and comments were provided by David Dollar,
Bert Hofman and Andres Liebenthal (World
Bank, Beijing), Maria Teresa Serra (EASES/
EAPVP) Julien Labonne and Jian Xie (EASES/
EASRE), Anjali Acharya and Giovanni Ruta
(ENV) and Charles E. Di Leva (LEGEN).
Coordination of the study within SEPA, has
been made by their Foreign Economic Cooper-
ation Office (FECO) with Wang Xin and Xie
Yongming. Personnel within SEPA’s Planning
and Finance, Pollution Control and Science and
Technology departments in addition MoH per-
sonnel have reviewed the report extensively.
The report was edited by Robert Livernash,
consultant. Circle Graphics designed and man-
aged desktopping. Production was supervised by
Jaime Alvarez. Photos provided by John Liu, the
Environmental Education Media Project, from
a World Bank-contracted film “A Green Call”.
Chinese translation was provided by the transla-
tion desk at SEPAs Department of International
Cooperation.
Finally, we would like to express our gratitude
to the Government of Norway and Finland,
which provided the main trust funds (TFESSD)
to carry out the study. The study was also sup-
ported by the World Bank’s own funding.
ACKNOWLEDGMENTS
CHINA–ENVIRONMENTAL COST OF POLLUTION
vi
CHINA–ENVIRONMENTAL COST OF POLLUTION
vii
ACS American Cancer Society
AHC Adjusted Human Capital
BOD Biological Oxygen Demand
BOH Bureau of Health (at local levels)
CAEP Chinese Academy for Environmental Planning
CAES Chongqing Academy of Environmental Sciences
CDC Center for Disease Control and Prevention
CECM Chinese Environmental Cost Model
CEVD Cerebrovascular Disease
CNHS China National Health Survey
CO Carbon Monoxide
COD Chemical Oxygen Demand
COI Cost of Illness
COPD Chronic Obstructive Pulmonary Disease
CSMI Clear Water and Sewage Mixed Irrigation
CV Contingent Valuation
CVD Cardiovascular Disease
DALY Disability-Adjusted Life Year
DC Dichotomous Choice Method
DSP Disease Surveillance Point
ECM Environmental Cost Model
EU European Union
EV Emergency Visit
GDP Gross Domestic Product
GIOV Gross Industrial Output Value
HEI Health Effects Institute
HH Household
ICD International Classification of Disease
Abbreviations and Acronyms
IWQI Integrated Water Quality Index
MoA Ministry of Agriculture
MoH Ministry of Health
MWR Ministry of Water Resources
NAPAP National Acid Precipitation Assessment Program
NBS National Bureau of Statistics
NOx Nitrogen Oxides
O
3
Ozone
OPV Outpatient Visit
OR Odds Ratio
PC Payment Card Method
PM Particulate Matter
PM10 Particulate Matter of Less than 10
μm in diameter
PPP Purchasing Power Parity
PSI Pure Sewage Irrigation
QALY Quality Adjusted Life Year
RD Respiratory Disease
RFF Resources for the Future
RMB Chinese Currency, Yuan
RR Relative Risk
SCE Standard Coal Equivalent
SEPA State Environmental Protection Administration
SO
2
Sulphur Dioxide
TSP Total Suspended Particulates
TVEs Town and Village Enterprises
UNEP United Nations Environmental Programme
USEPA United States Environmental Protection Agency
VEHR Valuation of Environmental Health Risk
VSL Value of Statistical Life
WHO World Health Organization
WTP Willingness to Pay
ABBREVIATIONS AND ACRONYMS
CHINA–ENVIRONMENTAL COST OF POLLUTION
viii
This is a draft edition of the Cost of Pollution in
China: Economic Estimates of Physical Damages
report, which will be presented at the interna-
tional conference on Sustainable Development in
Beijing, China on March 2, 2007. The purpose
of this conference edition is to present the findings
of the studies undertaken in China over the
past about 3 years as well as to obtain relevant
comments and feedback from the conference
participants that could be included in the final
edition of the report.
This report traces its origin to 1997, when the
World Bank published the China 2020 – Clear
Water Blue Skies report. This work underscored
the economic implications of environmental
degradation by estimating that the cost of air and
water pollution in China is between 3.5 and 8
percent of GDP. Following these findings, the
Chinese government requested the World Bank
to collaborate with a number of Chinese and
international research institutes to develop an
environmental cost model (ECM) using
methodologies specific to the China context.
This work includes an in-depth review of
international ECM studies, and development
and application of new methodologies (and soft-
ware) for annual estimations of water and air
pollution in China at both central and local lev-
els. The aim of this work is to increase awareness
of the economic impacts of air and water pollu-
tion in China, to provide relevant policy infor-
mation to decision makers and to enable the
Chinese government to make optimal resource
allocations for environmental protection.
Prior to the publication of this report, com-
prehensive comments have been received by
both the Chinese Government, particularly the
State Environmental Protection Administration
(SEPA) and independent Chinese and Non-
Chinese reviewers. Some of the subjects that
have been carefully developed during the course
of implementation, including certain physical
impact estimations as well as economic cost cal-
culations at local levels have been left out of this
conference edition due to still some uncertain-
ties about calculation methods and its applica-
tion. How to possibly make use of these
materials will be continuously worked on during
and after the conference. Moreover, the com-
prehensive reference material that has been
developed by joint Chinese and International
expert team (including progress reports and var-
ious background reports), is going to be attached
in a CD-ROM in the final edition.
Wish you good reading of this edition and
looking forward to receiving your comments.
Report Authors
February 2007
CHINA–ENVIRONMENTAL COST OF POLLUTION
ix
Foreword to the Conference Edition
CHINA–ENVIRONMENTAL COST OF POLLUTION
In recent decades, China has achieved
rapid economic growth, industrializa-
tion, and urbanization. Annual in-
creases in GDP of 8 to 9 percent have
lifted some 400 million people out of
dire poverty. Between 1979 and 2005,
China moved up from a rank of 108th
to 72nd on the World Development
Index. With further economic growth,
most of the remaining 200 million
people living below one dollar per day
may soon escape from poverty. Al-
though technological change, urban-
ization, and China’s high savings rate
suggest that continued rapid growth
is feasible, the resources that such
growth demands and the environmen-
tal pressures it brings have raised
grave concerns about the long-term
sustainability and hidden costs of
growth. Many of these concerns are
associated with the impacts of air and
water pollution.
Rapid Economic Growth Has Had Positive Environmental
Impacts but Also Created New Environmental Challenges
Considering China’s strong economic growth over the last 20–25 years, there
is no doubt that it has had positive impacts on the environment. Along-
side economic growth, technology improvements over this period have cre-
ated much-improved resource utilization. Energy efficiency has improved
drastically—almost three times better utilization of energy resources in
2000–02 compared to 1978. As a result of the changing industrial structure,
the application of cleaner and more energy-efficient technologies, and pollu-
tion control efforts, ambient concentrations of particulate matter (PM) and
sulfur dioxide (SO
2
) in cities have gradually decreased over the last 25 years.
Implementation of environmental pollution control policies—particularly
command-and-control measures, but also economic and voluntarily
measures—have contributed substantially to leveling off or even reducing
pollution loads, particularly in certain targeted industrial sectors.
At the same time, new environmental challenges have been created. Fol-
lowing a period of stagnation in energy use during the late 1990s, total energy
consumption in China has increased 70 percent between 2000 and 2005,
with coal consumption increasing by 75 percent, indicating an increasingly
energy-intensive economy over the last few years. Moreover, between 2000
and 2005, air pollution emissions have remained constant or, in some
instances, have increased. The assessment at the end of the tenth five-year
plan (2001–05) recently concluded that China’s emissions of SO
2
and soot
were respectively 42 percent and 11 percent higher than the target set at the
beginning of the plan. China is now the largest source of SO
2
emissions in
the world. Recent trends in energy consumption, particularly increased coal
use, provide a possible explanation for the increase in SO
2
emissions.
Water pollution is also a cause for serious concern. In the period between
2001 and 2005, on average about 54 percent of the seven main rivers in
China contained water deemed unsafe for human consumption. This repre-
Executive Summary
ⅷ
sents a nearly 12 percent increase since the early
1990s. The most polluted rivers occurred in the
northeast in areas of high population density.
The trends in surface water quality from 2000 to
2005 suggest that quality is worsening in the
main river systems in the North, while improv-
ing slightly in the South. This may partly be the
result of rapid urbanization (the urban popula-
tion increased by103 million countrywide from
2000 to 2005), which caused COD loads from
urban residents to increase substantially and,
hence, surpass the planned targets for 2005.
Rapid industrialization probably also plays a part.
Northern China Bears a Double
Burden from Air and Water Pollution
While the most populous parts of China also
have the highest number of people exposed to air
pollution, it is striking that the areas with the
highest per capita exposure are almost all located
in northern China (Qinghai, Ningxia, Beijing,
Tianjin, Shaanxi, and Shanxi). The exception is
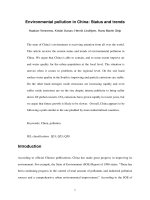
Hunan, which is located in the South. In Fig-
ure 1, the color of the provinces on the map
shows the percentage of the urban population
exposed to air pollution, while the bars indicate
the absolute number of people exposed.
Similarly, the most severely polluted water
basins—of the Liao, Hai, Huai, and Songhua
rivers—are also located in northern China (see
figure 2 for surface water quality). North China
also has serious water scarcity problems. Some
provinces—including Beijing, Shanxi, Ningxia,
Tianjin, and Jiangsu—seem to face the double
burden of exposure to high levels of both air and
water pollution. However, while air pollution
levels may be directly associated with population
EXECUTIVE SUMMARY
CHINA–ENVIRONMENTAL COST OF POLLUTION
xii
Xinjiang
Neimeng
Qinghai
Gansu
Sichuan
Jilin
Yunnan
Heilongjiang
Hebei
Hubei
Hunan
Shaanxi
Henan
Guangxi
Shanxi
Anhui
Jiangxi
Guizhou
Liaoning
Fujian
Shandong
Guangdong
Jiangsu
Zhejiang
Chongqing
Ningxia
Hainan
Beijing
Tianjin
Shanghai
Pollution Exposure
0 - 10%
11 - 30%
31 - 45%
46 - 60%
61 - 70%
71 - 80%
81 - 90%
91 - 100%
200,000
Population Exposed
to Pollution
FIGURE 1. Urban Population Exposed to PM10 levels, 2003
exposure, the same does not necessarily apply to
surface water pollution. This is because popula-
tions generally have different drinking water
sources that may allow them to escape high levels
of contamination. About 115 million people in
rural China rely primarily on surface water as
their main source of drinking water. Surface
water as a drinking water source is more vulner-
able to possible pollution compared to other,
safer drinking sources.
Air and Water Pollution
have Severe Health Impacts
According to conservative estimates, the eco-
nomic burden of premature mortality and
morbidity associated with air pollution was
157.3 billion yuan in 2003, or 1.16 percent of
GDP. This assumes that premature deaths are
valued using the present value of per capita GDP
over the remainder of the individual’s lifetime.
If a premature death is valued using a value of
a statistical life of 1 million yuan, reflecting
people’s willingness to pay to avoid mortality
risks, the damages associated with air pollution
are 3.8 percent of GDP. These findings differ in
two important ways from previous studies of the
burden of outdoor air pollution in China. First,
they are based on Chinese exposure-response
functions, as well as on the international litera-
ture; and second, they are computed for indi-
vidual cities and provinces. Previous estimates
by WHO (Cohen et al. 2004) were based on
the assumption that increases in PM beyond
100 g/m
3
of PM
10
caused no additional health
damage.( In the base case considered by WHO,
EXECUTIVE SUMMARY
CHINA–ENVIRONMENTAL COST OF POLLUTION
xiii
FIGURE 2. Water Quality Levels, 2004
relative risk does not increase beyond 50 g/m3
of PM
2.5
, which is approximately equivalent to
100 g/m3 of PM
10
.) This assumption implies
that the WHO estimates cannot be used to eval-
uate the benefits of specific urban air pollution
control policies.
Two-thirds of the rural population is without
piped water, which contributes to diarrheal disease
and cancers of the digestive system. The cost of these
health impacts, if valued using a VSL of 1 million,
are 1.9 percent of rural GDP. Analysis of data
from the 2003 National Health Survey indicates
that two-thirds of the rural population does not
have access to piped water. The relationship
between access to piped water and the incidence
of diarrheal disease in children under the age of
5 confirms this finding: the lack of access to
piped water is significantly associated with excess
cases of diarrheal disease and deaths due to diar-
rheal disease in children under 5 years of age.
Although there are many indications that surface
and drinking water pollution problems con-
tribute to serious health impacts, the lack of
monitoring data on specific pollutants and data
on household behavior regarding avoiding expo-
sure to polluted drinking water make it difficult
to quantify all of the health effects of water pol-
lution. Specifically, the lack of exposure data
makes quantifying the relationship between
chemical and inorganic pollution and the inci-
dence of chronic diseases almost impossible. Pre-
liminary estimates suggest that about 11 percent
of cases of cancer of the digestive system may be
attributable to polluted drinking water. More
EXECUTIVE SUMMARY
CHINA–ENVIRONMENTAL COST OF POLLUTION
xiv
Counties with no shading were
categorized as 'Urban' or
'Urban
Center with Rural
Surroundings', which account
Rural HH NTW by County
0 - 3458
3459 - 7800
7801 - 13574
13575 - 21886
21887 - 41341
Incidence of Diarrhea by Province
0 - 72,061
72,062 - 208,769
208,770 - 393,469
393,470 - 633,312
633,313 - 893,222
FIGURE 3. Rural Households with No Access to Piped Water & Diarrhea Incidence
attention, however, needs to be given at the pol-
icy level to reinforcing the surveillance capacity
for chronic exposures and disease incidence.
Health is Highly Valued
by the People in China
The mortality valuation surveys conducted in
Shanghai and Chongqing as part of this study
suggest that people in China value improve-
ments in health beyond productivity gains. The
value of a statistical life estimated in these
surveys—the sum of people’s willingness to pay
for mortality risk reductions that sum to one sta-
tistical life—is approximately 1 million yuan.
This number supports results of other studies,
which suggest that the value of an avoided death
is greater than what is implied by the adjusted
human capital approach, which is approximately
280,000 Yuan in urban areas. Evaluation of the
health losses due to ambient air pollution using
willingness-to-pay measures raises the cost to
3.8 percent of GDP.
It is remarkable that the willingness to pay is
about the same in locations as different as
Shanghai and Chongqing, which differ greatly
in per capita GDP with a ratio as high as 5:1.
(However, sample per capita incomes showed a
more modest ratio of 2:1.) Furthermore, these
new findings illustrate that the urban Chinese
population has a willingness to pay to reduce
mortality risk comparable in PPP terms to the
levels seen in several developed countries with
much higher per capita incomes. This means
that the Chinese people highly value their health
status and their longevity.
China’s Poor Are
Disproportionately Affected by
Environmental Health Burdens
Although the objective of this study was not to
compare the impacts of air and water pollution
on the poor versus the non-poor, the findings
suggest that environmental pollution falls dis-
proportionately on the less economically ad-
vanced parts of China, which have a higher share
of poor populations. As shown in Figure 1,
Ningxia, Xinjiang, Inner Mongolia, and other
low-income provinces are more affected by air
pollution on a per capita basis than high-income
provinces such as Guangdong and other
provinces in the southeast.
From another perspective, analysis of the
2003 National Health Survey showed that
75 percent of low-income households in rural
China with children under 5 years of age have no
access to piped water, compared to 47 percent in
the higher-income categories. This implies that
low-income households rely more on other
drinking water sources. In fact, about 32 percent
of households within the lowest income quartile
rely primarily on surface water as their primary
source of drinking water, compared to 11 per-
cent in the highest income quintile. This
means that the rural poor are at a substantially
higher risk from surface water pollution than
the non-poor.
The fact that water quality in the North is
worse than in the South may explain the slightly
higher diarrheal prevalence seen in lower income
groups in northern China (2.1 percent) com-
pared to southern China (1.9 percent). How-
ever, when focusing on differences between
income groups in the North, the data clearly
show that the poor (lowest income quartile) have
a much higher diarrheal prevalence (2.4 percent)
in households using surface water compared to
the highest income groups, where no diarrhea
cases have been recorded.
Pollution Exacerbates Water
Scarcity, Costing
147 Billion Yuan a Year
Water scarcity is a chronic problem, especially in
the North. It is closely related to problems of
water pollution. Surface water pollution has put
pressure on the use of groundwater for agricul-
tural and industrial purposes. The depletion of
EXECUTIVE SUMMARY
CHINA–ENVIRONMENTAL COST OF POLLUTION
xv
nonrechargeable groundwater in deep freshwater
aquifers imposes an environmental cost, since it
depletes a nonrenewable resource and increases
future costs of pumping groundwater. It can also
lead to seawater intrusion and land subsidence.
Estimates of the cost of groundwater deple-
tion suggest that it is on the order of 50 billion
yuan per year, while estimates of the costs of
using polluted water to industry are comparable
in magnitude, bringing the overall cost of water
scarcity associated with water pollution to
147 billion yuan, or about 1 percent of GDP.
These new findings indicate that the effects of
water pollution on water scarcity are much more
severe than previous studies have estimated.
Air and Water Pollution
Cause Significant Crop
and Material Damage
This study makes clear that the impacts of air
and water pollution on health are severe in both
absolute and in economic value terms. Although
we acknowledge that not all non-health-related
impacts can be quantified, the impacts of pollu-
tion on natural resources (agriculture, fish and
forests) and manmade structures (e.g. buildings)
are estimated to account for substantially lower
damages in economic terms.
Acid Rain costs 30 billion yuan in crop damage
and 7 billion in material damage annually. It is
EXECUTIVE SUMMARY
CHINA–ENVIRONMENTAL COST OF POLLUTION
xvi
The sum of groundwater depletion and polluted water supply (in 100 million cubic meters)
0 - 10
10 - 20
20 - 30
30 - 50
>50
N
EW
S
FIGURE 4. Groundwater Depletion and Polluted Water Supply
Ground Water Depletion
& Polluted Water Supply, 2003
estimated that acid rain, caused mainly by
increased SO
2
emissions due to increased fos-
sil fuel use—causes over 30 billion yuan in dam-
ages to crops, primarily vegetable crops (about
80 percent of the losses). This amounts to
1.8 percent of the value of agricultural output.
Damage to building materials in the South
imposed a cost of 7 billion yuan on the Chinese
economy in 2003. In addition to the human
health effects reported above, these damages pro-
vide an additional impetus for controlling SO
2
.
Damages to forests could not be quantified due
to lack of monitoring data in remote areas and
adequate dose-response functions.
Six provinces account for 50 percent of acid rain
effects. The burden of damages from acid rain
is also unevenly distributed. Over half of the
estimated damages to buildings occur in three
provinces: Guangdong (24 percent), Zhejiang
(16 percent), and Jiangsu (16 percent). Almost half
of the acid rain damage to crops occurs in three
provinces: Hebei (21 percent), Hunan (12 per-
cent), and Shandong (11 percent). However, the
impacts of acid rain extend across international
boundaries and also affect neighboring countries.
Irrigation with polluted water costs 7 billion
yuan per year. This study has quantified part of
the damage caused by the use of polluted water
for irrigation in agriculture and a portion of the
impact of water pollution on fisheries. The
impact of irrigating with polluted water in desig-
nated wastewater irrigation zones—considering
only the impact on yields and produce quality,
but not on human health—was estimated to
reach 7 billion yuan in 2003.
The cost to fisheries is estimated at 4 billion
yuan. The impact of acute water pollution inci-
dents on commercial fisheries is estimated at
approximately 4 billion yuan for 2003. The
impact of chronic water pollution on fisheries
could not be estimated for lack of exposure data
as well as adequate dose-response information.
Air Pollution Poses a Large Health Risk in
Urban Areas and Water Pollution a Significant
Health Risk in Rural Areas
The figures presented in the summary table at
the end of this chapter suggest that outdoor air
pollution poses a very serious problem in urban
areas. This is not surprising when one compares
the levels of ambient PM
10
in Chinese cities with
other large cities across the world. With annual
average PM
10
concentrations of over 100Ìg/m
3
,
several selected cities in both northern and
southern China are among the most polluted
cities in the world (see figure 5).
Although the health damages associated with
water pollution are smaller, in total, and as a per-
cent of rural GDP, they are still 0.3 percent of
rural GDP if conservatively valued and 1.9 per-
cent of rural GDP when valued using a 1 million
yuan VSL. Both figures ignore the morbidity
associated with cancer and therefore underesti-
mate the health costs associated with water pol-
lution. However, relative to other developing
countries, China’s diarrheal prevalence in rural
areas is quite low, actually lower than in coun-
tries where a larger percentage of the rural pop-
ulation has access to piped water supply (see
figure 6).
The Benefits of Sound Policy
Interventions May Exceed the Costs
This study report shows that the total cost of air
and water pollution in China in 2003 was 362
billion yuan, or about 2.68 percent of GDP for
the same year. However, it should be noted that
this figure reflects the use of the adjusted human
capital approach, which is widely used in Chi-
nese literature, to value health damages. If the
adjusted human capital approach is replaced by
the value of a statistical life (VSL) based on stud-
ies conducted in Shanghai and Chongqing, the
amount goes up to about 781 billion yuan, or
about 5.78 percent of GDP.
Setting priorities for cost-effective interventions.
Interventions to improve the environment in
China are likely to yield positive net benefits.
Indeed, one of the advantages of the environ-
EXECUTIVE SUMMARY
CHINA–ENVIRONMENTAL COST OF POLLUTION
xvii
mental cost model developed in this project is
that it can be used to evaluate the benefits of
specific pollution-control policies and assist in
designing and selecting appropriate targeted
intervention policies. Once the impact on
ambient air quality of a policy to reduce partic-
ulate emissions has been calculated, the tools
used to calculate the health damages associated
with particulate emissions can be used to com-
pute the benefits of reducing them. To illus-
trate, researchers have examined the costs and
impacts on ambient air quality of measures to
control SO
2
emissions and fine particles in
Shijiazhuang, the capital of Hebei Province
(Guttikunda et al. 2003). The monetized value
of the health benefits associated with each mea-
sure could be calculated, using the techniques
developed in this study, and compared with the
costs.
Targeting high-risk areas. The findings from
this project suggest that a focus on northern
China is essential, particularly the North China
Plain and areas located northeast and northwest
of the plain, where the study shows that there is
a double burden from both air and water pollu-
tion. This problem is further magnified by the
presence of disparities between the poor and
non-poor. On this basis, it seems relevant that
stronger policy interventions should be de-
veloped to address air and water pollution
problems. In addition, these efforts should be
complemented with emphasis on improving
EXECUTIVE SUMMARY
CHINA–ENVIRONMENTAL COST OF POLLUTION
xviii
FIGURE 5. Annual average PM10 concentrations observed in selected cities worldwide, 2004, 2005
Source: China Environmental Yearbook 2005 and WHO 2005.
access to clean water, with a specific focus on the
lowest income groups.
Responding to people’s concerns. This study
suggests that the Chinese value the avoidance of
health risks beyond productivity gains. This
implies that people’s preference for a clean envi-
ronment and reduced health risks associated
with pollution are stronger than past policies
appear to have acknowledged. Growing con-
cerns about the impacts of pollution are increas-
ingly expected to guide national policies as well
as local actions. Public disclosure of envi-
ronmental information such as emissions by
polluting enterprises, as well as ambient envi-
ronmental quality data by local authorities,
could be an important tool for responding to
people’s concerns and creating incentives for
improving local conditions.
Addressing the information gap. Past policies
and decisions have been made in the absence of
concrete knowledge of the environmental im-
pacts and costs. By providing new, quantitative
information based on Chinese research under
Chinese conditions, this study has aimed to
reduce this information gap. At the same time,
it has pointed out that substantially more infor-
mation is needed in order to understand the
health and non-health consequences of pollu-
tion, particularly in the water sector. It is criti-
cally important that existing water, health, and
environmental data be made publicly available
so the fullest use can be made of them. This
would facilitate conducting studies on the
impacts of water pollution on human and ani-
mal health. Furthermore, surveillance capacity at
the local and national levels needs to be
expanded to improve the collection of environ-
mental data, especially data on drinking water
quality. These efforts will further improve the
analysis begun in this project.
EXECUTIVE SUMMARY
CHINA–ENVIRONMENTAL COST OF POLLUTION
xix
0
10
20
30
40
50
60
70
80
90
100
Cambodia 2000
Mozambique 2003
Indonesia 2002/2003
Ghana 2003
Mad
agascar 20
03/
200
4
Keny
a 2003
Mor
occ
o 2003-2004
China 2003
Philippines 2003
Peru
20
00
Bolivia 2003
Colombia 200
5
Egypt 2000
Jordan 2002
Percentage of rural households w/ no piped water
Piped water Diarrhea Prevalence last 2 weeks
Figure 6. Diarrheal Prevalence and Access to Piped Water Supply
Source: ORC Macro, 2006. MEASURE DHS STATcompiler. , July 3 2006.
Developing an environmental-health action
plan. At present, an environmental-health action
plan is being jointly drafted by the State Envi-
ronmental Protection Administration (SEPA)
and the Ministry of Health (MoH). This plan
should take into consideration the mortality and
morbidity impacts from water and air pollution
presented in this report. The plan should include
a focus on the geographical areas identified in
northern China, where there is a double burden
of both air and water pollution. Furthermore,
particular focus should be put on areas where
poor populations are adversely affected from
lack of access to clean water and sanitation.
EXECUTIVE SUMMARY
CHINA–ENVIRONMENTAL COST OF POLLUTION
xx
1
ⅷ
CHINA–ENVIRONMENTAL COST OF POLLUTION
1
AIR AND WATER
POLLUTION IN CHINA
In the last 25 years, China has
achieved rapid economic growth,
industrialization, and urbanization,
with annual increases in GDP of
8 to 9 percent. During the same
period, advances in technology
and economic efficiency, coupled
with pollution control policies, have
positively affected air and water
pollution loads. However, great
challenges remain in further
improving China’s environmental
status.
To illustrate, China has not been able to meet 10 of its 13 critical 10th five-
year-plan targets for air and water pollution control (see table 1.1). The most
pressing off-target performance is the drastic increase in industrial-based SO
2
emissions, which has reversed the downward trend in SO
2
levels, and
degraded air quality and the increase in domestic COD loads, which have
caused water quality to deteriorate.
China is the world’s second largest energy consumer after the United
States. Almost 68 percent of its energy comes from coal, much of which is
Overview
1
ⅷ
TABLE 1.1 Environmental Targets for the 10th Five Year Plan vs.
Environmental Performance (million tons)
Actual 2005 Comparison
Actual Planned (completed by with Planned
Indicators 2000 2005 6/17/06) 2005 (+/− %)
Air Pollution
SO
2
emissions 19.9 17.9 25.5 42
Industry 16.1 14.5 21.7 50
Domestic 3.8 3.5 3.8 9
Soot Emissions 11.7 10.6 11.8 11
Industry 9.5 8.5 9.5 12
Domestic 2.1 2.1 2.3 10
Industrial Dust Emissions 10.9 8.98 9.1 1
Water Pollution
COD discharge 14.5 13.0 14.1 8
Industry 7.0 6.7 5.5 −18
Domestic 7.4 6.5 8.6 32
Ammonia Nitrogen 1.8 1.65 1.5 −9
Industry 0.8 0.7 0.525 −25
Domestic 1.1 0.9 0.973 8
Source: Estimations based upon China Environmental Yearbook 2001 and 2006, the
10th Five Year Plan for Environmental Protection and status of the China environment
report, 2005
burned in thermal power plants or in industrial
boilers. This has led to continuously high levels
of SO
2
and particulate air pollution. In addition,
water pollution and water scarcity problems are
also very severe, particularly in North China,
where the region faces some of the most severe
water quality and quantity challenges in the world
today. This section provides a brief overview of
these challenges.
Air Pollution Trends
Although levels of SO
2
and particulates have
declined since the 1980s, China’s cities still rank
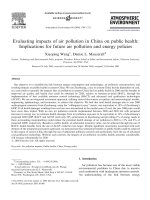
among the most polluted in the world. Figure 1.1
shows trends in annual average total suspended
particulates (TSP, SO
2
, and NOx in large and
medium-sized Chinese cities, beginning in
1980). (The averages in each year are arithmetic
averages—unweighted by population—of avail-
able readings for “major cities.” The set of cities
varies from 53 to 97, depending on the year.) Sep-
arate averages are reported for northern and
southern cities. Suspended particulate levels are
higher in northern cities, due in part to industrial
activity, but also to geographic and meteorologi-
cal conditions that make these cities more vulner-
able to particulate pollution than cities in the
south of China, holding emissions constant
(Pandey et al. 2005). In both northern and south-
ern cities, particulate concentrations show a
downward trend from 1980 until the early 1990s
and then remain relatively flat. Sulfur dioxide and
NOx concentrations also show a downward trend
OVERVIEW
CHINA–ENVIRONMENTAL COST OF POLLUTION
2
0
100
200
300
400
500
600
1980
1982
1984
1986
1988
1990
1992
1994
1996
1998
2000
2002
2004
μ
g/m
3
Average of Southern Cities
Average of Northern Cities
Annual Average Standard
24-hour Average Standar
Average
Vertical bars indicate ranges of values for all cities; the highest
horizontal mark shows the most polluted of the Chinese cities.
[1] In the Nitrogen Oxides chart, data for 2001 and 2004 are for NO
2
.
Sulfur Dioxide (µg/m
3
)
Total Suspended Particulates (µg/m
3
) Nitrogen Oxides
[1]
(µg/m
3
)
0
500
1,000
1,500
2,000
2,500
3,000
1980
1982
1984
1986
1988
1990
1992
1994
1996
1998
2000
2002
2004
μ
gm
3
0
50
100
150
200
250
1980
1983
1986
1989
1992
1995
1998
2001
2004
μ
gm
3
Source: China Environmental Year Books 2004 & 2005
FIGURE 1.1 Ambient Air Pollution Levels in China’s Major Cities (annual averages) Compared to Chinese
Class II Air Quality Standards