Climate Risks and Adaptation in Asian Coastal Megacities ppt
Bạn đang xem bản rút gọn của tài liệu. Xem và tải ngay bản đầy đủ của tài liệu tại đây (4.36 MB, 120 trang )
Climate Risks and Adaptation in Asian Coastal Megacities
Climate Risks and
Adaptation
in Asian
Coastal Megacities
A
SYNTHESIS
REPORT
Japan International Cooperation Agency
Contact: Megumi Muto,
Asian Development Bank
Contact: Jay Roop,
THE WORLD BANK
1818 H Street, NW
Washington, DC 20344
Telephone: 202.473.1000
Internet: www.worldbank.org
E-mail:
Contacts:
Poonam Pillai,
Jan Bojo,
Maria Sarraf and Susmita Dasgupta, , Climate Risks and Adaptation in
Asian Coastal Megacities
A Synthesis Report
© 2010 The International Bank for Reconstruction
and Development / THE WORLD BANK
1818 H Street, NW
Washington, DC 20433, U.S.A.
Telephone: 202-473-1000
Internet: www.worldbank.org/climatechange
E-mail:
All rights reserved.
September 2010
This volume is a product of the staff of the International Bank for Reconstruction and Development / The World Bank. The findings, interpretations, and
conclusions expressed in this volume do not necessarily reflect the views of the Executive Directors of The World Bank or the governments they represent.
The World Bank does not guarantee the accuracy of the data included in this work. The boundaries, colors, denominations, and other information shown
on any map in this work do not imply any judgement on the part of the World Bank concerning the legal status of any territory or the endorsement or
acceptance of such boundaries.
R I G H T S A N D P E R M I S S I O N S
The material in this publication is copyrighted. Copying and/or transmitting portions or all of this work without permission may be a violation of applica-
ble law. The International Bank for Reconstruction and Development / The World Bank encourages dissemination of its work and will normally grant
permission to reproduce portions of the work promptly.
For permission to photocopy or reprint any part of this work, please send a request with complete information to the Copyright Clearance Center Inc.,
222 Rosewood Drive, Danvers, MA 01923, USA; telephone 978-750-8400; fax 978-750-4470; Internet: www.copyright.com.
Cover images:
Large image: Ho Chi Minh City, © Karen Kasmauski/Corbis
Small images: top: Manila, © Francis R. Malasig/Corbis; middle: Bangkok, © I. Saxar/Shutterstock Images, LLC; bottom: Kolkata, © Bruce Burkhardt/
Corbis
All dollars are U.S. dollars unless otherwise indicated.
iiiiii
Table of Contents
Acknowledgments vii
Abbreviations and Acronyms ix
Executive Summary xi
1. Introduction 1
Background and Rationale 1
Objective 2
Process of Preparation 3
Overview of Methodology/Approach and Climate Parameters Selected 3
Structure of the Report 4
2. Methodologies for Downscaling, Hydrological Mapping, and
Assessing Damage Costs 5
Selection of Emissions Scenarios, Downscaling, and Uncertainties 5
Hydrological Modeling for Developing Scenarios of Flood Risk 9
Approach to Assessing Damage Costs 12
Assessment of Damage Costs in the HCMC Study 17
Assumptions about the Future of Cities in Estimating Damage Costs 19
Conclusion: Methodological Limitations and Uncertainties in Interpreting Results
of the Study 20
3. Estimating Flood Impacts and Vulnerabilities in Coastal Cities 23
Estimating Future Climate-related Impacts in Bangkok 23
Main Findings from Hydrological Analysis and GIS Mapping for Bangkok 28
Estimating Climate-related Impacts in Manila 31
Findings from the Hydrological Analysis and GIS Mapping for Metro Manila 35
Estimating Climate-related Impacts in Ho Chi Minh City, Vietnam 38
Main Findings from Hydrological Analysis and GIS Mapping for HCMC 44
Conclusion 50
4. Assessing Damage Costs and Prioritizing Adaptation Options 51
Bangkok: Analysis of Damage Costs Related to Flooding in 2008 and 2050 51
Prioritization of Adaptation Options in Bangkok 56
Analysis of Damage Costs Related to Flooding in Metro Manila 60
Prioritization of Adaptation Options in Manila 65
Analysis of Damage Costs in HCMC 69
Analysis of Adaptation in HCMC 72
Conclusion 73
iv
|
Climate Risks and Adaptation in Asian Coastal Megacities: A Synthesis Report
5. Conclusions and Policy Implications 75
Key Findings and Lessons for Policy Makers 75
Lessons on Methodology for Follow-up Studies 78
Bibliography 81
Annexes
A. Vulnerability of Kolkata Metropolitan Area to increased Precipitation in
a Changing Climate 85
B. Scenarios Applied in the Hydrodynamic Modeling in the HCMC study 91
C. Adaptation to Increased Flooding: Brief Overview 93
D. Comparison of Costs across Cities 97
Figures
Figure 1.1 Asian Megacity Hotspots 2
Figure 2.1 Hydrometeorological Model Schematic for Chao Phraya Watershed 11
Figure 2.2 Manila Rainfall-Runoff Calibration Hydrographs 12
Figure 2.3 Estimation of Damage to Buildings, Assets, and Inventories in the Bangkok
and Manila Cases 14
Figure 2.3 Estimating Impacts—A Flow Chart 13
Figure 2.5 Possible Relationships between Flood Duration and Land Value Loss 18
Figure 3.1 Location of Bangkok in the Chao Praya River Basin 23
Figure 3.2 Land Elevations, 2002 versus 2050 Land Subsidence 28
Figure 3.3 Maximum Water Depth for 1-in-30-year event, 2008 and 2050, A1FI 29
Figure 3.4 Bangkok Flood Hazard Relationship 29
Figure 3.5a Affected Condensed (Poor) Community of Case C2008-T30 31
Figure 3.5b Affected Condensed (Poor) Community of Case C2050-LS-SR-SS-A1FI-T30 31
Figure 3.6 Metro Manila and its Watershed 32
Figure 3.7 Different Climatic Regimes in the Philippines 33
Figure 3.8 Major Watershed and Drainage Areas of Manila 34
Figure 3.9 Comparison of Population Affected by Flooding under Different Scenarios 36
Figure 3.10 Areas of High Population Density and with High Risk of Inundation under
A1FI Scenario 37
Figure 3.11 Areas at High Risk from Flooding under Different Scenarios 37
Figure 3.12 HCMC: Frequently Flooded Areas under Current Conditions 40
Figure 3.13a HCMCCity Case Study: Comparison of 1-in-30-year Flood for 2008 45
Figure 3.13b HCMCCity Case Study: Comparison of 1-in-30-year Flood for 2050 A2 Scenario 45
Figure 3.14a HCMC Poverty Rates by District 48
Figure 3.14b Districts Vulnerable to Flooding 48
Figure 3.15 Impact on Waste Management Sector 49
Figure 3.16 HCMC 2050 A2 1-in-30-year Flood Inundation Overlaid on Projected Land
Use Patterns 49
Figure 3.17 HCMC Droughts and Salinity Intrusion in 2050 50
Figure 4.1 Damage Cost Associated with a 1-in-30-year Flood (C2050-LS-SR-SS-A1FI-T30) 52
Figure 4.2 Loss Exceedance Curves, Bangkok 52
Figure 4.3 Maximum Inundation Area Without and With the Proposed Adaptation 58
Figure 4.4 Flood Costs under Three Return Periods and Two Climate Scenarios (PHP) 60
Figure 4.5 Loss Exceedance Curves for Manila (PHP) 63
Table of Contents
|
v
Figure 4.6 Damage Costs Associated with Different Scenarios (PHP) 63
Figure 4.7 Damages to Buildings from a 1-in-30-year Flood (2008 PHP) 63
Figure 4.8 Flood Costs as a Percent of 2008 GDP 65
Figure 4.9 Annual Benefits from Adaptation Investments in Metro Manila 68
Boxes
Box 2.1 Strengths and Limitations of Different Downscaling Techniques Selected for this Study 7
Box 2.2 Downscaling from 16 GCMs 8
Box 2.3 Some Basic Principles for Hydrological Mapping 11
Box 3.1 The Bangkok Metropolitan Region (BMR): Some Assumptions about the Future 26
Box 3.2 What does Metro Manila Look Like in the Future? 35
Box 3.3 HCMC in 2050 41
Box 3.4 Overview of Downscaling and Hydrological Analysis Carried out for HCMC Study 42
Box 4.1 Examining Building Damages, Income Losses, and Health Costs in Bangkok 55
Box 4.2 Expected Annual Benefits from Adaptation in Bangkok 58
Box 4.3 Increased Time Costs and Health Risk from Flooding in Manila 65
Box 4.4 Rough Estimate of Viability of Proposed Flood Control Measures 72
Tables
Table 2.1 Climate Change Forecasts for 2050 8
Table 2.2 Summary of City Case Study Hydrologic Modeling 11
Table 2.3 Direct and Indirect Costs from Flooding 13
Table 2.4 Flood Damage Rate by Type of Building in Manila 15
Table 3.1 Poverty Line and the Poor in the BMR1 24
Table 3.2 Bangkok Monthly Average Temperature and Precipitation 25
Table 3.3 Climate Change and Land Subsidence Parameter Summary for Bangkok 27
Table 3.4 Bangkok Inundated Area under Current Conditions and Future Scenarios 28
Table 3.5 Exposure of Bangkok Population to Flooding 30
Table 3.6 Manila: Monthly Average Temperature and Precipitation 33
Table 3.7 Manila Climate Change Parameters 35
Table 3.8 Manila: Comparison of Inundated Area (km
2
) with 1-in-100-year flood for
2008 and 2050 Climate Change Scenarios with only Existing Infrastructure and
with Completion of 1990 Master Plan 36
Table 3.9 Affected Length of Road by Inundation Depth 38
Table 3.10 HCMC District Poverty Rates. 2003 39
Table 3.11 Ho Chi Minh City: Monthly Average Temperature and Precipitation 40
Table 3.12 Climate Change Parameter Summary for HCMC 44
Table 3.13 Summary of Flooding at Present and in 2050 with Climate Change 44
Table 3.14 District Population Affected by an Extreme Event in 2050 46
Table 3.15 Districts Affected by Flooding in Base Year and in 2050 47
Table 3.16 Effects of Flooding on Future Land Use under 2050 A2 Extreme Event 49
Table 4.1 Summary of Damages Assessed in the Bangkok Study 51
Table 4.2 Summary of Flood and Storm Damages, Bangkok (million 2008 THB) 53
Table 4.3 Changes in Income Losses to Wage Earners, Commerce, and Industry 55
Table 4.4 Damage Costs in Bangkok and Regional GRDP 56
Table 4.5 Investment Costs for Adaptation Projects in Bangkok (million THB) 57
Table 4.6 Flood Damage Costs With and Without a 30-year Return Period Flood Protection
Project (million THB) 59
vi
|
Climate Risks and Adaptation in Asian Coastal Megacities: A Synthesis Report
Table 4.7 Net Present Value of Adaptation Measures to Provide Protection Against
a 1-in-30 and 1-in-10-year Flood (million THB) 59
Table 4.8 Flood Damage Costs in Manila (2008 PHP) 61
Table 4.9 Income and Revenue Losses to Individuals and Firms Associated with Floods
(2008 PHP) 64
Table 4.10 Damage Costs from 1-in-10, 1-in-30, and 1-in-100-year Floods in Different Scenarios
(2008 PHP) 65
Table 4.11 Adaptation Investments Considered for Different Return Periods and
Climate Scenarios 67
Table 4.12 Investment Costs and Net Present Value of Benefits Associated with Different
Flood Control Projects in Manila (PHP) using a 15 percent discount rate 67
Table 4.13 Expected Cost of Flooding based on Quadratic Relationship between Duration
of Flooding and Land Values in HCMC 70
Table 4.14 Present Value of the Cost of Floods up to 2050 using the GDP Estimation Method 71
Table 4.15 Summary of Present Value of Climate Change Costs in HCMC (USD) 72
Table 4.16 Proposed Implementation Arrangements for HCMC 74
vii
Acknowledgments
T
his synthesis report is a product of a joint pro-
gram on Climate Adaptation in Asian Coastal
Megacities undertaken by the World Bank in
collaboration with the Asian Development Bank
and the Japan International Cooperation Agency. It
is based on extensive collaboration among the three
agencies, who jointly agreed to undertake several
city-level studies and prepare a synthesis report.
The core team preparing this synthesis report
consisted of Poonam Pillai (Sr. Environmental Spe-
cialist and task team leader), Bradford Ryan Philips
(Sr. Civil Engineer, consultant), Priya Shyamsundar
(Sr. Environmental Economist, consultant), Kazi
Ahmed (consultant) and Limin Wang (Sr. Envi-
ronmental Economist, consultant) and included
extensive collaboration with the different city-level
teams. In particular, we would like to thank Jan
Bojo (World Bank), who led the Bangkok study;
Megumi Muto (JICA), who led the Manila study
and was the main focal point from JICA; Jay Roop
(ADB), who led the Ho Chi Minh City study and was
the main focal point from ADB, and Maria Sarraf
and Susmita Dasgupta (World Bank), who led the
Kolkata study. For the Bangkok report, we are also
grateful to the team at Panya consultants; to Bang-
kok Metropolitan Administration professionals;
and to Manuel Cocco, Pongtip Puvacharoen, and
Yabei Zhang. For the HCMC study, we thank the
consulting team at the International Centre for En-
vironmental Management, including Jeremy Carew-
Reid, Anond Snidvongs, Peter-John Meynell, John
Edmund Sawdon, Nigel Peter Hayball, Tran Thi Ut,
Tranh Thanh Cong, Nguyen Thi Nga, Nguyen Le
Ninh, Nguyen Huu Nhan, and Nguyen Dinh Tho;
the Ho Chi Minh City People’s Committee; and the
Department of Natural Resources and Environment
(DoNRE). For the Manila study, we are grateful to
the Metro Manila Development Authority, National
Statistics Office, Professor Emma Porio and staff
at Ateneo de Manila University, CTI Engineering
International, and ALMEC Corporation, as well
as the local government officials and community
leaders who provided valuable inputs to the report.
We also gratefully acknowledge the contributions
of Professor Akimasa Sumi (University of Tokyo),
Professor Nobuo Mimura (Ibaraki Universty),
and Dr. Masahiro Sugiyama (Central Research
Institute of Electric Power Industry) for providing
the analytic framework for downscaling the IPCC
climate models. We thank the Kolkata team and
in particular Subhendu Roy and the INRM team
for their inputs and collaboration, and to Adriana
Damianova for initially leading the Kolkata study.
Suggestions from Ian Noble also helped strengthen
the analysis. We are especially grateful to Daniel
Hoornweg, Anthony Bigio, and Tapas Paul for peer
reviewing this report.
A special thanks to James Warren Evans (Direc-
tor, Environment Department, World Bank), Magda
Lovei, (Sector Manager, EASER, World Bank), Neeraj
Prasad (Lead Carbon Finance Specialist, ENVCF),
Megumi Muto (Research Fellow, JICA) and Jay Roop
(Environmental Specialist, ADB) for initiating this
collaborative activity and to Kseniya Lvovsky (Pro-
gram Manager, Climate Change team, Environment
Department), Michele De Nevers (Senior Manager,
Environment Department, World Bank), Gajanand
Pathmanathan (Manager, SASDO and Acting Sector
Manager, SASDI), Nessim Ahmad (Director, Environ-
ment and Safeguards, Asian Development Bank), Dr
Keiichi Tsunekawa (Director, JICA Research Institute)
and Mr. Hiroto Arakawa (Senior Special Advisor,
JICA) under whose general guidance this report
was prepared. Thanks to Perpetual Boetang for her
viii
|
Climate Risks and Adaptation in Asian Coastal Megacities: A Synthesis Report
assistance with formatting the report, to Robert Liv-
ernash for editing, and to Jim Cantrell for managing
production of the publication. Finally, we thank the
governments of Norway and Finland for their finan-
cial support for the preparation of this report through
the Trust Fund for Environmentally and Socially
Sustainable Development and the Norwegian Trust
Fund for Private Sector and Infrastructure.
ix
Abbreviations and Acronyms
ADB Asian Development Bank
AOGCM Atmosphere-ocean general circulation
models
BMR Bangkok Metropolitan Region
BAU Business as usual
CCA Climate change adaptation
CoP Conferences of Parties
DIVA Dynamic interactive vulnerability
assessment
DRR Disaster risk reduction
ECLAC Economic Commission for Latin
America and the Caribbean
GCMs Global climate models
GDP Gross domestic product
GEF Global Environment Facility
GHG Greenhouse gas
GPCP Global Precipitation Climatology
Project
GRDP Gross regional domestic product
HCMC Ho Chi Minh City
1DD One-degree daily
IPCC Intergovernmental Panel for Climate
Change
IRS3 Integrated research system for
sustainability science
IZ Industrial zones
JICA Japan International Cooperation
Agency
LGUs Local government units
MONRE Ministry of Natural Resources and
Environment
MP Master plan
NESDB National Economic and Social
Development Board
PC People’s Committee
PCMDI Program for Climate Model Diagnosis
and Intercomparison
SRES Special Report on Emissions Scenarios
UNDP United Nations Development Program
UNFCCC United Nations Framework
Convention on Climate Change
VOC Vehicle operations cost
WCRP World Climate Research Program
WGCM Working Group on Coupled Modeling
Note: Unless otherwise noted, all dollars are U.S. dollars.
xi
study on the economics of adaptation to climate
change, which estimates that the cost of adaptation
to climate change is likely to be the highest in this
region (World Bank 2010). In flood-prone cities such
as Ho Chi Minh City, Kolkata, Dhaka, and Manila,
potential sea level rise and increased frequency and
intensity of extreme weather events poses enormous
adaptation challenges. The urban poor—often living
in riskier urban environments such as floodplains or
unstable slopes, working in the informal economy,
and with fewer assets—are most at risk from expo-
sure to hazards (Satterthwaite et al. 2007).
Despite its importance, few developing country
cities have attempted to address climate change sys-
tematically as part of their decision-making process.
Given the risks faced by coastal cities and the impor-
tance of cities more broadly as drivers of regional
economic growth, adaptation must become a core
element of long-term urban planning. The Mayor’s
Summit in Copenhagen in December 2009—and
follow-on efforts to institutionalize a Mayor’s Task
Force on Urban Poverty and Climate Change—sig-
nify much-needed attention to this issue.
In response to client demand and recognizing
the importance of addressing urban adaptation
and major vulnerabilities of Asian coastal cities, the
Asian Development Bank (ADB), the Japan Interna-
tional Cooperation Agency (JICA), and the World
Bank agreed to undertake an analysis in several
coastal megacities to address climate adaptation
and prepare a synthesis report based on the city-
level findings. The selected cities included Manila
(led by JICA), Ho Chi Minh City (led by ADB), and
Bangkok (led by the World Bank).
1
INTRODUCTION AND RATIONALE
Coastal areas in both developing and more industri-
alized economies face a range of risks related to cli-
mate change and variability (IPCC 2007a). Potential
risks include accelerated sea level rise, increase in sea
surface temperatures, intensification of tropical and
extra tropical cyclones, extreme waves and storm
surges, altered precipitation and runoff, and ocean
acidification (Nicholls et al. 2007). The Intergovern-
mental Panel for Climate Change Fourth Assessment
Report (IPCC 2007a) points to a range of outcomes
under different scenarios. It identifies a number of
hotspots—including heavily urbanized areas situ-
ated in the low-lying deltas of Asia and Africa—as
especially vulnerable to climate-related impacts.
The number of major cities located near coast-
lines, rivers, and deltas provides an indication of the
population and assets at risk. Thirteen of the world’s
20 largest cities are located on the coast, and more
than a third of the world’s people live within 100
miles of a shoreline. Low-lying coastal areas repre-
sent 2 percent of the world’s land area, but contain
13 percent of the urban population (McGranahan et
al. 2007). A recent study of 136 port cities showed
that much of the increase in exposure of population
and assets to coastal flooding is likely to be in cities
in developing countries, especially in East and South
Asia (Nicholls et al. 2008).
In terms of population exposed to coastal flood-
ing, for example, in 2005 five of the ten most popu-
lous cities included Mumbai, Guangzhou, Shanghai,
Ho Chi Minh City, and Kolkata (formerly Calcutta).
By 2070, nine of the top ten cities in terms of popula-
tion exposure are expected to be in Asian developing
countries (Nicholls et al. 2008). The vulnerability of
the East Asia region is also highlighted by the global
Executive Summary
1
Kolkata is also one of the selected cities but is not included
in the synthesis report as it was ongoing at the time of the prep-
aration of this report. A brief overview is included in Annex A.
xii
|
Climate Risks and Adaptation in Asian Coastal Megacities: A Synthesis Report
using case studies of three cities that are different
in their climate, hydrological, and socioeconomic
characteristics. Specifically, it draws on an in-depth
analysis of climate risks and impacts in Bangkok,
Manila, and Ho Chi Minh City to highlight to na-
tional and municipal decision makers (a) the scale
of climate-related impacts and vulnerabilities at
the city level, (b) estimates of associated damage
costs, and (c) potential adaptation options. While
the report focuses on three cities in East Asia, the
policy implications resulting from the comparative
analysis of these cities has broader relevance for
assessing climate risks and identifying adaptation
options in other coastal areas.
APPROACH AND METHODOLOGY
The approach to assessing climate risks and im-
pacts consists of the following sequential steps: (1)
determining climate variables at the level of the
city/watershed through downscaling techniques;
(2) estimating impacts and vulnerability through
hydrometeorological modeling, scenario analysis,
and GIS mapping; and (3) preparing a damage/
loss assessment and identification/prioritization
of adaptation options.
As a first step, each of the city-level studies
considered two IPCC scenarios, a high- and a low-
emissions scenario,
4
and estimated climate risks
to 2050. The 2050 time horizon for the study is ap-
propriate given city-level planning horizons and
the typical time frame for major flood protection
measures. The downscaling analysis allowed esti-
mation of changes in temperature and precipitation
in 2050. These parameters were used as inputs to the
hydrological modeling. In addition to this, assump-
tions and estimates were also made about changes
in sea level rise and storm surge in 2050 based on
past historical data and available estimates.
Why these three cities? The three developing
country cities selected for this study are all coastal
megacities with populations (official and unofficial)
ranging from 8 to 15 million people. Two are capital
cities and all three are centers of national and regional
economic growth contributing substantially to the
GDP of the respective countries. However, being low-
lying coastal cities situated in the deltas of major river
systems in the East Asia region, all three are highly
vulnerable to climate-related risks and rank high in
recent rankings of exposure and vulnerability. Ho
Chi Minh City and Bangkok are among the top 10
cities in terms of population likely to be exposed to
coastal flooding due to climate-related risks in 2070,
according to the first global assessment of port cities
(Nicholls et al. 2008). Further, Manila has been identi-
fied as particularly vulnerable to typhoon damage,
and HCMC ranks fifth by population exposed to
the effects of climate change (Nicholls et al. 2008). A
recent study also identifies Manila, Ho Chi Minh City,
and Bangkok among the top eleven Asian megacities
that are most vulnerable to climate change (Yusuf
and Francisco 2009).
2
Devastating floods in Manila
in 2009 only confirm the vulnerability of this city to
extreme weather events. For instance, flooding in
Manila from tropical storm Ketsana in September
was the heaviest in almost 40 years, with flood waters
reaching nearly 7 meters. More than 80 percent of
the city was underwater, causing immense damage
to housing and infrastructure and displacing around
280,000–300,000 people.
3
All of this highlights the
need to better understand and prepare for such cli-
mate risks and incorporate appropriate adaptation
measures into urban planning.
While there is a growing literature on cities and
climate change, as yet there is limited research on
systematically assessing climate-related risks at the
city level. This report aims to fill this gap. Further,
it aims to provide evidence-based information to
support urban policy and planning as these issues
are debated at the local, national, and global levels.
OBJECTIVE
The main objective of this report is to strengthen
our understanding of climate-related risks and im-
pacts in coastal megacities in developing countries
2
Vulnerability in the scorecard was understood in
terms of exposure, sensitivity, and adaptive capacity of
the cities. See also />S/12324196651Mapping_Report.pdf.
3
/>philippines.floods/index.html.
4
Different scenarios were considered to assess impact due
to the uncertainties in projecting future climate conditions.
Executive Summary
|
xiii
version of the study has been presented at several
international forums.
UNCERTAINTIES, LIMITATIONS,
AND INTERPRETING THE
FINDINGS OF THIS STUDY
Any study forecasting conditions four decades
hence will be faced with large uncertainties and
these need to be borne in mind in interpreting the
results of this study. One uncertainty concerns
the pathway of GHG emissions. To address that
issue, the city case studies examined both a high
and a low GHG emissions scenario to bracket the
likely future conditions. In the climate change
downscaling methodologies, there are uncertain-
ties in forecasting the increase in extreme and
seasonal precipitation under the different sce-
narios. The techniques applied in the statistical
downscaling examined the results from sixteen
atmosphere-ocean general circulation models
(AOGCM). Robust relationships were identified
for temperature (with a ~ 10 percent internal
error) and precipitable water increases (with a ~
10–20 percent error) (Sugiyama 2008). Hydrologic
models can simulate flood events with relatively
small errors (<10 percent) if sufficient data are
available for good calibration. For future forecasts,
however, land use changes in the watersheds
and drainage areas can dramatically affect flood
patterns and can be further examined in future
sensitivity analyses.
Further, cities in 2050 are likely to be vastly
different from today’s cities. Understanding how
different is a huge task and there was no attempt
to model economic growth and link it to urban
development. Instead, assumptions about cities in
2050 were based on best available data, government
plans and projections which also introduced uncer-
tainties and errors. Despite these limitations, the
results presented in this report highlight the scale of
the likely risks and impacts facing coastal cities that
appear to be robust to the assumptions about the
climatic, spatial, and socioeconomic development
of the cities by 2050. Key findings and lessons are
summarized below.
For each city, complex hydrometeorological
models were then developed using a whole host
of local information. These included (a) climate
variables such as changes in temperature, precipi-
tation, sea level rise, and storm surge; (b) socio-
economic and developmental factors such as land
subsidence, land use, and population increases;
and (c) local topographical and hydrological
information. Flooding in the metropolitan areas
was chosen as the key variable to assess impact.
The hydrological analysis allowed determination
of the area, depth, and duration of flooding under
different scenarios. This information was used to
identify the scale of risks and vulnerability of sec-
tors, local populations, and districts (represented
in GIS maps), as well as estimate damage costs.
Two of the three studies undertook cost-benefit
analysis to prioritize adaptation options, while
the third approached the issue of adaptation more
qualitatively. To understand the impact of climate
change in 2050 in each city, an important assump-
tion made by all teams was that without climate
change, the climate in 2050 would be similar to the
2008/ base-year climate. Various climate scenarios
are overlaid on this assumption.
PROCESS OF PREPARATION
The analysis was carried out over a period of one-
and-a-half years. The synthesis team and the city-
level teams met periodically and worked closely to
develop common terms of reference to guide the
city-level studies, as well as share methodological
issues and ongoing findings. These discussions and
the analysis undertaken for each city have formed
the basis of this report. Further, each city-level
team worked with their respective country/urban
counterparts to build ownership and capacity for
the analysis. For instance, the main counterparts in
HCMC were the HCMC People’s Committee and
the Department of Natural Resources and Environ-
ment (DoNRE). The study sought to inform the
preparation of HCMC’s citywide adaptation plan.
In Bangkok, the main counterpart was the Bangkok
Municipal Authority. In Metro Manila, the main
counterpart was Metro Manila Development Au-
thority (MMDA). At the global level, a preliminary
xiv
|
Climate Risks and Adaptation in Asian Coastal Megacities: A Synthesis Report
City, and San Juan Mandaluyong City are likely to
face serious risks of flooding.
Increase in population exposed to flooding
In all three cities, there is likely to be an increase in
the number of persons exposed to flooding in 2050
under different climate scenarios compared to a situa-
tion without climate change. For instance, in Bangkok
in 2050, the number of persons affected (flooded
for more than 30 days) by a 1-in-30-year event will
rise sharply for both the low and high emission sce-
narios—by 47 percent and 75 percent respectively—
compared to those affected by floods in a situation
without climate change. In Manila, for a 1-in-100-year
flood in 2050, under the high emission scenario more
than 2.5 million people are likely to be affected (as-
suming that the infrastructure in 2050 is the same as
in the base year), and about 1.3 million people if the
1990 master plan is implemented. In HCMC, cur-
rently, about 26 percent of the population would be
affected by a 1-in-30-year event. However, by 2050,
it is estimated that approximately 62 percent of the
population will be affected under the high emission
scenario without implementation of the proposed
flood control measures. Even with the implementa-
tion of these flood control measures, more than half of
the projected 2050 population is still likely to be at risk
from flooding during extreme events. How to plan for
such large percentages of population being exposed
to future flooding needs to be seriously considered.
Costs of damage likely to be substantial and
can range from 2 to 6 percent of regional
GDP
In Bangkok, the increased costs associated with
climate change (in a high emission scenario) from
a 1-in-30-year flood is THB 49 billion ($1.5 billion),
or approximately 2 percent of GRDP. These are the
additional costs associated with climate change. The
actual costs of a 1-in-30-year flood—including costs
resulting from both climate change and land subsid-
ence—are close to $4.6 billion in 2050. In Manila, a
similar 1-in-30-year flood can lead to costs of flooding
ranging from PHP 40 billion ($0.9 billion)—given
current flood control infrastructure and climate con-
ditions—to PHP 70 billion ($1.5 billion) with similar
KEY FINDINGS
Frequency of extreme events likely to increase
All three cities are likely to witness increases in
temperature and precipitation linked with climate
change and variability. In Bangkok, temperature
increases of 1.9
°
C and 1.2
°
C for the high and low
emissions scenarios respectively are estimated for
2050 and are linked with a 3 percent and 2 percent
increase in mean seasonal precipitation respectively.
In Manila, the mean seasonal precipitation is ex-
pected to increase by 4 percent and 2.6 percent for
the high and low emissions scenarios. In HCMC,
future projections suggest greater seasonal variabil-
ity in rainfall and increasing frequency of extreme
rainfall related to storms.
Increase in flood-prone area due to climate
change in all three cities
In all three megacities, in 2050, there is an increase in
the area likely to be flooded under different climate
scenarios compared to a situation without climate
change. In Bangkok, for instance, under the condi-
tions that currently generate a 1-in-30-year flood,
but with the added precipitation projected for a high
emissions scenario, there will be approximately a 30
percent increase in the flood-prone area. In Manila,
even if current flood infrastructure plans are imple-
mented, the area flooded in 2050 will increase by 42
percent in the event of a 1-in-100-year flood under
the high emission scenario compared to a situation
without climate change. In HCMC, for regular
events in 2050, the area inundated increases from 54
percent in a situation without climate change to 61
percent with climate risks considered under the high
emission scenario. For extreme (1-in-30 year) events,
in 2050, the area inundated increases from 68 percent
(without climate change) to 71 percent (with climate
risks considered) under the high emission scenario.
Further, there is a significant increase in both depth
and duration for both regular and extreme floods
over current levels in 2050 in HCMC. The analysis
also highlights areas that will be at greater risk of
flooding in each metropolitan area. In Metro Manila,
for instance, areas of high population density such
as Manila City, Quezon City, Pasig City, Marikina
Executive Summary
|
xv
a high emission scenario in 2050. One out of eight
of the affected inhabitants will be those living in
condensed housing areas where the population
primarily lives below the poverty line. Of the total
affected population, approximately one-third may
have to encounter inundation of more than a half-
meter for at least one week, marking a two-fold
increase in the vulnerable population. People living
in the Bang Khun Thian district of Bangkok and the
Phra Samut Chedi district of Samut Prakarn will be
especially affected. In HCMC, in some of the areas,
both the poor and non-poor are at risk. However, in
general, poorer areas are more vulnerable to flood-
ing. Thus city planners need to devise strategies
that focus on the poorer sections of the city through
improved access to housing, infrastructure and
drainage, devising appropriate land use policies
and improving the level of preparedness among
the more disadvantaged social groups.
Land subsidence is a major problem and
can account for a greater share of the
damage cost from flooding compared to
climate-related factors
One of the main findings of this study is that non-
climate-related factors such as land subsidence are
important and in some cases even more important
than climate risks in contributing to urban flooding.
In Bangkok for instance, there is nearly a two-fold
increase in damage costs between 2008 and 2050 due
to land subsidence. Further, almost 70 percent of the
increase in flooding costs in 2050 in the city is due
to land subsidence. While data for land subsidence
were not available for Manila and HCMC and this
issue was not considered in the hydrological model-
ing for these two cities, available literature suggests
that it is an important factor in all three cities and
should be considered in follow-up studies. Even
though the megacities have already undertaken a
number of measures to slow down land subsidence,
further regulatory and market incentives are clearly
required to stem groundwater losses. City govern-
ments need to better assess factors contributing to
land subsidence and consider options to reduce it.
infrastructure but a high emission climate scenario.
Thus, the additional costs of climate change from
a 1-in-30-year flood would be approximately PHP
30 billion ($0.65 billion) or 6 percent of GRDP. The
HCMC study adopts a different methodology to ana-
lyze costs and its results cannot directly be compared
to the costs of Manila and Bangkok. The HCMC study
uses a macro approach and estimates a series of an-
nual costs up to 2050. The flood costs to HCMC, in
present value terms, range from $6.5 to $50 billion.
5
The “annualized” costs of flooding would likely be
comparable to the costs of Bangkok and Manila.
Damage to buildings is an important
component of flood-related costs
Damage to buildings is a dominant component of
flood-related costs, at least in Bangkok and Manila.
In these cities, over 70 percent of flood-related costs
in all scenarios are a result of damages to buildings.
Cities are, almost by definition, built-up areas full
of concrete structures, so it is not surprising that
the main impact of floods is on these structures
and the assets they carry. In HCMC, 61 percent of
urban land use and 67 percent of industrial land
use are expected to be flooded in 2050 in an extreme
event if the proposed flood control measures are
not implemented. Potential flooding in HCMC also
has major implications for planning in key sectors
such as transportation and waste management. For
instance, the city’s existing and planned transpor-
tation network, wastewater treatment plants and
landfill sites are likely to be exposed to increased
flooding under the high emission scenario even with
the implementation of the proposed flood protec-
tion system, raising important issues for planners
such as managing the environmental consequences
of flooding. Thus, as cities develop over the next 40
years, it will be important to consider climate risks
in designing their commercial, residential, and in-
dustrial assets and zones.
Impact on the poor and vulnerable will be
substantial, but even better-off communities
will be affected by flooding
In Bangkok, the study estimates that about 1 mil-
lion inhabitants will be affected by flooding under
5
The exchange rates used were the average exchange rates
in 2008: 1 USD = THB 33.31, PHP 44.47 and VND 16,302.25.
xvi
|
Climate Risks and Adaptation in Asian Coastal Megacities: A Synthesis Report
Climate-related risks should be considered as
an integral part of city and regional planning
While improved urban environmental management
is important, the studies also show that given the
additional costs linked with climate change, cities
need to make a proactive effort to consider climate-
related risks as an integral part of urban planning
and to do so now. First, city planners need to de-
velop strategic urban adaptation frameworks for
managing climate risks involving a range of tools
such as policy and regulatory reforms, investments,
and capacity building. Such a strategy can provide
an overarching framework for actions taken within
each sector at the regional, delta, and city levels.
Second, much more emphasis needs to be given to
improving the knowledge base regarding climate
risks and related socioeconomic and development
factors. Developing and updating scenarios and
planning for a range of potential outcomes will be
critical for urban planners. This can be accomplished
by strengthening the collaboration between plan-
ning and sector agencies and research institutions,
thus giving municipal agencies the tools to make
decisions regarding risk management over the long
term (Rosenzweig et al. 2007) Third, it is important
to strengthen the capacity of local urban govern-
mental institutions to adapt to climate change.
Among other things, this involves strengthening the
capacity to prioritize different adaptation options,
improving coordination between various urban
sector agencies and sector plans, and incorporat-
ing climate change considerations into the earliest
stages of decision making.
Targeted, city-specific solutions combining
infrastructure investments, zoning, and
ecosystem-based strategies are required
Given that cities are characterized by distinct cli-
matic, hydrological, and socioeconomic features—
but also that the urban poor in general are more
vulnerable to increased flooding due to climate
change—targeted, city-specific, and cutting edge
approaches to urban adaptation are needed. First,
RECOMMENDATIONS
Coastal cities in developing countries face enor-
mous challenges linked with current patterns
of population and economic growth, associated
environmental externalities, urban expansion and
existing climate variability. Climate change will
pose additional risks beyond those currently facing
coastal megacities. As the study shows, these risks
will also be associated with significant costs to local
populations and infrastructure. Strong political will
is thus needed to strengthen the capacity to address
both existing climate variability and additional risks
posed by climate change. Three main lessons stand
out from the study.
Better management of urban environment
and infrastructure will help manage potential
climate-related impacts
Analysis carried out in the city case studies show
that sound urban environmental management is
also good for climate adaptation. As the Bangkok
study shows, land subsidence, if not arrested, would
contribute a greater share of damage costs from
floods than a projected change in climate conditions.
Thus, addressing land subsidence and factors con-
tributing to it is important from the perspective of
urban adaptation. While the HCMC study has not
estimated the damage costs due to other environ-
ment-development factors—such as the presence of
solid waste in the city’s drains and waterways, poor
dredging of canals, siltation of drains, deforesta-
tion in the upper watershed—it provides extensive
qualitative evidence to demonstrate the role these
factors play in contributing to urban flooding.
Collectively, the studies highlight the importance
of addressing existing environment-development
factors as a critical part of urban adaptation. They
also show that given the high risks of continuing
to urbanize according to current patterns, much
more effort should be given to considering the
environmental implications of urban growth and
expansion in the context of managing current and
future climate risks.
Executive Summary
|
xvii
of the city. For instance, in HCMC, storm surges
and sea level rise are important factors contributing
to flooding. However, in Bangkok these factors are
relatively less important. The policy implication is
that adaptation measures need to be designed based
on the specific hydrological and climate character-
istics of each city. Fourth, damages to buildings
emerge as a dominant component of flood-related
costs, at least in Bangkok and Manila. Vulnerability
mapping, land use planning and zoning could be
used to restrict future development in hazardous
locations, ultimately retiring key infrastructure
and vulnerable buildings in these areas. Similarly,
building codes aimed at flood-proofing buildings
(including the lowest habitable elevation in vulner-
able areas) could dramatically reduce damage costs.
Such targeted measures could go a long way in
helping coastal megacities to adapt to current and
future climate risks.
these include strategies that focus on the more
vulnerable areas of the city and the urban poor.
Second, as the studies show, hard infrastructure
interventions can also be usefully combined with
ecosystem-based solutions. For instance, construc-
tion of dykes can be matched with management
and rehabilitation of mangrove systems, refores-
tation of upper watersheds, river and canal bank
protection, and implementation of basin-wide flow
management strategies. Urban wetlands provide
a range of services, including flood resilience, al-
lowing groundwater recharge and infiltration, and
providing a buffer against fluctuations in sea level
and storm surges. Thus, rehabilitation of urban
wetlands is critical. Third, as the city case studies
show, while a combination of climate-related factors
can contribute to urban flooding, some factors are
much more important than others in different cities
depending on location, elevation, and topography
1
1
BACKGROUND AND RATIONALE
As recent weather events have illustrated, coastal
areas in both developing and more industrialized
economies face a range of risks related to climate
change (IPCC 2007a). Anticipated risks include an
accelerated rise in sea level of up to 0.6 meters or
more by 2100, a further rise in sea surface tempera-
tures by up to 3° C, an intensification of tropical
and extra tropical cyclones, larger extreme waves
and storm surges, altered precipitation and run-
off, and ocean acidification (Nicholls et al. 2007).
The Intergovernmental Panel for Climate Change
Fourth Assessment Report (IPCC 2007a) points to
a range of outcomes under different scenarios and
identifies a number of hotspots—including heav-
ily urbanized areas situated in the large low-lying
deltas of Asia and Africa—as especially vulnerable
to climate-related impacts. For instance, by 2080,
the report points out, many millions more people
may experience floods annually due to sea level
rise (IPCC 2007a). More frequent flooding and in-
undation of coastal areas can also result in various
indirect effects, such as water resource constraints
due to increased salinization of groundwater sup-
plies. Human-induced pressures on coastal regions
can further compound these effects.
The location of many of the world’s major cit-
ies—such as Mumbai, Shanghai, Jakarta, Lagos,
and Kolkata—around coastlines, rivers, and deltas
provides an indication of the population and as-
sets at risk. Thirteen of the world’s 20 largest cities
are located on the coast and more than a third of
the world’s population lives within 100 miles of
a shoreline. Low-lying coastal areas—defined as
areas along the coast that are less than 10 meters
above sea level—represent 2 percent of the world’s
land area, but contain 13 percent of the urban popu-
lation (McGranahan et al. 2007). A recent study of
136 port cities showed that the population exposed
to flooding linked with a 1-in-100-year event is
likely to rise dramatically, from 40 million cur-
rently to 150 million by 2070 (Nicholls et al. 2008).
Similarly, the value of assets exposed to flooding
is estimated to rise to $35 trillion, up from $3 tril-
lion today. The study also shows that significant,
increasing exposure is expected for the populations
and economic assets in Asia’s coastal cities.
In flood-prone cities such as Manila, potential
sea level rise and increased frequency and inten-
sity of extreme weather events poses enormous
challenges on urban local bodies’ ability to adapt.
Apart from their location, the scale of risk is also
influenced by the quality of housing and infra-
structure, institutional capacity with respect to
emergency services, and the city’s preparedness
to respond. The urban poor are most at risk from
exposure to hazards in coastal cities, as they tend
to live in riskier urban environments (such as
floodplains, unstable slopes), tend to work in the
informal economy, have fewer assets, and receive
relatively less protection from government institu-
tions (Satterthwaite et al. 2007).
Despite its importance, few developing coun-
try cities have initiated efforts to integrate climate
change issues as part of their decision-making
process. Given the risks faced by coastal cities and
the importance of cities more broadly as drivers of
Introduction
2
|
Climate Risks and Adaptation in Asian Coastal Megacities: A Synthesis Report
regional economic growth, adaptation must become
a core element of long-term urban planning.
Recognizing the importance of this issue, the
World Bank, Asian Development Bank (ADB) and
the Japan International Cooperation Agency (JICA)
agreed to undertake an analysis in several coastal
cities to address climate change adaptation and
prepare a synthesis report based on the city-level
findings. The selected cities include Manila (led by
JICA), Ho Chi Minh City (led by the ADB), Bangkok
(led by the World Bank’s East Asia and Pacific Re-
gion), and Kolkata (led by the World Bank’s South
Asia Region). This synthesis report builds on the
analysis undertaken in three of these cities—Manila,
Bangkok, and Ho Chi Minh City (Figure 1.1).
6
The different cities were selected given the
threats they face from increasing hydrometeorologi-
cal variability driven by climate change. Bangkok,
located in the Chao Phraya delta, was identified as
a hotspot in a background report to the IPCC’s AR4
(IPCC 2007b). Manila was identified in OECD’s vul-
nerable port cities report (Nicholls et al. 2008), par-
ticularly regarding typhoon damage. HCMC ranked
fifth by population exposed to the effects of climate
change (Nicholls et al. 2008). A recent study also
identified Manila, Ho Chi Minh City, and Bangkok
among the top eleven Asian megacities that are most
vulnerable to climate change (Yusuf and Francisco
2009).
7
Devastating floods in Manila in September
and October 2009 only confirm the vulnerability of
this city to extreme weather events. For instance,
flooding in Manila caused by tropical storm Ketsana
in September was the heaviest in almost 40 years,
with flood waters reaching nearly 7 meters. More
than 80 percent of the city was underwater, caus-
ing immense damage to housing and infrastructure
and displacing around 280,000–300,000 people.
8
All of this highlights the need to better understand
and prepare for such climate risks and incorporate
appropriate adaptation measures into urban plan-
ning. While there is a growing literature on cities
and climate change, as yet there is limited research
on systematically assessing climate-related risks
at the city/local level and assessing damage costs,
particularly in cities in developing countries. This
report aims to fill this gap. Further, it aims to provide
science-based information to support urban policy
and planning as these issues are being debated at
the local, national, and global levels.
OBJECTIVE
The main objective of this report is to strengthen
our understanding of climate-related risks and im-
pacts in coastal megacities in developing countries
using case studies of three cities that are different
in their climate, hydrological, and socioeconomic
characteristics. Specifically, it draws on in-depth
analysis of climate risks and impacts in three cit-
ies—Bangkok, Manila, and Ho Chi Minh City—to
highlight to national and municipal decision makers
(a) the scale of climate-related impacts and vulner-
abilities at the city level, (b) estimates of associated
damage costs, and (c) potential adaptation options.
The comparative analysis carried out in this report
shows the increasing climate risks faced by coastal
megacities and the need to consider adaptation as
part of long-term strategic planning. Even though
the study is based on analysis in three cities, the
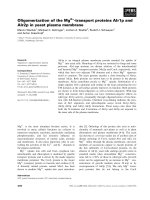
FIGURE 1.1 ■ Asian Megacity Hotspots
Ho Chi Minh
City
Bangkok
Manila
PHILIPPINES
VIETNAM
THAILAND
This map was produced by the
Map Design Unit of The World Bank.
The boundaries, colors, denominations
and any other information shown on
this map do not imply, on the part of
The World Bank Group, any judgment
on the legal status of any territory, or
any endorsement or acceptance of
such boundaries.
IBRD 38067
SEPTEMBER 2010
Source: Asia map IBRD 38067
6
The Kolkata study was not completed at the time of the
preparation of the synthesis report and thus was not in-
cluded in main report. Annex A provides a brief overview
of the study.
7
Vulnerability in the scorecard was understood in
terms of exposure, sensitivity, and adaptive capacity of
the cities. See also />S/12324196651Mapping_Report.pdf
8
/>philippines.floods/index.html
Introduction
|
3
policy implications have broader relevance for
assessing climate risks and identifying adaptation
options in other coastal areas.
PROCESS OF PREPARATION
The analysis was carried out over a period of one-
and-a-half years. The synthesis team and the city-
level teams worked closely to develop common
terms of reference to guide the city-level studies.
Further, while the synthesis team helped coordinate
the process, each city-level team worked indepen-
dently with their respective country counterparts to
build ownership and capacity for the analysis. The
city teams were comprised of members with a range
of skills, including climate modeling, hydrological
analysis, GIS mapping, economic analysis, and
urban planning. The city teams and the synthesis
team preparing this report also met periodically to
share methodological issues and ongoing findings
and research. These discussions and the analysis
undertaken for each city have formed the basis of
the preparation of this synthesis report. At the level
of each city, the teams have undertaken stakeholder
consultations with city officials and government
agencies at different levels, nongovernmental
organizations, the private sector, and other con-
stituencies. For instance, the main counterparts in
HCMC were the HCMC People’s Committee and
the Ministry of Natural Resources and Environment
(MONRE); the study sought to inform preparation
of HCMC’s city-wide adaptation plan. In Bangkok,
the main counterpart was the Bangkok Municipal
authority. In Metro Manila, it was the Metro Manila
Development Authority (MMDA). At the global
level, preliminary findings have already been pre-
sented at several international forums to reach
urban planners, municipal decision makers, and
researchers.
OVERVIEW OF METHODOLOGY/
APPROACH AND CLIMATE
PARAMETERS SELECTED
The city-level studies considered two IPCC emis-
sions scenarios,
9
A1FI and B1 (with the exception of
HCMC, which considered the A2 and B2 scenarios),
and estimated climate risks to 2050. The 2050 time
horizon for the study is appropriate, given planning
horizons in most cities and given that the typical
time frame for major flood protection planning is
about 30 years. Moreover, the uncertainty in cli-
mate projections expands rapidly past roughly the
mid-21st century, providing additional justification
for limiting the time horizon to 2050. Climate vari-
ables considered included changes in temperature,
changes in precipitation, estimated sea level rise,
and estimated storm surge. In addition, non-climate
factors—such as land subsidence, land use changes,
salinity intrusion, and population increases—were
also considered. Flooding in the metropolitan ar-
eas was chosen as the key climate variable to be
examined. The approach consisted of the following
sequential steps: (1) downscaling climate variables
to the level of the city/watershed; (2) hydrometeo-
rological modeling and scenario analysis, presented
in GIS maps; and (3) damage/loss assessment and
identification/prioritization of adaptation options.
These steps are discussed in more detail in chapter 2.
To support this analysis, each city team collected
extensive historical and city-specific data related
to past climate events such as storms and flooding,
socioeconomic data, information about local topog-
raphy and hydrology, information on land use, and
so forth. Data limitations were a major challenge,
but each team worked with existing data from pub-
lic sources, as well as data made available by city
governments and institutions. There are numerous
uncertainties at each step of the analysis.
While the main focus of this report is on assess-
ing future climate risks at the city level, it builds
on the recognition of strong links between climate
adaptation and ongoing efforts toward disaster
risk management. Despite the institutional differ-
ences in terms of how these efforts have emerged,
and differences in how climate change/variability
and disasters manifest themselves, they both share
common ground in striving toward strengthening
adaptive capacity of vulnerable communities, build-
ing resilience, and reducing the impact of extreme
9
Different scenarios were considered to assess impact due
to the uncertainties in projecting future climate conditions.
4
|
Climate Risks and Adaptation in Asian Coastal Megacities: A Synthesis Report
events. The analysis undertaken in this report uses
several methodologies that have long been used
in the context of disaster risk management—such
as damage cost assessment and probabilistic risk
analysis—illustrating the opportunities for cross-
fertilization in both areas.
STRUCTURE OF THE REPORT
Chapter 2 presents methodologies used to deter-
mine climate change risks at the city/river-basin
level through downscaling techniques, flood risk
assessment through hydrometeorological models,
and damage cost analysis. Chapter 3 presents
the main findings from climate downscaling,
hydrological modeling analyses, and use of GIS
mapping.
10
Chapter 4 presents the analysis and
findings relating to damage cost assessment, as
well as an analysis of adaptation options. Finally,
Chapter 5 draws broad policy lessons and presents
conclusions.
10
For a broader set of GIS maps, please refer to city-specific
reports.
5
I
n order to assess the impact of climate change
in terms of increased flooding in 2050 in each
of the coastal cities, three main methodological
steps were taken. These include (1) determining
climate-related impacts at the city/river-basin level
through downscaling; (2) developing flood risk
assessment hydrometeorological models for each
city to estimate flooding in 2050 under different sce-
narios; and (3) assessing damage costs. This chapter
provides a summary of these methodologies. It
highlights the climate change scenarios selected, ap-
proaches to downscaling, assumptions underlying
hydrological analysis, and the approach to damage
cost assessment. Some of the methodologies used
here—such as damage cost analysis and probabilis-
tic risk assessment—are also used in disaster risk
management.
11
Uncertainties and errors involved
in different steps of the analysis are also discussed.
SELECTION OF EMISSIONS
SCENARIOS, DOWNSCALING,
AND UNCERTAINTIES
To measure the impact of climate change on the
cities in 2050, it was necessary to assume emissions
scenarios and as a first step, “downscale” climate
change forecasts to local levels so that the meteoro-
logical parameters—such as changes in temperature
and precipitation—could be applied as inputs to the
hydrometeorological models.
Range of emissions scenarios considered
The potential impact of climate change can vary
greatly depending on the development pathway
that is assumed. Beginning in 1992, the IPCC has
provided various scenarios for the emissions of
greenhouse gases based on assumptions of differ-
ent development pathways—namely, complex and
dynamic interactions among future demographic
changes, economic growth, and technological and en-
vironmental changes. These emissions scenarios are
projections of what the future may look like and are
a tool to model climate change impacts and related
uncertainties. As described in the IPCC Special Report
Methodologies for
Downscaling, Hydrological
Mapping, and Assessing
Damage Costs
2
11
A probabilistic risk assessment provides an estimate
of the probability of loss due to hazards. It is commonly
used in disaster risk management planning and provides a
quantitative baseline for measuring the benefits (or losses
avoided) of disaster management alternatives. In climate
change impact and adaptation studies, it also provides a
baseline for assessing the change in risks due to the in-
creasing hydrometeorological hazards associated with
climate change. See, for instance, Earthquake Vulnerability
Reduction Program in Colombia, A Probabilistic Cost-benefit
Analysis (World Bank Policy Research Working Paper
3939, June 2006) for an example of a probabilistic risk as-
sessment used in disaster risk management planning. The
process involves the development of several intercon-
nected modules, which calculate in turn the hazard prob-
ability, exposure, vulnerability (or sensitivity to damage),
damages, and losses. While the approaches used in the de-
velopment of the modules and the calculation of the losses
varied, each city case study did, however, follow a similar
analytical process.