The Effect of Drought on Health Outcomes and Health Expenditures in Rural Vietnam
Bạn đang xem bản rút gọn của tài liệu. Xem và tải ngay bản đầy đủ của tài liệu tại đây (2.49 MB, 31 trang )
Courant Research Centre
‘Poverty, Equity and Growth in Developing and
Transition Countries: Statistical Methods and
Empirical Analysis’
Georg-August-Universität Göttingen
(founded in 1737)
No. 156
The Effect of Drought on Health Outcomes and Health
Expenditures in Rural Vietnam
Tobias Lechtenfeld, Steffen Lohmann
February 2014
Discussion Papers
Wilhelm-Weber-Str. 2 ⋅ 37073 Goettingen ⋅ Germany
Phone: +49-(0)551-3914066 ⋅ Fax: +49-(0)551-3914059
Email: Web:
The Effect of Drought on Health Outcomes and Health
Expenditures in Rural Vietnam
Tobias Lechtenfeld
1
and Steffen Lohmann
∗ 2
1
World Bank, Washington DC, USA
2
Department of Economics, University of Goettingen, Germany
Abstract
This paper studies the impact of droughts on health outcomes and health expenditures
in rural Vietnam. Given the increasing frequency of extreme weather events in Vietnam
and many developing countries, it is crucial for policy makers to be aware of the economic
impact of such shocks at the micro level. Using local rainfall data, the analysis directly links
the incidence of drought to health shocks and health-related expenditures from a multiple-
wave panel of rural Vietnamese households. Overall, the results suggest that individuals
affected by drought display a deterioration of health conditions and have significantly higher
health expenditures. The effect is found to prevail among households with a high degree of
agricultural dependency and limited access to coping mechanisms such as selling assets or
tapping off-farm income sources. The preferred estimates using an IV strategy reveal that
drought-related health shocks can cause non-negligible additional financial burden for many
households vulnerable to poverty in rural Vietnam. This paper quantifies the immediate
impact of drought on health conditions and contributes to the existing literature which has
mostly focused on the long-term consequences.
Keywords: climate shocks, drought, health, Vietnam
JEL Classification: I15, O15, Q54
∗
Corresponding author: Steffen Lohmann, Department of Economics, University of Goettingen, Platz der
Goettinger Sieben 5, 37073 Goettingen, Germany. E-mail address: steff
We would like to thank Stephan Klasen, Sebastian Vollmer as well as participants of the DIW Berlin Workshop
”Climate shocks and household behavior” and the RTG ”Globalization and Development” Workshop in Hanover
for helpful comments. Theres Kluehs provided excellent research assistance. Financial support from the
German Research Foundation within the project ”DFG-FOR 756: Vulnerability to Poverty in Southeast Asia” is
acknowledged.
Extreme weather linked to climate change is increasing and will likely cause more disasters. Such
disasters, especially those linked to drought, can be the most important cause of impoverishment,
cancelling progress on poverty reduction. (Overseas Development Institute 2013, p. vii)
1 Introduction
As the frequency of extreme weather events increases rapidly across the world, researchers and
policy makers alike recognize the enormous cost developing countries face from the damage to
infrastructure, crop production, and most importantly, human development and human lives.
In fact, for most countries weather shocks are the single most important cause that pushes
households below the poverty line and keeps them there (World Bank 2013). The second most
important cause relates to health shocks, which are highly correlated with weather shocks such
as floods and droughts.
Vietnam is among the countries most frequently affected by extreme weather. With a coastline
that covers much of tropical South-East Asia, the country is prone to typhoons, especially during
the monsoon season. In addition, rain patterns have become increasingly volatile, and large parts
of the country regularly suffer from delayed rainfall that causes drought-like conditions during
parts of the year. Particularly in rural areas dependent on agriculture, sufficient rainfall is crucial
for subsistence and income generation (Nguyen 2011). In fact, despite Vietnams impressive
record on economic growth and poverty reduction, one out of five Vietnamese continues to live
on less than 1.25 USD per day. In addition, many households earn barely more than the poverty
line (World Bank 2012b). Weather shocks frequently affect poor and vulnerable households and
push families into poverty, especially in rural parts of the country (Klasen et al. 2014).
Much of the literature on extreme weather events documents that increased variation of temper-
ature and rainfall can have economically meaningful and statistically significant effects on health
outcomes.
1
Generally, a number of potential channels through which drought-like conditions can
have health effects have been identified, namely nutrition, income and heat (Dell et al. 2014;
World Bank 2012a). First, drought can have detrimental effects on agricultural output which
can lead to substantially reduced nutritional intake among children and adults. Substitution
effects towards lower quality foods can further affect nutritional supply. Second, spikes in food
prices due to reduced aggregate food production can lead to increased income needs (Banerjee
and Duflo 2007). Especially for subsistence farmers growing their own staple food such as
paddy-rice in Vietnam, droughts regularly force families to take children out of school and put
them to physical work, further increasing health hazards. Third, extreme heat has been shown
1
See Dell et al. (2014) for a review of the climate-economy literature.
1
to increase child mortality in developing countries through direct health effects including higher
water and food pollution and vector borne diseases (Burgess et al. 2011; World Bank 2010,
2012a).
Most of the existing epidemiology and economics literature estimates the long-term effects of
drought on health outcomes. The short-term health implications are less well established, and
especially the direct economic cost related to illness caused by drought is largely unknown at
the micro-level. While very different methods are used to identify droughts in historic data,
it is well established that lack of rainfall can trigger substantial health effects for children and
adults later in life. Most studies find either significant increases in child mortality or reductions
in height-for-age growth of children. Hoddinott and Kinsey (2001), for instance, examine the
impact of rainfall shocks on child growth using a panel data set from rural Zimbabwe. They find
that children aged 12 to 24 months lose 1.5 to 2 cm of growth in the aftermath of a drought and
evidence points to poor households and girls being especially vulnerable. Catch-up growth of
these children is limited so that this growth faltering has a permanent effect. Similarly, Yamano
et al. (2005) analyze the effect of drought on child malnutrition in Ethiopia, which experienced
several droughts during the period covered by the panel household surveys. Their results suggest
that children between 6 and 24 months experienced 0.9 cm less growth over a six-month period in
communities where half the crop area was damaged during drought. Looking at child mortality
in the aftermath of drought, Rose (1999) investigates how rainfall conditions during childhood
affect the survival probabilities of girls compared to boys in rural India. Her results indicate
that during years with favorable rainfall the survival rates of girls increase relative to boys.
A related strand of literature examines to what extent early-life rainfall has lasting effects on
health, education, and socioeconomic outcomes during adulthood. Importantly, children growing
up during an extended drought episode suffer from under-investments in schooling and earn lower
incomes throughout their lives. By combining historical rainfall by birth year and birth location
with adult outcomes in Indonesia, Maccini and Yang (2009) find that good rainfall during birth
years has large positive effects on the adult outcomes of women, but not of men. Women born in
years with higher rainfall (relative to the local norm) are taller, complete more schooling grades,
and live in households scoring higher on an asset index. Schooling attainment appears to mediate
the impact on adult women’s socioeconomic status. Using longitudinal datasets from Zimbabwe
and Tanzania, Alderman et al. (2006, 2009) study the impact of drought-induced malnutrition
on body height and human capital formation. Their general findings are that drought shocks
during pre-school age have adverse effects on nutritional status and subsequent child growth
as well as on lifetime earning capacity due to both delays in schooling and declines in total
2
schooling, including years of education and delay in enrollment.
This paper provides new estimates on the short-term effects of drought on health outcomes and
health-related expenditures for households in rural Vietnam. Using data on local rainfall, this
study identifies episodes of drought by comparing current precipitation patterns with historic
trends. By following households over four panel waves between 2007 and 2013, the analysis
exploits variation over time and space. Methodologically, the empirical analysis is two-parted.
In a first part, variations in local rainfall are related to individual indicators of health conditions
to estimate the direct impact of drought on health outcomes. The analysis also assesses the
relation of drought and the agricultural sector, which socio-economic characteristics drive a
household’s vulnerability to drought, and whether health insurance schemes can alleviate the
adverse effects of drought. The second part aims at quantifying the effect of drought on monetary
health expenditures, using an Instrumental Variable (IV) approach in which the incidence of
health shocks is estimated using varying degrees of drought intensity. Health expenditures
provide an important opportunity to quantify the direct health cost associated with drought at
the micro level. Together, the results from this paper reveal the immediate burden of drought
in terms of human health and associated expenditures and contribute to closing a gap in the
development literature on the short-term health effects of drought.
The empirical results suggest that rural households affected by drought display a deterioration
of health conditions and have significantly higher health expenditures. There is evidence for
drought to increase the likelihood of illness, particularly for the working-age population. The
adverse effect is found to prevail among households with a high degree of agricultural dependency
and limited access to coping mechanisms such as selling assets or tapping off-farm income
sources. A government-subsidized pro-poor health insurance scheme is found to reduce the
adverse effects of drought on health. As for the monetary burden on the household budget,
the IV estimates suggest that drought-related health shocks cause substantial financial cost.
Against the background that the major share of health expenditures is financed out-of-pocket,
the additional expenditures due to drought-related health shocks can make up around one
fifth of what a typical households normally spends on food items and may therefore pose a
non-negligible burden for many households vulnerable to poverty in rural Vietnam. These
results have important policy implications for risk management, including insurance against
adverse weather shocks, and health care financing.
The remainder of the paper is structured as follows. Section 2 briefly discusses the drought-health
nexus in light of recent developments in Vietnam. Section 3 details the empirical strategy and
section 4 introduces the panel data and outcome variables, as well as the measure of drought.
3
Section 5 presents the results with implications on health insurance and household finances.
Section 6 offers concluding remarks.
2 Drought and health in rural Vietnam
Due to its geographical position, Vietnam has an extensive record of extreme weather events and
droughts have become an almost annual phenomenon. Next to typhoons and floods, droughts
have been identified to be one major source of economic distress with significant adverse effects
on people’s livelihoods (UNISDR 2011). According to recent figures, Vietnam ranks sixteenth
when comparing the absolute number of people exposed to drought-like conditions around the
world (UNISDR 2009). Over the past decade, episodes of drought have increased both in terms
of severity and length – and so did the associated economic costs. For a single drought in 2005,
for instance, the estimated economic damage was 110 million USD, or roughly 0.2 % of the
country’s GDP (UNISDR 2011). In the search of explanations for the increasing prevalence of
drought-like conditions in Vietnam, the National Centre for Hydro-Meteorological Forecasting
not only refers to external factors, such as poorly and unequally distributed rainfall, but also
lists internal factors. These most importantly include ongoing deforestation, the cultivation of
water-intensive crops, and increased unregulated industrial activity (NCHDMF 2013).
This paper scrutinizes the relation between drought and health at the micro-level. Given the
distinct features of Vietnam’s rural economy, various channels exist through which both are
interlinked. First and foremost, it can be expected that poor rainfall conditions negatively
affect agricultural output triggered by reductions in crop production and a reduced availability
of fodder for livestock (Toulmin 1987). Given a high dependency on income from crops and
livestock for many households in rural Vietnam, slumps in agricultural income might not only
directly lead to the degradation of the supply with food and basic nutrients from subsistence
agriculture. Also, they might lower the ability to secure a sufficient nutritional intake through
purchases on local markets. This holds particularly if episodes of drought trigger food price
surges, such as for rice.
2
Besides nutritional considerations, shortages in rain might also be
directly linked to specific diseases. In neighboring Laos, for instance, a higher number of
dengue fever cases has been reported following longer drought spells (IRIN 2013). In addition,
when health outcomes are negatively affected by drought, these rather short-term effects might
eventually spur second-round effects on household welfare depending on the ability of households
to cope with the immediate consequences. Secondary effects such as reduced working capacity
2
Local-level experience from the developing world indeed reveals that the major sectors affected by drought
include crop production, livestock, and food prices (Warner and van der Geest 2013).
4
or negative productivity shocks might come into play as a direct consequence of worse health
conditions (Jayachandran 2006; Loayza et al. 2012). This is particularly relevant for households
whose structure of employment relies mainly on strength and endurance, such as in Vietnam
(Rabassa et al. 2012).
From the viewpoint of economic and social policy, it is important to obtain a better understand-
ing of the short-term consequences of drought for health conditions and economic outcomes in
highly affected countries, such as Vietnam. Identifying the short-term effects is particularly
crucial for Vietnam as access to health care is limited and and many households are effectively
left without a buffer against adverse health shocks (Wagstaff 2007b). Despite improvements
in health insurance coverage, most rural Vietnamese households are still strongly dependent on
out-of-pocket expenditures to finance health care and, in global comparison, health expenditures
linked to catastrophic events have traditionally affected a relatively large share of Vietnam’s
population (Wagstaff and Doorslaer 2003; Wagstaff 2007a; Ekman et al. 2008). In 2003, the
government of Vietnam introduced the Health Care Fund for the Poor (HCFP) program which
is designed to especially reach out to the poor and ethnic minorities. Being partly financed
by central government revenues, the HCFP essentially functions as a cross-subsidization from
better-off to poorer parts of the population (Ekman et al. 2008). However, while delivering
some promising results in terms of health care utilization and reductions in out-of-pocket health
care expenditures (Axelson et al. 2009; Wagstaff 2007a), coverage remains far from universal.
Using World Bank data, Kemper and Lechtenfeld (2012) find substantial targeting error, which
leaves nearly half of all poor households without access to health care financing. In fact,
economic disparities between rural and urban regions in Vietnam have recently materialized
in disproportionately bad health conditions in many rural areas of the country (World Bank
2012b).
3 Empirical strategy: Identifying the effects of drought
In order to assess the effects of drought on health outcomes and household expenditures, the
empirical analysis is two-parted. In a first step, the effect of drought incidence on individual
health conditions is analyzed. To this end, a regression on the determinants of falling ill is esti-
mated for household members. The model includes a measure of drought incidence, individual
socio-demographic determinants of illness, and – in subsequent analyses – the interactions of
both. This first part of the empirical investigation therefore also bears insight into which parts
of the population are most vulnerable to drought shocks – which serves to identify those most
in need of protection by economic and social policy. In a second step, the monetary costs of
5
drought incidence at the household-level are analyzed using drought as a source of exogenous
variation to health conditions in the household.
The role of drought for health outcomes is analyzed in a reduced-form regression that relates a
measure of health conditions on drought incidence and other determinants of health:
health
ihdt
= β
0
+ β
1
drought
dt
+ β
2
X
ihdt
+ δ
pt
+
ihdt
, (1)
where health
ihdt
denotes the health status indicator of individual i in household h and district d
at time t. The variable drought is the measure of drought severity, collected at the district-level.
The vector X includes socio-demographic and economic characteristics at the household or
member level, such as age, gender, and household wealth. δ
pt
is a set of wave fixed-effects to
account for covariate changes in living conditions in between the three survey waves and province
fixed-effects to account for time-invariant province-specific factors. Finally, is a standard error
term whose structure allows for interdependent observations within one household.
Whereas equation (1) assumes that all households in the sample have a homogeneous response of
health towards drought shocks, this might not be so in reality. Demographic and socio-economic
characteristics, e.g. the gender or age of each individual, might be important factors that
determine how drought channels through on health outcomes. Also, the ex-ante vulnerability to
the drought shock as well as the mechanisms available to cope with it ex post may crucially alter
the extent to which households suffer from drought-related health shocks. The identification of
heterogeneous impact by observable individual characteristics therefore allows shedding light
on possible transmission channels. At the same time it yields implications for economic and
social policy aimed at mitigating the vulnerability to adverse weather shocks. To subject these
theoretical considerations to an empirical test, equation (1) is augmented with interaction terms
of illness and a number of household and individual characteristics, such that the estimated
interaction effects reflect any differentials in the effect of drought on health outcomes based on
these characteristics.
To assess the monetary costs that drought exerts on household budgets, health expenditures are
related to the incidence of drought-related health shocks at the household-level. Specifically, a
binary variable household illness is constructed from the incidence of illness in the household:
health expenditures
ht
= γ
0
+ γ
1
household illness
ht
+ γ
2
X
ht
+ σ
pt
+ u
ht
. (2)
Other control variables in the vector X in equation (2) include household-level determinants of
health expenditures, mostly time-variant, such as the household’s age and gender composition,
6
the total household size, and the household’s dependency ratio. As before, σ
pt
captures province
and wave fixed-effects. u is a residual term which allows for heteroskedasticity, such that robust
standard errors are reported.
In the reduced form, reported health conditions in the household are potentially endogenous to
unobserved household behavior and prone to measurement error. First and foremost, whether
a household actually suffers a health shock is likely to be systematically related with both its
preparedness towards such a shock ex ante – that is, its shock prevention strategies – as well
as its ability to cope with the shock ex post. For instance, households members being aware of
their health status might seek formal or informal insurance mechanisms, e.g., through buying
health insurance or investing into a reciprocal social network. Households members in bad
health might also have a higher propensity to build up savings beforehand in order to bear
the anticipated costs of treatment. In these cases, the simple difference in health expenditures
between households differently affected by health shocks would not capture the true monetary
impact of the shocks. Rather would the simple reduced-form relation of the shock and household
welfare yield an underestimate of the true cost of the shock if endogenous household behavior
remained unobservable. Second, measurement error due to over- and underreporting is a major
concern when dealing with subjective information on health shocks, particularly if responses
might be subject to moral hazard. OLS estimates of γ
1
in equation (2) are therefore expected
to be downward biased.
The incidence of drought serves as an exogenous source of variation in health shocks. To provide
for an adequate instrument, it should be sufficiently relevant for health outcomes within the
household and must not have a direct effect on health expenditures that does not work through
the incidence of illness and is not controlled for given the other regressors in equation (2).
The relevance of the instrument will be benchmarked by the explanatory power of the first
stage regression. As for the exclusion restriction, the identifying assumption is made that
drought affects health expenditures only through a change in the incidence of illness within
the households. To exclude anticipatory changes in household behavior as with conventional
health shocks, rainfall shortages need to be unexpected. As the following analysis benchmarks
actual precipitation against a long-term multi-decade average, it already takes into account
the differences between regions that historically have different exposure to rainfall. Drought
therefore results from short-term variations in rainfall which are by their very nature difficult
to anticipate. Based on survey information from rural Vietnam (see section 4 for details on
the survey), only few households in the sample indicated to employ some type of individual
or collective drought prevention strategies and this predominantly at the end of the survey
7
period. Unfortunately, the information is not available for the whole period of analysis, such
that an inclusion would substantially reduce the sample. Also, there is no reliable information
on these strategies’ effectiveness and whether the take-up of drought prevention strategies is in
fact related to actual occurrence of drought. Against this background, the bias from systematic
anticipation of drought should be limited and, if at all existent, induce a downward bias on
the estimated drought-health relationship. As a robustness check, we verify that omitting those
households that reported to take-up prevention strategies from the sample does not change the
empirical results significantly.
Econometrically, to isolate the drought-related component of health shocks in the household,
we instrument the illness incidence using varying exposure to drought as an instrument. The
first-stage resembles the setting of equation (1), but is aggregated to the household-level. In the
second stage, a measure of health expenditures of the household is regressed on this instrumented
illness variable. The analysis focuses on the IV coefficient which captures the Local Average
Treatment Effect (LATE) of changes in illness incidence solely due to variation in exposure to
drought.
4 Data
4.1 Survey data
The empirical analysis builds on a rich dataset collected within the framework of the project
”Vulnerability to Poverty in Southeast Asia”, sponsored by the German Research Foundation
and carried out as a panel survey in four waves between 2007 and 2013.
3
The survey includes
more than 2,000 households in 200 villages in the rural provinces of Ha Tinh, Thua Thien Hue
(referred to as Hue), and Dak Lak.
4
With Ha Tinh being among the poorest of Vietnam’s
58 provinces, all provinces in the survey rank in the lowest income quintiles in the country with
their population predominantly engaging in small-scale agriculture and limited self- and off-farm
employment. The survey households were selected through a three-stage sampling procedure
with special attention paid to including densely and less-densely populated districts into the
survey. Within each village in the survey, ten households were chosen randomly.
5
While there is
some migration to urban centers of some household members, attrition in the panel generally is
relatively low with rates around two to three percent for each wave. In the main specifications,
we are left with a total sample of 10,844 individuals and 1,954 households.
3
The timing of the survey was chosen deliberately around April in 2007 (Wave 1), 2008 (Wave 2), 2010
(Wave 3), and 2013 (Wave 4).
4
Figure A.1 in the appendix shows a map of the study area.
5
For further details of the sampling procedure, see Hardeweg et al. (2007).
8
For the study of how adverse drought shocks impact on the households in our sample, informa-
tion on health outcomes and socio-demographic characteristics for each household member are
analyzed in conjunction with household-level information on annual health expenditures. The
main measure of health conditions is constructed from the survey’s health module documenting
physical well-being at the time of the survey as well as the suffering from diseases in the twelve
months preceding the survey. Specifically, the dummy variable takes value 1 if the household
member reports to have suffered a ”severe illness” in the year before the survey. As this includes
every illness that the respondent considers severe – regardless of its theoretical dependence
on weather shocks or actual severity – we exclude those diseases that clearly cannot have a
short-term link to weather conditions. This choice, however, does not make a difference for the
central messages of the empirical analysis. Alternative to this simple measure of illness, other
health indicators are derived from self-reported anthropometric information in the data which
potentially yield complementary information to general illness incidence. Besides crude measures
such as the household members’ weight, Body-Mass-Indices (BMI) which are commonly taken as
a useful measure of malnutrition among adults are calculated for individuals exceeding the age of
20 years.
6
We also follow Wagstaff (2007b) and consider whether an adult suffered a substantive
drop in the Body-Mass-Index (BMI) in between two waves. This latter dummy variable takes
value 1 whenever the BMI drops by more than one standard deviation of the distribution of BMI
changes.
7
The impact of drought on BMI indicators is ambigous ex ante, since in the short-term
higher-quality food might simply be substituted through a lower-quality diet. To finally evaluate
health and nutritional conditions of young children, anthropometric indicators of malnutrition
are obtained for children younger than five years using a standard method (WFP 2005).
8
As
both body weight and height are self-reported, calculating weight-for-height scores would likely
be subject to substantive measurement error. To limit this source of bias, weight-for-age scores
are calculated which are considered a summary indicator for both the short-term (wasting) and
long-term (stunting) effects of child malnutrition.
To assess the impact of drought on monetary consumption of the households, health expenditures
are recorded at the household-level. Drawing on an expenditure module, the survey provides
detailed information how much money the household spent each year on various purposes,
6
As the BMI changes more quickly for young people, this is less of a meaningful measure for underweight and
health conditions for the children in the sample.
7
As in Wagstaff (2007b), the focus is on decreases in the BMI rather than any changes to establish a direct
relation to adverse health shocks.
8
Specifically, childrens’ body weight is mapped against the distribution of a healthy reference population.
Based on the median and standard deviation for the same age and gender, z-scores are calculated which reflect
how far off the body weight of a child in the sample is from a healthy reference child. Reference values are extracted
from WHO (2013). As the survey only provides information on age in full years, the monthly reference values for
medians and standard deviations are averaged to annual values. This procedure is admittedly non-standard, but
provides at least some information for adverse effects on very young children.
9
including health, education and food items.
9
The variable health expenditures is calculated
as the sum of expenditures devoted to health purposes (including doctor fees or purchases of
medicine) per household member.
10
4.2 Data on drought incidence
The major part of studies on the micro-level consequences of health shocks rely on the survey
respondents’ subjective perception of what they consider an adverse weather shock and when
this shock is ”severe” enough to have a significant impact on the household. These subjective
measures certainly have the distinct advantage of being theoretically more precise at the local
level than information from spatially aggregated data. Subjectivity, however, is boon and bane
at the same time and the subjective measures suffer from both practical and methodological
shortcomings (Thomas et al. 2010). Self-reported measures can hardly assess varying severities
of weather shocks precisely and are subject to over- and underreporting bias related to the
vulnerability of the household in question. Two households experiencing the very same objective
rainfall conditions might differ in their shock perception for that they took different strategies
ex ante to limit their shock exposure. Similarly, the availability of formal and informal insurance
networks can influence the perception about shocks. It is easily imaginable, for instance, that
households whose economic costs were partly shared with third parties are less likely to report
the shock in a survey setting (Thomas et al. 2010). Finally, being asked for subjective shock
assessments during an externally-commissioned survey might induce a problem of moral hazard.
For these reasons, this paper uses external data on local rainfall conditions obtained from
satellite images to measure drought. As Thomas et al. (2010) point out, this method has
the further advantage that empirical findings have higher external validity in that variations in
climatic conditions are more easily available outside the sample. Subjective measures cannot be
easily extrapolated to other contexts where answers to specific survey questions are not at the
researcher’s disposal.
While there is no single indicator for drought and, from a meteorological perspective, the
incidence of drought is not only about precipitation, shortfalls in rain are consentaneously seen
as the key driving factor behind drought. The common practice to objectively measure drought
is to compare actual rainfall against its long-term historic mean. For the subsequent analysis,
the variation of rainfall is recorded at the district level, the next lower tier in the Vietnamese
administrative system after provinces. To identify local variation in rainfall conditions, the
9
That is, health expenditures are recorded after potential compensatory behavior by other members in the
household.
10
Whenever monetary values are used in the analysis, amounts have been converted to 2005 PPP USD to allow
for comparability across waves.
10
analysis uses high-resolution precipitation value grids with data on current and historic rainfall
patterns. The grid cells are matched to the 30 districts in the household survey by taking the
mean values of all grid cells that fall within the district boundaries. The historic rainfall distri-
bution is estimated based on monthly weather data from the Global Precipitation Climatology
Product (GPCC) in the 50-year period from 1960 to 2010 (DWD 2013), recorded at a resolution
of 0.25 degrees (about 28 kilometers at the equator). Data on actual rainfall is obtained from the
National Oceanic and Atmospheric Administration (NOAA) which provides daily precipitation
estimates for all years covered by the household survey, recorded at a resolution of 0.1 degrees
(about 11 kilometers at the equator).
11
These daily values are summed up to yield an estimate
of rainfall for every month and every district between 2006 and mid-2013.
Given actual and historic average precipitation, there are various ways to construct a drought
index. The preferred indicator for the empirical analysis builds on absolute deviations of
rainfall from the historic mean. To be precise, three-months rolling averages of actual and
historic precipitation are calculated. A month is then defined to be dry in the sense of this
paper whenever the average rainfall in this three-month window differs negatively from the
historic average. Using rolling averages, this measure therefore allows for some inter-annual
compensation, when shortages of rain are immediately preceded or followed by excess rain. The
three-month window is commonly regarded as being most suitable to build agricultural drought
indices as it reflects the moisture conditions of the soil (McKee et al. 1995; Sims et al. 2002;
Vicente-Serrano 2006). To obtain a drought severity indicator that can be matched to the
reference period of the household survey, the absolute differences between normal and actual
rainfall are added up in all these ’dry’ periods to get an annual figure.
12
Hence, by exploiting
only variations in rain shortfall and thus only considering when rainfall deviates negatively
from the historic mean, this drought severity indicator has more variation than existing rainfall
measures, that have been used in earlier studies on the effects of drought (e.g. Maccini and
Yang 2009). In the appendix to the empirical analysis, this preferred indicator is benchmarked
against (i) an indicator based on a one-month time scale, (ii) an indicator that allows for any
interannual compensation of rainfall, and (iii) an indicator based on the length of drought spells
within the year (see section A.2 in the appendix). The indicator based on the cumulative total of
any absolute negative deviations in rainfall from historic averages, based on 3-months-windows,
is found to have the highest explanatory power for the outcomes of interest. The empirical
11
The data can be publicly accessed at />12
Another possibility would be to consider drought-like conditions only in agriculturally relevant growing
seasons. Due to mixed cropping being common in rural Vietnam, it is, however, difficult to unambigously specify
these periods. Also, some farmers plant different types of crops at varying times of the year. Any bias that might
nevertheless result from the year-based method of aggregation is furthermore partially addressed through the
inclusion of province fixed-effects in the estimation. Within provinces, cropping patterns are more homogeneous.
11
Table 1: Descriptive Statistics
Mean Median SD Min. Max.
(1/0) Serious disease 0.13 0.00 0.34 0.00 1.00
Height (cm) 146.74 155.00 24.68 15.00 185.00
Weight (kg) 42.23 45.00 14.24 0.90 86.00
Body-Mass-Index (BMI) 19.78 19.56 2.22 13.74 28.23
(1/0) Drop in BMI 0.07 0.00 0.25 0.00 1.00
Weight-for-age z-score (< 5 years) -1.97 -2.05 1.47 -5.48 1.91
Age 29.43 25.00 18.94 0.00 80.00
(1/0) Male 0.50 0.00 0.50 0.00 1.00
Dependency ratio 1.66 1.50 0.69 0.00 6.00
Total consumption per capita 1133.84 979.26 682.70 114.37 5360.48
Health expenditures per capita 24.81 8.87 46.76 0.00 790.40
Health consumption share 0.04 0.01 0.06 0.00 0.47
Out-of-pocket food expenditures 216.80 164.18 249.60 33.97 2162.53
Agricultural income share 0.31 0.24 0.24 0.02 0.91
Income share off-farm employment 0.20 0.04 0.26 0.00 0.89
Resp. belongs to ethnic minority in village 0.04 0.00 0.20 0.00 1.00
Resp is Ede 0.10 0.00 0.31 0.00 1.00
(1/0) Health insurance 0.07 0.00 0.26 0.00 1.00
(1/0) Free health card 0.57 1.00 0.50 0.00 1.00
Social network for coping 0.57 1.00 0.50 0.00 1.00
Drought severity, 3-months average 447.68 450.12 198.01 54.90 993.40
Observations 39863
analysis furthermore uses province fixed-effects to model the relation between drought and
health. Province-specific differences in absolute rainfall, which might invalidate the comparison
of absolute rather than relative drought measures, are hence accounted for. For the empirical
analysis, this indicator is normalized between zero and one.
4.3 Descriptive statistics of the sample
Table 1 provides the summary statistics of the central variables used in the respondent-level
empirical analysis if the sample is pooled across all three waves. Regarding health outcomes,
the incidence of illness in the year before the survey among all individuals in the sample is
around 13 % and this average is quite stable over all four waves. Ha Tinh, being the poorest
province, features a rate of close to 14.5 % while in Hue as the relatively wealthiest province
only 12 % reported to be ill. The distribution of personal height and weight is in line with
what one would expect for a rural Vietnamese sample – with the average height being slightly
below the country-wide average. BMI figures lie in the range of 13 to 28. Roughly 7 % of
the sample which is older than 20 years of age suffered a drop of more than one standard
deviation in the BMI between two survey waves. Given an international reference population
of healthy children, weight-for-age z-scores as a measure of malnutrition for children below
five years are not surprisingly negative on average in the sample. Health expenditures per capita
vary between 0 and 790 PPP USD and the household of the average respondent in the sample
spends 4 % of its total budget on health items. Naturally, the health expenditures distribution
is highly right-skewed and the share is found to vary between 0 and 47 %. For comparison,
12
out-of-pocket food expenditures lie between 33 and 2162 PPP USD. There are varying degrees
of agricultural activity, as reflected in the income share from cropping and livestock. As for
other socio-demographic characteristics, the average age of the respondents is slightly below 30.
Roughly every third person is younger than the age of 20 and the group of people older than 60
make up some 8 % of the sample.
13
Furthermore, the sample is more or less equally split between
male and female household members.
Looking at the prevalence of formal insurance mechanisms among the rural population in the
three provinces, about two thirds of the people have access to some kind of health insurance,
i.e., either the free health insurance program for the poor (57 %) or some form of private
health insurance scheme (7 %). Many households in the rural parts of Vietnam also build up an
informal social network in order to be better prepared for and be better able to cope with adverse
economic shocks in times of need (Fafchamps and Lund 2003; Roggemann et al. 2013). These
informal networks consisting of relatives, friends, or neighbors are naturally hard to capture
without using well-designed economic experiments or in-depth social network analysis. As an
approximation, the household survey features a hypothetical lending question: ”Suppose you
would suddenly need 15 million Vietnamese Dong (VND).
14
Would you do any of the following
things?”, followed by a list of strategies including employment diversification, taking children
out of school, or using help from friends and relatives. The social network variable takes value 1
whenever a household states to take any strategy that involves help from friends, relatives, or
neighbors as an empirical proxy for the existence of an informal insurance network. Based on
this hypothetical lending scenario, slightly more than half of the respondents indicate to turn
to informal assistance from their social network in cases of hardship.
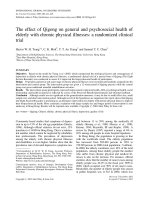
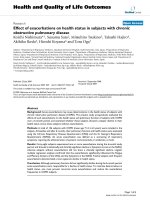
The final row of table 1 gives information about the prevalence of rainfall shortage in the sample
regions. Drought severity – the cumulated rainfall shortage over ’dry’ periods throughout the
year – varies between 55 and 993 mm. Figure 1 shows the exemplary distribution of rainfall and
the drought severity indicator for the third survey wave. In panel 1a, the annual precipitation
estimate is mapped for each district in Vietnam. Almost all districts exceed the cumulative
total 1000 mm. The southern regions as well as the region around the province of Hue can be
seen to have had more rainfall than the northern part or the southern coastal regions of the
country. However, this picture does neither reflect sub-annual developments nor does it account
for how particular periods within the year compared to long-term climatic averages and normal
provincial rainfall. Therefore, panel 1b depicts how the (normalized) drought severity indicator,
as described above, varies across the country. As in the empirical analysis, the indicators account
13
The sample is restricted to people below the age of 80.
14
15 mn VND ≈ 705 USD
13
Legend
739.515100 - 1036.338000
1036.338001 - 1189.117000
1189.117001 - 1301.228000
1301.228001 - 1412.037000
1412.037001 - 1539.166000
1539.166001 - 1694.154000
1694.154001 - 1899.810000
1899.810001 - 2140.008000
2140.008001 - 2384.518000
2384.518001 - 3864.989000
¯
Ha Tinh
Thua Thien Hue
Dak Lak
(a) Precipitation (mm)
Legend
0.000000 - 0.195511
0.195512 - 0.294291
0.294292 - 0.364181
0.364182 - 0.424525
0.424526 - 0.487189
0.487190 - 0.551312
0.551313 - 0.616162
0.616163 - 0.687104
0.687105 - 0.774546
0.774547 - 1.000000
¯
Ha Tinh
Thua Thien Hue
Dak Lak
(b) Drought severity, 3-months average (mm)
Figure 1: Rainfall and drought in Vietnam in the year before the third survey wave
for time-invariant province-specific level differences. With the survey regions outlined in bold,
there is some variation in drought severity within provinces for a given survey year. Together
with variation in rainfall conditions over time, these differences in drought severity will be
exploited to explain the variation in health outcomes in the survey data.
5 Results
5.1 How does drought affect health conditions?
The first part of the empirical results describes the impact of drought on individual-level
health outcomes. Table 2 relates the various health indicators to the severity of drought using
OLS regressions. All specifications include basic socio-demographic control variables at the
individual-level, province and survey wave fixed effects. Standard errors are clustered at the
household-level.
Overall, the results suggest that individuals who live in a district that was more affected by
drought on average show a significantly higher likelihood of suffering from a health shock while
14
Table 2: Determinants of health conditions at the household member level
(1) (2) (3) (4) (5)
Illness BMI BMI Shock WfA Weight
Drought severity, 3-months average 0.0922
∗∗∗
0.0944 0.0157 -0.2873 -0.5696
∗∗
(0.0154) (0.0971) (0.0186) (0.2384) (0.2818)
0-10 years -0.0888
∗∗∗
-33.4635
∗∗∗
(0.0072) (0.1989)
11-20 years -0.0972
∗∗∗
-11.0312
∗∗∗
(0.0068) (0.2114)
21-30 years -0.0755
∗∗∗
-0.2229
∗∗∗
0.0078 -0.0054
(0.0076) (0.0639) (0.0060) (0.1968)
41-50 years 0.0571
∗∗∗
-0.0545 -0.0019 -0.3921
∗
(0.0094) (0.0674) (0.0061) (0.2112)
51-60 years 0.1436
∗∗∗
-0.4360
∗∗∗
0.0128
∗
-1.5640
∗∗∗
(0.0118) (0.0812) (0.0071) (0.2562)
61+ years 0.2219
∗∗∗
-1.2858
∗∗∗
0.0338
∗∗∗
-5.3101
∗∗∗
(0.0132) (0.0861) (0.0081) (0.2617)
(1/0) Male -0.0128
∗∗∗
0.7552
∗∗∗
-0.0149
∗∗∗
0.0180 4.7781
∗∗∗
(0.0039) (0.0463) (0.0039) (0.0800) (0.1185)
Age -0.8620
∗∗∗
(0.1057)
Age-squared 0.1637
∗∗∗
(0.0215)
Total consumption per-capita, logged -0.0392
∗∗∗
0.5207
∗∗∗
-0.0181
∗∗∗
0.4840
∗∗∗
2.5552
∗∗∗
(0.0050) (0.0479) (0.0041) (0.0697) (0.1235)
Constant 0.3569
∗∗∗
15.7684
∗∗∗
0.2094
∗∗∗
-3.9532
∗∗∗
30.7267
∗∗∗
(0.0346) (0.3278) (0.0302) (0.5019) (0.8741)
Wave-FE Yes Yes Yes Yes Yes
Province-FE Yes Yes Yes Yes Yes
Observations 34293 19489 14504 1765 33717
Adjusted R
2
0.094 0.095 0.008 0.107 0.731
Mean of dependent variable 0.1417 19.7827 0.0683 -1.9681 41.7807
OLS regressions. Dependent variable: see first row.
Standard errors, clustered on household-level, in parentheses.
∗
p < 0.1,
∗∗
p < 0.05,
∗∗∗
p < 0.01
there is no robust impact on anthropometric health indicators. Column (1) in the table first
looks at the relation of drought and the simple incidence of serious illness. When comparing
across individuals and across all four survey waves, living in the most drought-affected district
compared to living in the least drought-affected district increases the probability of illness by
about nine percentage points. While this figure constitutes the largest effect possible in the
data, i.e., going to the extremes of the drought distribution, a change of one standard deviation
in the severity of drought (0.21) causes the propensity of illness to rise by two percentage points.
This effect is about one seventh of the average illness rate of 14 % in the sample population.
Restricting attention to malnutrition indicators for individuals above the age of 15, there is no
significant association between BMI levels or BMI drops and drought for the average person in
15
the sample (columns 3 and 4). For children below the age of 5, the results similarly suggest a
negative, but statistically insignificant link between drought and weight-for-age z-scores (column
5).
15
Taking again the full sample, the association of drought and simple body weight (column 6)
is found to be negative and also statistically significant.
As for the basic control variables, the OLS results in table 2 show intuitive patterns in relation
to the health indicators. Younger people have a lower propensity to get ill than adults while
vulnerability to BMI shocks tends to increase with age. There is some evidence for differential
gender effects in health with male respondents suffering less in terms of general illness and
displaying more robust anthropometric inidicators. As can be expected, household wealth,
measured by total per-capita consumption is associated with lower illness rates and better
anthropometric health indicators.
5.2 Transmission channels and determinants of vulnerability to drought
In order to mitigate the adverse effects of drought on health conditions, it is inevitable to identify
the most vulnerable parts of the population as target group for economic and social policy. Which
individuals are more or less affected by drought-related illness in turn depends on the precise
transmission channels in the drought-health nexus as well as on the ex-ante vulnerability and the
ex-post availability of coping mechanisms. To obtain heterogeneous effects of drought on illness
at the individual level, table 3 presents the results from regressions where the drought severity
indicator is interacted with socio-demographic and economic characteristics of each respondent.
According to column 1, there is no significant difference in the effect of drought between men
and women. As for the vulnerability of different age groups, there is some evidence that health
conditions of adults are more vulnerable to the exposure to drought than those of children and
adolescents (column 2). One rationale to this finding is that it is particularly the working age
population in the range of 20 to 50 years of age who suffer additional burden from drought
through increased everyday physical activity and possibly a less adequate nutritional intake.
As has been hypothesized in section 2, one major channel how drought impacts on health
arguably goes via a drop in agricultural income and therefore a deterioration of nutritional
supply. There is indeed a significant correlation of drought incidence and contemporary income
from agricultural activities in the data. Column 3 scrutinizes the role of the agricultural sector
by interacting drought with a measure of the household’s agricultural dependency. Specifically,
the respective dependency indicator is constructed from the share of income from crops in total
household income. To prevent bias from direct effects of drought, it is lagged by one period.
15
Here, age is added as continuous control variable.
16
Table 3: Demographic and economic determinants of vulnerability to drought
(1) (2) (3) (4) (5) (6)
Illness Illness Illness Illness Illness Rice price
Drought severity, 3-months average 0.0964
∗∗∗
0.1379
∗∗∗
0.0889
∗∗
0.2101
∗∗∗
0.0912
∗∗∗
0.0907
∗∗∗
(0.0171) (0.0283) (0.0372) (0.0442) (0.0289) (0.0087)
(1/0) Male -0.0093 -0.0128
∗∗∗
-0.0126
∗∗
-0.0161
∗∗∗
-0.0164
∗∗∗
(0.0072) (0.0039) (0.0052) (0.0044) (0.0046)
Age 0-10 -0.0888
∗∗∗
-0.0608
∗∗∗
-0.0868
∗∗∗
-0.0809
∗∗∗
-0.0807
∗∗∗
(0.0072) (0.0137) (0.0104) (0.0083) (0.0087)
Age 11-20 -0.0972
∗∗∗
-0.0685
∗∗∗
-0.1000
∗∗∗
-0.0871
∗∗∗
-0.0894
∗∗∗
(0.0068) (0.0129) (0.0092) (0.0075) (0.0079)
Age 21-30 -0.0755
∗∗∗
-0.0675
∗∗∗
-0.0844
∗∗∗
-0.0694
∗∗∗
-0.0735
∗∗∗
(0.0076) (0.0144) (0.0101) (0.0084) (0.0088)
Age 41-50 0.0571
∗∗∗
0.0677
∗∗∗
0.0475
∗∗∗
0.0617
∗∗∗
0.0574
∗∗∗
(0.0094) (0.0174) (0.0124) (0.0102) (0.0107)
Age 51-60 0.1436
∗∗∗
0.1726
∗∗∗
0.1360
∗∗∗
0.1533
∗∗∗
0.1493
∗∗∗
(0.0118) (0.0225) (0.0147) (0.0128) (0.0133)
Age 61+ 0.2219
∗∗∗
0.2490
∗∗∗
0.2277
∗∗∗
0.2375
∗∗∗
0.2425
∗∗∗
(0.0132) (0.0244) (0.0171) (0.0143) (0.0148)
Total consumption per-capita, logged -0.0392
∗∗∗
-0.0391
∗∗∗
-0.0390
∗∗∗
-0.0070 -0.0384
∗∗∗
(0.0050) (0.0050) (0.0063) (0.0063) (0.0056)
Crop income share, lagged -0.0518
∗
(0.0314)
Asset index, lagged -0.1132
∗∗
(0.0477)
Any off-farm income, lagged -0.0297
∗
(0.0180)
Off-farm income share, lagged 0.0849
∗∗
(0.0375)
Drought * Male -0.0084
(0.0146)
Drought * Age 0-10 -0.0662
∗∗
(0.0284)
Drought * Age 11-20 -0.0681
∗∗
(0.0272)
Drought * Age 21-30 -0.0183
(0.0310)
Drought * Age 41-50 -0.0249
(0.0363)
Drought * Age 51-60 -0.0694
(0.0465)
Drought * Age 61+ -0.0641
(0.0483)
Drought * Crop income share 0.1599
∗
(0.0842)
Drought * Asset index -0.4077
∗∗∗
(0.1236)
Drought * Any off-farm income 0.1112
∗∗
(0.0491)
Drought * Off-farm income share -0.2425
∗∗
(0.1030)
Wave-FE Yes Yes Yes Yes Yes Yes
Province-FE Yes Yes Yes Yes Yes Yes
Observations 34293 34293 17908 24921 23258 3418
Adjusted R
2
0.094 0.094 0.096 0.105 0.100 0.462
Mean of dependent variable 0.1417 0.6247
OLS regressions. Dependent variable: see first row.
Standard errors, clustered on household-level, in parentheses.
∗
p < 0.1,
∗∗
p < 0.05,
∗∗∗
p < 0.01
In case of a slump of agricultural production, one would expect to find the effect of drought to
prevail in households that are relatively more dependent on agriculture as income source. The
results indeed suggest that the effect of drought on individual illness prevails in households with
a greater dependency on agriculture as an income source. While higher agricultural incomes
17
are linked to better health conditions in normal weather conditions, they also induce a high
vulnerability of health to drought-like conditions.
Column 4 assesses to what extent vulnerability to drought depends on the asset position of a
household. As Thomas et al. (2010) point out, one might expect wealthier households to be
better able to smooth out negative consumption effects of drought if coping strategies involve
the selling of assets. The empirical results corroborate this hypothesis: When a lagged asset
index and its interaction with drought are added to the model, there is evidence that more
assets lower the incidence of illness (as does total per-capita consumption) and that members of
asset-rich households show significantly lower effects of drought on general illness. In fact, the
adverse effect vanishes for asset index values of around 0.5 which can be found in the highest
deciles of the asset distribution. Column 5 finally tests whether the availability of alternative
off-farm income sources in the household provides an intra-household insurance mechanism in
times of drought. The availability of sufficiently high alternative income sources (around 50 %)
within the household is found to lower the vulnerability to drought-related illness.
16
Taken together, the results from this analysis therefore lend some support to the hypothesis that
drought might impact on health through its adverse effect on the agricultural sector (income).
For another crude test to the role of agricultural dependency, column 6 presents household-level
estimates of the reduced-form relation between subjective rice price valuations and drought. In
the household survey, the household head reports at which price he sold his agricultural output
in the year of the survey. With paddy rice being one of the most widespread and commonly
planted crops, the regressions look at the relation between the incidence of drought and the
price of rice reported by the households in the second, third, and fourth survey wave.
17
While
admittedly being prone to measurement error, this source of information is currently the only
one to identify local variation in rice prices. The fact that a substantial part of the households is
engaged in rice production and rice is the single most important component of everyday nutrition
gives some confidence in the reported prices, however. Province fixed-effects account for rice
prices being hardly comparable across different provinces due to many unobserved determinants
of rice quality. The results suggest that drought on average triggers rice prices upwards. Taking
the point estimate, a change of one standard deviation in drought intensity is associated with
an increase of 0.02 PPP USD, roughly 3 % of the mean price in the sample.
16
These results hold when adding the lagged share of crop income to the model, such that the estimates for
high off-farm income shares are not just a reciprocal measurement of lower agricultural dependency.
17
Unfortunately, this information is absent from the first wave.
18
Table 4: Vulnerability to drought by insurance mechanisms
(1) (2) (3) (4) (5)
Illness Illness Illness Illness Illness
Drought severity, 3-months average 0.1060
∗∗∗
0.0876
∗∗∗
0.0923
∗∗∗
0.0793
∗∗∗
0.0876
∗∗∗
(0.0178) (0.0160) (0.0192) (0.0155) (0.0155)
Household part of HCFP 0.0367
∗∗∗
(0.0092)
HH member has private health insurance -0.0186
(0.0133)
Social network for coping 0.0111
(0.0097)
Ethnic fractionalization -0.0113
(0.0436)
Ethnic minority -0.0270
(0.0227)
Drought * HCFP -0.0325
∗
(0.0194)
Drought * Private health insurance 0.0366
(0.0244)
Drought * Social network -0.0005
(0.0200)
Drought * Ethnic fract. 0.2472
∗∗∗
(0.0873)
Drought * Ethnic minoriy 0.0908
∗
(0.0497)
Wave-FE Yes Yes Yes Yes Yes
Province-FE Yes Yes Yes Yes Yes
Other control variables Yes Yes Yes Yes Yes
Observations 34261 34293 34165 34293 33927
Adjusted R
2
0.095 0.094 0.094 0.095 0.095
Mean of dependent variable 0.1418
OLS regressions.
Standard errors, clustered on household-level, in parentheses. Control variables as in table 2.
∗
p < 0.1,
∗∗
p < 0.05,
∗∗∗
p < 0.01
5.3 The role of insurance
Table 4 sheds light on whether formal and informal insurance mechanisms in the household
help in alleviating the adverse effects of drought on illness. Some households in the sample
have access to formal insurance schemes, most importantly the HCFP scheme, that facilitate
access to health services in times of need. In addition, some respondents, albeit only few,
indicated to have bought private health insurance. Apart from these formal schemes, informal
insurance mechanisms, e.g., through social networks, are utilized to cope with the consequences
of drought. Previous experimental evidence on risk-sharing in rural Vietnamese villages has
furthermore emphasized the role of ethnicities in building up informal networks (Roggemann
et al. 2013). An index of ethnic fractionalization is constructed for each village in the sample
using established methodologies.
18
Finally, drought is interacted with an ethnic minority dummy
variable taking value 1 if the share of the respondent’s ethnicity in the village survey population
is below 50%.
Column 1 of table 4 disaggregates the effect of drought by whether a household is part of
18
The raw index can be interpreted as one minus the probability that two respondents from the survey sample
who randomly meet each other in the village are of the same ethnicity.
19
the HCFP health insurance scheme. Since the HCFP mainly targets household vulnerable to
poverty and economic shocks, it is reasonable that members of those households generally display
higher illness rates. Interestingly, however, being part of the program reduces the adverse effect
of drought on illness by about one third of non-HCFP respondents. Private health insurance is
not associated with a significantly lower incidence of illness (column 2). However, self-selection
effects might play a role here and prevent adding a causal interpretation: Individuals with worse
health conditions are more likely to buy private health insurance in the first place. In turn,
the allocation of HCFP among the households is clearly targeted and self-selection should not
matter to a great extent. Turning to the availability of social networks and ethnic affiliation,
there is no statistically significant evidence for differential drought-related health effects by the
availability of social networks, as defined above (column 3). There is some indication that
households in more ethnically diverse villages and ethnic minorities suffer disproportionately
more from drought-related health shocks (columns 4 and 5). Most of the heterogeneous villages
are located in the Dak Lak province, however, which attenuates the causal interpretation of
these results.
5.4 The impact of drought on the household budget
After the previous sections have revealed that the occurrence of drought leads to a deteriora-
tion of health conditions, the subsequent analyses seek to quantify the costs associated with
drought-related health shocks. More precisely, it is estimated how much additional monetary
health expenditures are spent in a household that suffers one or more drought-related health
shocks. The main explanatory variable of interest is henceforth the incidence of illness within
one household. The socio-demographic characteristics are also aggregated to the household-level
by calculating the share of male household members as well the shares that specific age groups
make up in the household. Furthermore, the household size as well as the dependency ratio in
the household are added as control variables to account for economies of scale in the household
health budget. All specifications to follow include time and province fixed-effects to capture
changes in Vietnam’s health sector over time and province-specific differences in household
(health) budgets. As the dependent variable is inflated at zero, left-censored Tobit and IV-Tobit
models are estimated.
19
The main results are summarized in table 5.
In terms of the demographic structure of the household, the results generally suggest that
households with a higher share of elderly have higher per-capita health expenditures while
household with younger members have relatively lower health expenditures. Larger households
19
Including the interaction of drought and agricultural dependency in the first stage does not alter the results
significantly. Due to the loss of one wave, the simple linear specification is preferred.
20
Table 5: The effect of drought-related health shocks on the household budget
(1) (2) (3) (4)
Tobit IV-Tobit Income group 1 Income group 2
Drought severity, 3-months average 0.2294
∗∗∗
0.2844
∗∗∗
0.1661
∗∗∗
(0.0409) (0.0583) (0.0572)
(1/0) Illness in household 28.3412
∗∗∗
144.3339
∗∗∗
90.9538
∗∗
235.7083
∗∗
(2.0165) (38.4743) (39.3939) (92.5911)
Share 0-10 years -51.2913
∗∗∗
-3.1080 -0.4151
∗∗∗
-28.0724 -0.3373
∗∗∗
92.8489 -0.6211
∗∗∗
(8.6743) (18.9824) (0.0494) (18.5267) (0.0659) (59.8204) (0.0764)
Share 11-20 years -38.2905
∗∗∗
-3.6172 -0.3020
∗∗∗
-24.6611
∗
-0.2184
∗∗∗
69.7055 -0.4830
∗∗∗
(7.9785) (14.8058) (0.0457) (13.9147) (0.0609) (47.7422) (0.0717)
Share 21-30 years -23.0009
∗∗∗
6.7170 -0.2561
∗∗∗
-11.8199 -0.1294
∗∗
52.4932 -0.4023
∗∗∗
(8.7505) (14.2114) (0.0481) (13.2518) (0.0627) (41.9482) (0.0782)
Share 31-40 years -8.9015 40.3972
∗∗
-0.4232
∗∗∗
11.5276 -0.2645
∗∗∗
88.5973 -0.5675
∗∗∗
(9.4510) (19.9839) (0.0544) (17.1327) (0.0724) (56.9953) (0.0855)
Share 41-50 years 6.4091 55.0773
∗∗∗
-0.4157
∗∗∗
19.6675 -0.2793
∗∗∗
97.7105
∗
-0.5037
∗∗∗
(9.7903) (19.8594) (0.0511) (16.8121) (0.0675) (52.0140) (0.0830)
Share 51-60 years 16.6661
∗
36.4874
∗∗∗
-0.1648
∗∗∗
3.3492 -0.0221 89.5885
∗∗
-0.3014
∗∗∗
(9.9445) (13.0201) (0.0510) (13.3867) (0.0672) (35.2000) (0.0811)
Share Male -0.7869 7.4549 -0.0725
∗∗
1.0229 -0.0660 12.3281 -0.0735
∗
(5.1591) (6.7406) (0.0300) (7.5422) (0.0409) (13.7590) (0.0440)
Household size -4.0212
∗∗∗
-6.8797
∗∗∗
0.0249
∗∗∗
-5.1584
∗∗∗
0.0300
∗∗∗
-11.4040
∗∗∗
0.0269
∗∗∗
(0.6291) (1.2279) (0.0040) (1.4702) (0.0057) (2.8505) (0.0057)
Dependency ratio 0.2915 -2.6271 0.0252
∗∗
-1.6898 0.0086 -3.7106 0.0333
∗
(1.8317) (2.4125) (0.0109) (2.4129) (0.0141) (5.7072) (0.0174)
Wave-FE Yes Yes Yes Yes Yes Yes Yes
Province-FE Yes Yes Yes Yes Yes Yes Yes
Observations 7380 7380 3648 3715
Mean of dependent variable 42.7786 35.5372 49.9694
Median of dependent variable 14.7071 12.4163 17.7375
Dependent variable: Health expenditures (PPP USD).
Robust standard errors in parentheses.
∗
p < 0.1,
∗∗
p < 0.05,
∗∗∗
p < 0.01
21
are found to have less per-capita health expenditures on average, which points to the existence
of economies of scale in health care expenditures.
Before turning to the analysis of the causal drought-health-expenditure nexus, column 1 presents
reduced-form estimates of the relation between health conditions and health expenditures as a
benchmark. As can be expected, a rising share of ill household members is associated with
more expenditures allocated for health purposes. The response of the budget is relatively weak,
estimated at about 28 PPP USD only. This is less than one quarter of the average health
expenditure level in the sample. As has been argued, the reduced-form estimates are prone to
endogeneity, e.g., through unobserved household behavior and measurement error in the health
status variable. By taking only the subset of drought-related illness incidence, not only are
these pitfalls addressed, but also variation in health outcomes due to a relatively large and
arguably unanticipated weather shock can be understood. Columns (2) to (4) of table 5 report
the results from IV-Tobit estimation when the share of ill household members is instrumented by
the severity of drought. The first subcolumn reports the second stage while the last subcolumn
provides the results from the first stage.
Similar to the analysis on the household member level, the results show a strong association
between the severity of drought and the share of sick people in the household in the first stage.
In the pooled analysis with all income groups (column 2), going from the least drought-affected
to the most drought-affected district in the sample is estimated to lead to an increase in the
likelihood of illness in the household of roughly 23 percentage points.
20
Turning to the effect of drought-related health shocks on the household budget, the results in
column 2 suggest that drought-related illness has a major impact on the health component of
household consumption. If all income groups are pooled, drought-related illness incidence is
estimated to increase health expenditures by roughly 144 PPP USD. This is about 10 % of the
total annual per-capita consumption of the median household in the sample.
To get a better understanding of what the additional drought-related health costs imply for
a typical rural household in Vietnam, columns 3 and 4 provide seperate regressions for the
lower and the upper part of the sample’s wealth distribution.
21
The results show that in both
income groups, there is evidence for a positive and significant effect of drought-related illness
on the household budget – with an increasing response in asset wealth. For the lower part of
the distribution, the effect is estimated close to 90 PPP USD. The estimated response of the
20
Regarding the power of the instrument, we find the p-value in the first stage below 0.000 which provides
sufficient confidence in the relevance of the instrument.
21
The quartiles are assigned by a basic asset index in the first wave. The asset index shows a high correlation
with total household consumption, but is less prone to be affected by the direct effects of drought exposure in the
first survey wave.
22
health budget is around 10 % of median total per-capita consumption and some 18 % of what
the average households in that wealth group consumes as food throughout the entire year. The
analysis of the upper wealth group leads to similar conclusions with the response being 16 % of
average total per-capita consumption and 34 % of average food consumption. Consequently, the
additional expenditures due to drought-related illness can pose a non-negligible burden for many
households vulnerable to poverty, especially for the poorest households in the rural provinces
included in the analysis and when multiple health shocks occur within the same household.
6 Conclusion
Climate change is already a reality in many countries across the world. Especially developing
countries in the tropics are prone to excessive wet seasons that have started to deviate from
their traditional seasonal pattern several decades ago. Countries in South- and South-East
Asia with intensive Monsoon patterns are particularly prone to extreme weather events. As
a result, coastal countries such as Vietnam regularly face delayed rainfall which leaves entire
provinces with episodes of drought. Especially in rural Vietnam, whose economy continues to
predominantly depend on rice and other water-intensive crops, a lack of timely rainfall can be
devastating. Drought not only affects income streams but also has direct health effects.
The long-term impact of drought has been well established by the literature. These include
primarily increased child mortality. Surviving children are frequently affected by lower height-
for-age, often in combination with reduced cognitive abilities and lower income trajectories
during adult-life. The short-term health implications are less well established, and especially the
direct economic cost related to illness caused by drought is largely unknown at the micro-level.
This paper contributes to the existing literature by providing new estimates on the immediate
effects of drought on health outcomes and health-related expenditures for Vietnam. Combining
household panel data with local rainfall data, it is possible to establish a direct link between
periods of low rainfall, drought-related illness, and associated monetary health care expenditures.
In the econometric domain, the paper employs the established Instrumental Variable approach
based on an estimation strategy where the incidence of self-reported health shocks is estimated
using objectively measured rainfall events.
The results suggest that rural households affected by drought display a deterioration of health
conditions and have significantly higher health expenditures. There is evidence for drought to
increase the likelihood of illness, particularly in the working-age population. The effect is found
to be prevailing among households where income from agriculture and livestock makes up a
relatively large share of the household budget and where access to coping mechanisms such as
23