Báo cáo khoa học: Crystal structure of a designed tetratricopeptide repeat module in complex with its peptide ligand pot
Bạn đang xem bản rút gọn của tài liệu. Xem và tải ngay bản đầy đủ của tài liệu tại đây (1019.13 KB, 9 trang )
Crystal structure of a designed tetratricopeptide repeat
module in complex with its peptide ligand
Aitziber L. Cortajarena
1
, Jimin Wang
1
and Lynne Regan
1,2
1 Department of Molecular Biophysics & Biochemistry, Yale University, New Haven, CT, USA
2 Department of Chemistry, Yale University, New Haven, CT, USA
Introduction
The basic tetratricopeptide (TPR) repeat comprises 34
amino acids that adopt a helix–turn–helix structure
[1,2]. We refer to the two tandem helices as the A-helix
and B-helix. In tandem arrays of TPR repeats, the
helices stack to form superhelical structures that dis-
play two surfaces: a concave binding face, and a con-
vex back face. The natural role of TPR proteins is to
mediate protein–protein interactions. Modules with
three tandem TPR repeats are by far the most com-
mon in nature, and presumably represent the minimal
functional binding unit [1]. The simple modular nature
of TPR proteins makes them ideal scaffolds for protein
design studies.
We designed a TPR protein, named CTPR3, com-
posed of three repeats of a consensus TPR sequence,
and solved its crystal structure at 1.6 A
˚
resolution [3].
The structural alignment of CTPR3 with natural
3-TPR domains clearly shows that its overall structure
is almost identical, with backbone rmsd values between
1.1 A
˚
and 1.6 A
˚
for the pairwise alignments [4].
CTPR3 is significantly more stable than natural TPR
domains [3], and this enabled us to introduce muta-
tions onto this framework without compromising its
thermodynamic stability.
Starting with CTPR3 as a structural scaffold, we
created a protein (CTPR390) that incorporates heat
shock protein (Hsp)90-binding residues, grafted from
natural Hsp90-binding TPR domains, onto the con-
cave ligand-binding face of the domain (A-helices) [5].
We showed that CTPR390 binds to the C-terminal
peptide of Hsp90 [5] specifically, with moderate affinity
(K
d
of 200 lm). We also demonstrated that the binding
affinity could be modulated, and enhanced, by fine-
tuning the long-range electrostatic interactions through
modifying the charge on the back face of the protein
[6]. Finally, by introducing the designed domain into
Keywords
crystal structure; Hsp90; protein design;
repeat proteins; tetratricopeptide repeat
(TPR)
Correspondence
L. Regan, Department of Molecular
Biophysics & Biochemistry, Yale University,
New Haven, CT 06520, USA
Fax: +1 203 432 5175
Tel: +1 203 432 9843
E-mail:
Website: />(Received 26 October 2009, revised 25
November 2009, accepted 16 December
2009)
doi:10.1111/j.1742-4658.2009.07549.x
Tetratricopeptide repeats (TPRs) are protein domains that mediate key
protein–protein interactions in cells. Several TPR domains bind the C-ter-
mini of the chaperones heat shock protein (Hsp)90 and ⁄ or Hsp70, and
exchange of such binding partners is key for the heat shock response. We
have previously described the design of a TPR protein that binds tightly
and specifically to the C-terminus of Hsp90, and in doing so, is able to
inhibit chaperone function in vivo. Here we present the X-ray crystal struc-
ture of the designed TPR domain (CTPR390) in complex with its peptide
ligand – the C-terminal residues of Hsp90 (peptide MEEVD). This struc-
ture reveals two interesting aspects of the TPR modules. First, a new pack-
ing arrangement of 3-TPR modules is observed. The TPR units stack
against each other in an unusual fashion to form infinite superhelices in the
crystal. Second, the structure provides insights into the molecular basis of
TPR–ligand recognition.
Abbreviations
ASU, asymmetric unit; Hsp, heat shock protein; TPR, tetratricopeptide repeat.
1058 FEBS Journal 277 (2010) 1058–1066 ª 2010 The Authors Journal compilation ª 2010 FEBS
mammalian cells, we showed that it inhibited Hsp90
function, presumably by preventing Hsp90 from form-
ing a complex with the TPR2A domain of Hsp-
organizing protein (HOP) [6].
Here we describe in detail the X-ray crystal structure
of the designed Hsp90-binding TPR module, CTPR390,
in complex with the peptide MEEVD, which corre-
sponds to the five C-terminal residues of Hsp90. We
discuss the unusual superhelical head-to-tail crystal
packing between CTPR390 molecules, and compare it
with the superhelical packing observed for longer TPR
arrays (CTPR8 and CTPR20) [7]. Finally, we analyze
the TPR–peptide interaction in detail, thus providing a
structural comparison of natural and designed peptide
recognition by TPR modules. This work provides key
insights into the ‘functional grafting’ design strategy,
and also sets the stage for the design of a second
generation of TPR modules with modified binding
properties.
Results
Overall crystal structure
The structure of the complex between the C-terminal
Hsp90 peptide and the designed TPR module
CTPR390 was refined to an R-value of 27.1% (free
R-value 28.2%), using all reflections between 30 A
˚
and
2.85 A
˚
resolution (Tables 1 & 2). The crystallographic
asymmetric unit (ASU) contains five monomeric
CTPR390 molecules with one 5-mer peptide (MEEVD)
bound in the concave cleft of each TPR subunit
(Fig. 1A). The stereochemical parameters of the refined
model are good (Table 2), with 98.2% of all nongly-
cine residues located in the ‘most favorable’ region and
the remaining 1.8% nonglycine residues located in the
‘additionally allowed’ regions of the Ramachandran
plot.
Crystal packing – head-to-tail packing
The parent protein, CTPR3, crystallized as a monomer
with two molecules in the ASU. It was therefore some-
what surprising to find that CTPR390 forms ordered
superhelical structures in the crystal (Fig. 1B–D).
A superhelical arrangement has been previously
observed in the crystal forms of CTPR8 and CTPR20
[7]. The packing in CTPR390 crystals, however, is dif-
ferent. The CTPR390 units stack head to tail and form
continuous pseudoinfinite crystalline helical ‘fibers’,
which are arranged in a hexagonal symmetry lattice
(Fig. 2A,B). In the CTPR8 and CTPR20 crystal forms,
the ASU was composed of only part of the molecule
(two or four repeats), so the ends of the molecules
could not be located in the electron density map, and
the full-length structures were reconstructed by apply-
ing crystal symmetry and unit cell translations [7]. By
contrast, with CTPR390, we observed five molecules in
the ASU, and the discontinuity in the electron density
that defines the end of each CTPR390 molecule was
clear, allowing us to place the five individual units in
the ASU (Fig. 1B,D). Each CTPR390 unit is com-
posed of three TPR repeats (AB-helix pair) and an
additional C-terminal capping helix (A
cap
). The only
way for molecules AB–AB–AB–A
cap
to arrange on
‘head-to-tail’ packing is if the C-terminal A
cap
-helix is
displaced to allow B3–A1¢ intermolecular packing.
This effect was observed previously in the CTPR8 and
CTPR20 crystal forms [7].
CTPR390 superhelix – comparison with long TPR
arrays
The superhelical pitch for the CTPR390 superhelix is
approximately 56 A
˚
, the diameter is 41.4 A
˚
, and the
superhelical twist is 51.4°. Seven repeats form an
almost complete superhelical turn (Fig. 3A,B). CTPR8
and CTPR20 structures displayed similar supehelical
conformations, but with eight repeats per superhelical
Table 1. X-ray data collection statistics.
CTPR390–Hsp90
Space group R3
Unit cell dimensions a = b = 100.67 A
˚
, c = 161.57 A
˚
Wavelength (A
˚
) 1.1001
Resolution (A
˚
) 50–2.85 (2.95–2.85)
R
merge
(%)
a
7.5 (39.7)
I ⁄ rI
a
21.18 (1.16)
Completeness (%)
a
99.4 (99.7)
Redundancy
a
5.18 (5.28)
v
2a
1.180 (0.928)
Total reflections 28 406
Unique reflections 13 180
a
Values in parentheses correspond to the highest-resolution bin.
Table 2. Model refinement statistics.
CTPR390–Hsp90
Resolution (A
˚
) 30–2.85
R
work
⁄ R
free
27.1 ⁄ 28.2
Number of atoms 4440
Protein ⁄ ligand atoms 4422
Solvent atoms 18
Average B-factor 35.28
Average B-factor peptide 102.95
rmsd bond length (A
˚
) 0.005
rmsd angles (°) 0.708
Ramachandran plot (% most favored) 98.2
A. L. Cortajarena et al. Structure of designed TPR module–ligand complex
FEBS Journal 277 (2010) 1058–1066 ª 2010 The Authors Journal compilation ª 2010 FEBS 1059
turn and therefore a twist of 45°, with pitch values
varying from 67 A
˚
to 72 A
˚
and diameter varying from
38 A
˚
to 42 A
˚
between different crystal forms [7]. We
have previously published a detailed comparison of the
superhelices formed by the CTPR proteins and the
superhelix formed by the TPR domain of the enzyme
O-linked GlcNAc transferase [8], showing that the two
superhelices are similar [7]. The superhelix in
CTPR390, even though it is similar to that previously
observed in CTPR8 and CTPR20, is more compressed,
and presents a larger curvature, with one fewer repeat
per superhelical turn. These differences are clear when
the first three repeats of the CTPR390 superhelix are
superimposed onto the three N-terminal repeats of
CTPR8, as shown in Fig. 3C. The N-terminal repeats
align well, with an rmsd value of 0.897 A
˚
, but because
of the differences in the superhelical twist, the two
structures differ more and they do not overlap well
towards the C-terminal repeats. The fact that 3-TPR
units from CTPR390 align well with 3-TPR units of
CTPR8 or CTPR20 indicates that, rather than the
inter-repeat packing, the intermolecular packing is
probably responsible for the pitch and diameter differ-
ences between the two structures.
Structure of individual CTPR390 molecules
Considering the individual 3-TPR units, the structure
of CTPR390 is almost identical to the structure of the
parent protein, CTPR3 [3]. CTPR3 is the consensus
protein, which contains no binding residues. CTPR390
has Hsp90-specific residues ‘grafted’ onto the binding
surface of CTPR3 [5]. The pairwise backbone align-
ment of CTPR3 (Protein Data Bank ID: 1Na0) and
A
B
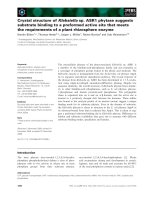
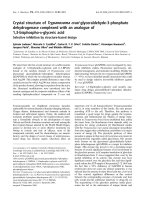
Fig. 2. Crystal packing of CTPR390. (A) R3 crystal lattice in the XY
plane. The crystal axes (x, y, z) and the positions of the three-fold
symmetry operators (black triangles) are indicated. The yellow box
represents the unit cell. The arrows indicate the long axis of the
crystalline superhelices. (B) Axial view of the crystalline superhelic-
es in hexagonal arrangement. For simplicity, only the superhelices
running in one direction in the crystal are shown to depict the hex-
agonal symmetry. The crystal axes (x, y, z) are indicated. The
yellow box represents the unit cell.
ADBE
C
C
E
C
A
B
D
E
A
B
D
A
C-termini
N-termini
A
C
D
B
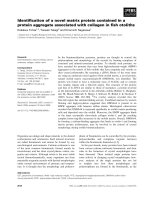
Fig. 1. Crystal structure of CTPR390–Hsp90 peptide complex. (A)
The ASU is shown in ribbon representation, with each CTPR390
unit colored differently (chain A, green; chain B, cyan; chain C,
magenta; chain D, yellow; chain E, orange). The chains are labeled
in the figure with their identification letters. The five Hsp90 peptide
ligands (G, H, I, J, and K) are shown as gray ribbons. (B) Ribbon
representation of a superhelix formed by five CTPR390 subunits,
reconstructed by applying crystal symmetry and unit cell transla-
tions. The color code for the different CTPR390 chains is the same
as in (A). (C) Axial view of the superhelix in (B). (D) Schematic rep-
resentation of the CTPR390 subunits packing in the infinite supe-
rhelices in the crystal form [same color code as in (A–C)].
Structure of designed TPR module–ligand complex A. L. Cortajarena et al.
1060 FEBS Journal 277 (2010) 1058–1066 ª 2010 The Authors Journal compilation ª 2010 FEBS
CTPR390 has an rmsd value of 0.738 A
˚
(Fig. 3D).
When we calculate pairwise alignments of CTPR390
molecules within the ASU, we obtain rmsd values in
the range 0.433–0.682 A
˚
, only slightly smaller than the
values observed for the CTPR390–CTPR3 compari-
son. The conformation of CTPR390 with the Hsp90
peptide ligand bound is thus very similar to the
ligand-free CTPR3 structure. This result lends strong
support to our hypothesis that CTPR3 is a stable
framework onto which we can introduce mutations to
change the binding specificity without affecting the
structure of the protein. In addition, this result con-
firms our previous observation that TPR modules
undergo little or no structural change upon ligand
binding [4].
CTPR390–peptide complex
CTPR390 binds specifically and with moderate affinity
(K
d
of 200 lm) to the C-terminal peptide of Hsp90 [5].
CTPR390 accommodates the Hsp90 peptide in its con-
cave binding groove (Fig. 4A). The MEEVD peptide is
in an extended conformation, very similar to that seen
in the cocrystal structure of the TPR2A–MEEVD pep-
tide complex (Protein Data Bank ID: 1elr) [9]. TPR2A
is a natural Hsp90-binding TPR from Hsp-organizing
protein.
The resolution of the structure that we present is
only 2.85 A
˚
, and when the structure was refined with
no peptides modeled, electron density in the binding
pockets of all five TPR units in the ASU was clearly
evident. The Hsp90 peptide was built into this density,
starting with the peptide from the TPR2A–Hsp90 com-
AB
CD
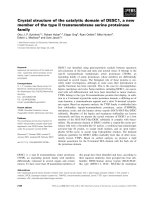
Fig. 3. CTPR390 superhelix. (A) Molecular surface representation
of one superhelical turn of CTPR390 (green) and CTPR8 (blue); the
dimensions of the superhelices are shown. (B) Molecular surface
representation of the CTPR390 superhelix in axial view. The diame-
ter of the superhelix is shown. (C) Overlay of CTPR390 (green rib-
bon) and CTPR8 (blue ribbon) superhelices. Backbone alignment of
the first three N-terminal repeats of CTPR8 and CTPR390 chain C.
The N-termini and C-termini of the superhelices are labeled. The
A-helix and B-helix of the first repeat are also labeled. (D) Pairwise
alignment of the CTPR390 structure (chain C in magenta) and the
CTPR3 structure (Protein Data Bank ID: 1Na0 in blue). The N-ter-
mini and C-termini of the proteins and the A-helices and B-helices
of the three repeats are labeled.
AB
CD
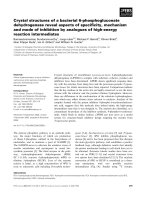
Fig. 4. X-ray crystal structure of CTPR390 in complex with the
C-terminal peptide of Hsp90. (A) CTPR390–Hsp90 complex (protein
chain C and peptide chain I). The backbone of CTPR390 is shown
as a ribbon representation, and the side chains of the TPR residues,
which directly interact with the peptide, are displayed as yellow
sticks. The C-terminal Hsp90 peptide is shown as sticks in purple.
(B) 2F
o
– F
o
electron density maps for two of the peptide chains in
the ASU: peptide chain I. (C) Overlay of the five peptide chains
(G, H, I, J and K chains). The peptide backbones are aligned, giving
an rmsd value of 0.298 A
˚
. (D) Overlay of two peptide chains (I in
magenta, and J in yellow) bound to two CTPR390 molecules in the
ASU (C and D, respectively). The two views are related by 90° rota-
tion about a vertical (y) axis. Only the protein chain backbones, and
not the peptide chains, were overlayed, giving an rmsd value of
0.441 A
˚
.
A. L. Cortajarena et al. Structure of designed TPR module–ligand complex
FEBS Journal 277 (2010) 1058–1066 ª 2010 The Authors Journal compilation ª 2010 FEBS 1061
plex [9]. The 2F
o
– F
c
electron density map for one
peptide in the asymmetric unit (Fig. 4B, peptide I)
shows that the peptide is well defined in the complex.
Positional noncrystallographic symmetry constraints
between the five peptide chains in the ASU were used
during the refinement. In the final stages of the refine-
ment, the noncrystallographic symmetry constraints
were released, and the five peptide chains in the ASU
adopted slightly different locations relative to the TPR
domains. When the backbones of the peptides are
aligned, the five peptide molecules show almost identi-
cal conformations, giving an rmsd value of 0.298 A
˚
(Fig. 4C). On the other hand, when the backbones of
their corresponding TPR protein chains are overlayed,
the average rmsd value of the pairwise peptide chains
is 3.172 A
˚
. Figure 4D shows two views, related by 90°
rotation, of the overlay of peptide chains I and J, and
illustrates the conformational variability between the
different peptide chains relative to the TPR domains.
This result implies that the peptide chains can reorient
as rigid bodies in the binding pocket. The average
B-factor for atoms in the peptides is higher than the
average B-factor for atoms in the protein (Table 2),
which again may be a reflection of the mobility of the
peptide chain in the binding pocket. This conforma-
tional variability could exist because not all of the
TPR–peptide interactions that are seen in the TPR2A–
peptide complex are reproduced in the CTPR3–peptide
complex. Such interactions are discussed in detail in
the next section [5].
Atomic details of the CTPR390–Hsp90 interaction
Analysis of the detailed interactions in the CTPR390–
Hsp90 complex is presented for one of the complexes
in the ASU: chains C (TPR) and I (peptide) (Fig. 4A),
for which the electron density for the peptide is the
clearest, and the confidence in the conformation of the
peptide within the complex is the highest.
The dissociation constant for the CTPR390–MEE-
VD interaction is 200 lm [5], whereas the dissocia-
tion constant of the TPR2A–MEEVD interaction
11 lm [9]. A comparison of the cocrystal structures
of TPR2A and CTPR390 in complex with the MEE-
VD peptide provides an explanation for the lower
affinity of the designed protein.
The backbone overlay of CTPR390 and TPR2A
protein chains gives an rmsd value of 1.632 A
˚
, and
shows that there are no large differences in the
arrangement of the conserved peptide-binding residues.
Rather, the major differences in the complexes are in
the location of the peptide chains relative to the pro-
tein (Fig. 5A). The Hsp90 peptide is located in the
CTPR390 concave cleft further away from the protein
than it is in the TPR2A domain. Accordingly, in the
TPR2A–Hsp90 complex, there are more extensive and
closer interactions between the protein side chains and
the peptide, which probably contribute to the tighter
binding affinity.
We analyzed in detail the interactions present in the
designed complex, in which we introduced Hsp90-
specific binding residues, mimicking the TPR2A
binding interface. Consequently, we expected to find in
the CTPR390 protein interactions comparable to those
present in the naturally occurring Hsp90-binding TPR
domains.
A large energetic contribution to the binding of the
peptide MEEVD to TPR2A comes from interactions
of the EEVD motif with five conserved ‘carboxylate
clamp’ residues on the binding face of the TPR [9].
CTPR390 was generated by grafting these residues,
and three additional Hsp90-binding specific residues,
onto its concave binding face. The five residues that
form the carboxylate clamp in CTPR390 (Lys13,
Asn17, Asn48, Lys78, and Arg82) are equivalent to the
residues in TPR2A (Lys229, Asn233, Asn264, Lys301,
and Arg305). The overlay of the Ca atoms of these five
binding residues gives an rmsd value of 0.565 A
˚
(Fig. 5A), as compared with the rmsd value of 1.632 A
˚
when the entire TPR domains are aligned. When the
‘clamp residues’ are aligned, the superposition of the
two Hsp90 peptides shows that the C-terminal residues
of the peptides align reasonably well and present the
same overall conformation. At the N-terminus of the
peptide, the alignment diverges more, with the major
difference being that the N-terminal Met is signifi-
cantly further away from the binding cleft in the
CTPR390–MEEVD complex than in the TPR2A–
MEEVD complex (Fig. 5A).
Figure 5B,C shows detailed schematic diagrams of
the TPR–ligand interactions for CTPR390 and
TPR2A, respectively, generated using ligplot [10]. The
electrostatic interactions and hydrogen-bonding inter-
actions mediated by the conserved carboxylate clamp
residues for the TPR2A–Hsp90 and CTPR390–Hsp90
complexes are tabulated and compared in Table 3.
The CTPR390–Hsp90 complex reproduces most of
the key interactions present in the TPR2A–Hsp90
complex. In the CTPR390–Hsp90 structure, the water
molecules cannot be located clearly, so the interactions
present in the TPR2A–Hsp90 complex mediated by
water molecules could not be placed in the CTPR390–
Hsp90 complex (which does not mean that they are
not present). Additionally, for most of the interactions,
the distances between the interacting atoms are greater
in the CTPR390–Hsp90 complex than in the TPR2A–
Structure of designed TPR module–ligand complex A. L. Cortajarena et al.
1062 FEBS Journal 277 (2010) 1058–1066 ª 2010 The Authors Journal compilation ª 2010 FEBS
Hsp90 complex (Table 3), which could explain the
weaker binding affinity relative to the TPR2A–Hsp90
domain.
In addition to the electrostatic interactions, hydro-
phobic interactions also contribute to the TPR–peptide
affinity. The total surface area buried upon complex
formation between the TPR and the MEEVD peptide
was calculated using getarea [11]. In the CTPR390–
MEEVD complex, 810 A
˚
2
of surface area is buried
upon complex formation, which is slightly smaller than
the surface area buried in the TPR2A–Hsp90 complex
(930 A
˚
2
) [9].
The hydrophobic residue Val4 of the Hsp90 peptide
is accommodated in a hydrophobic pocket formed by
Asn233, Asn264 and Ala267 in TPR2A. A comparable
hydrophobic pocket is formed by Asn17, Tyr20, Asn48
and Asn51 in CTPR390 (Fig. 5B,C). In these two
cases, the total surface area buried upon binding of
the Val is virtually identical (128 A
˚
2
versus 137 A
˚
2
).
Met1 of the Hsp90 peptide is also engaged in tight
hydrophobic interactions with a cavity mainly formed
by the side chains of Tyr236 and Glu271 of TPR2A
(Fig. 5C). However, in the CTPR390–Hsp90 complex,
although an equivalent Tyr is present (Tyr55), there is
a Lys (Lys55) at the Glu271 position that pushes the
Met outside of the binding pocket. Therefore, Met
does not contribute to the binding, resulting in a
weaker binding affinity (Fig. 5A,B).
A comparison of the average B-factors for the resi-
dues in the MEEVD peptide show that the C-terminal
Asp has a B-factor of 84, whereas the N-terminal Met
has a B-factor of 125. These values provide additional
support for the notion that the Met is not engaged in
specific interactions with the protein. Therefore, the
Met probably has more conformational flexibility than
A
B
C
Fig. 5. CTPR390–Hsp90 interactions and comparison with the
TPR2A–Hsp90 complex. (A) Overlay of the five carboxylate clamp
residues of the CTPR390–Hsp90 (magenta) and TPR2A–Hsp90
(blue) complexes. The side chains of the protein residues and the
two Hsp90 peptides are shown in stick representation. The identi-
ties of the residues in both the CTPR390 (top) and TPR2A (bottom)
domains and the N-termini and C-termini of the peptides are indi-
cated. (B) Schematic 2D diagram of CTPR390–Hsp90 peptide inter-
actions (chains C and I). The schematic was generated from the
pdb file of the complex with
LIGPLOT [10]. The interactions shown
are those mediated by hydrogen bonds and by hydrophobic con-
tacts. Hydrogen bonds are indicated by dashed lines between the
atoms involved, and hydrophobic contacts are represented by an
arc with spokes radiating towards the ligand atoms that they con-
tact. The contacted atoms are shown with spokes radiating back.
(C) Schematic representation of TPR2A–Hsp90 peptide interactions
generated as in (B) from the pdb file of the complex (Protein Data
Bank ID: 1elr) [9].
A. L. Cortajarena et al. Structure of designed TPR module–ligand complex
FEBS Journal 277 (2010) 1058–1066 ª 2010 The Authors Journal compilation ª 2010 FEBS 1063
the Asp, which displays many specific contacts with the
protein (Table 3). The change in surface area associated
with the Met upon binding to CTPR390 (34 A
˚
2
)is
small in comparison with the change upon binding to
TPR2A (142 A
˚
2
), also corroborating the lack of specific
interaction mediated by the Met. Indeed, the difference
in surface area buried by the Met between the two
complexes accounts for the total difference in surface
area buried upon peptide binding between CTPR390
and TPR2A. It has been reported that deletion of the
Met increases the dissociation constant of the TPR2A–
Hsp90 complex from 11 lm to 90 lm [9]. Therefore,
the lack of this interaction in the CTPR390–peptide
complex will partially contribute to the moderately
weak binding affinity of the designed TPR module.
Discussion
In this article, we present the cocrystal structure of a
designed TPR domain with its partner peptide.
We show that this 3-TPR domain can adopt a
superhelical structure in the crystal similar to those
reported for long TPR arrays [7]. This result illustrates
the natural tendency of TPR domains to stack head to
tail and self-assemble into an ordered macrostructure
in crystals. We have seen no evidence for such associa-
tion in solution.
We previously showed that, by grafting the binding
residues from a given natural TPR domain onto a con-
sensus scaffold, we could incorporate the binding
activity in the newly designed domain. This structure
proves that the new domain obtained using this ‘graft-
ing’ strategy mimics not only the binding activity [5,6],
but also the interactions at a molecular level between
the protein and the ligand. This result confirms the
TPR domains as a stable protein scaffold where, by
grafting the binding residues, one can interchange the
binding activities between domains.
Additionally, this work allows us to compare the
structure of the consensus CTPR3 domain without
ligand and the designed CTPR390 (with a total of only
12 mutations relative to the parent CTPR3) with
ligand bound. These two structures overlap almost per-
fectly, supporting our previous observations that TPR
domains bind their target peptides without undergoing
any major conformational changes [4].
Finally, the detailed understanding of the molecular
basis of the CTPR390–Hsp90 recognition opens the
door to a second generation of rationally improved
CTPR modules. For example, it is clear from the
structure that Asn51 and Lys55 from CTPR390 are
pushing the peptide out of the hydrophobic pocket,
and therefore the N-terminal Met of the peptide does
not contribute to the binding energy. In TPR2A, these
residues are Ala267 and Glu271. One would expect
that introducing these mutations in the CTPR390 scaf-
fold might improve its binding affinity for Hsp90
peptide.
Experimental procedures
Protein design
CTPR390 incorporates Hsp90-binding residues in the con-
cave face of the consensus 3-TPR domain (CTPR3) [3,5]. The
sequences of the first, second and third A-helices of CTPR390
are as follows: first A-helix, AEAWKNLGNAYYK; second
A-helix, ASAWYNLGNAYYK; and third A-helix, AKA-
WYRRGNAYYK. The B-helix sequence in all of the TPR
repeats in CTPR390 is
DYQKAIEYYQKALEL, which
differs from the negatively charged back sequence of the
Table 3. TPR–peptide electrostatic interactions in the carboxylate clamp. For the data for hydrogen-bonding interactions, we have been gen-
erous in the constraints in order to show all the possible interactions, and how they differ between the two complexes.
TPR2A–Hsp90 interactions CTPR390–Hsp90 interactions
Residue in TPR Residue in peptide Distance (A
˚
) Residue in TPR Residue in peptide Distance (A
˚
)
K229 D5 (OXT) 2.68 K13 D5 (OXT) 3.09
N233 D5 (OXT) 2.83 N17 D5 (OXT) 3.99
N264 D5 (OXT) 2.83 N48 D5 (OXT) 2.94
D5 (NH) 2.96 D5 (NH) 3.18
H
2
O–D5 (OD2) 2.68–3.03 – –
K301 D5 (OD1) 2.63 K78 D5 (OD1) 2.87
D5 (OD2) 3.04
R305 E3 (O) 2.73 R82 E3 (O) 2.64
H
2
O–E3 (NH) 3.13–2.71 – –
E2 (OE1) 2.78 E2 (OE1) 2.79
E2 (OE1) 3.10
Structure of designed TPR module–ligand complex A. L. Cortajarena et al.
1064 FEBS Journal 277 (2010) 1058–1066 ª 2010 The Authors Journal compilation ª 2010 FEBS
CTPR3 scaffold, DY DEAIEYYQKALEL. Underlining indi-
cates the solvent-exposed charged residues [5].
Cloning of the CTPR390 gene
The gene encoding CTPR390 was constructed as previously
described and cloned into the pProEx-HTA vector to incor-
porate a cleavable N-terminal His-tag (GibcoBRL,
Gaithersburg, MD, USA) [5,12]. The identity of the
construct was verified by DNA sequencing (W.M. Keck
Facility, Yale University, New Haven, CT, USA).
Protein expression and purification
CTPR390 was overexpressed and purified as previously
described [5]. As a final purification step to obtain high-
purity protein for crystallization, the protein was run on a
size exclusion column (HiLoad Superdex HR-75; Amer-
sham Bioscience, Uppsala, Sweden). The protein concentra-
tion was determined by UV absorbance at 280 nm, using
extinction coefficients at 280 nm calculated from amino
acid composition [13].
Protein crystallization and data collection
Purified CTPR390 at 20 mgÆmL
)1
protein in 10 mm
Tris ⁄ HCl and 50 mm NaCl (pH 7.5) was mixed with the
C-terminal five amino acids of Hsp90 (Ac-MEEVD-COOH
peptide) at a protein ⁄ peptide ratio of 1 : 4. Microbatch-
under-oil screening at the high-throughput crystallization
laboratory at the Hauptman-Woodward Medical Research
Institute Inc. (HWI, Buffalo, NY, USA) [14] identified few
preliminary crystallization conditions. We could reproduce
one crystallization condition [0.1 m NaH
2
PO
4
, 40% (w ⁄ v)
poly(ethylene glycol) 20000, 0.1 m Caps, pH 10.0] in our
laboratory. We optimized this condition by the sitting-drop
vapor diffusion method, using two-fold diluted initial for-
mulation as the well solution. The final crystallization condi-
tion contained 50 mm NaH
2
PO
4
, 20% (w ⁄ v) poly(ethylene
glycol) 20000, and 50 mm Caps (pH 10.0). The well solution
was mixed in equal volumes (2 lL) with a protein–peptide
complex solution (1 : 4 molar ratio) at 30 mgÆmL
)1
protein
concentration. Crystals appeared within a week at 20 °C,
and reached sizes of approximately 80 · 80 · 50 lm within
2 weeks. Crystals were flash-cooled under a nitrogen gas
stream (100 K). Data were collected to 2.85 A
˚
resolution at
the NSLS beamline X12C (Brookhaven National Labora-
tory). The data collection statistics are shown in Table 1.
Structure determination and refinement
We used hkl2000 [15] to index, scale and integrate the
data. The protein crystallized in space group R3 with unit
cell dimensions of a = b = 100.67 A
˚
, c = 161.57 A
˚
, and
a = b =90°, c = 120°. The CTPR390 structure was
solved by molecular replacement using molrep [16] in the
ccp4i suite [17]. The structure of the consensus TPR with-
out the solvating helix was used as search model [CTPR3
(Protein Data Bank ID: 1NA0] [3]. There were five TPR
molecules in the ASU. The structure was refined with cns
[18] and refmac5 [19], with TLS refinement [20] in the late
stages of the refinement, to a resolution of 2.85 A
˚
. Iterative
rounds of refinement and manual model adjusting in coot
[21] were performed until R-factors converged to a final
value of R (R
free
) = 28.4 (29.2) for the structure of the
TPR molecules. The ligand peptide (MEEVD) was built in
the F
o
–F
c
difference electron density map. First, one peptide
chain was built in the CTPR390 molecule in the ASU with
strongest positive density, using a backbone conformation
for the Hsp90 peptide from the TPR2A–Hsp90 complex as
starting model (Protein Data Bank ID: 1elr) [9]. The model
with one copy of the Hsp90 peptide was refined and the
additional four peptide chains were built by symmetry oper-
ations of the refined peptide chain in the binding pockets of
the other protein chains. The complete model was further
refined. Water molecules were automatically added in coot,
and were validated with the electron density maps. The final
model with one peptide molecule in the binding groove of
each of the five TPR molecules in the ASU converged to
R (R
free
) = 27.1 (28.2). The geometry and stereochemical
properties of the model were checked with molprobity [22].
Crystallographic statistics are shown in Table 2.
Coordinates
The X-ray structure of the CTPR390–Hsp90 peptide com-
plex has been deposited in the Protein Data Bank as 3KD7.
Acknowledgements
We thank members of staff at NSLS beamlines X12C
and X6A, BNL, where data were collected. The high-
throughput crystal screening service of the Hauptman-
Woodward facility assisted in identifying initial
crystallization conditions. We thank T. Kajander for
his advice during the crystallization process and data
collection. We thank staff members and users of the
Yale Center for Structural Biology for valuable
insights during the structure-solving and refinement
process. We thank R. Collins, T. Grove, R. Ilagan, M.
Jackrel, L. Kundrat and G. Pimienta-Rosales for valu-
able discussions and comments on the manuscript.
References
1 D’Andrea L & Regan L (2003) TPR proteins: the versa-
tile helix. Trends Biochem Sci 28, 655–662.
A. L. Cortajarena et al. Structure of designed TPR module–ligand complex
FEBS Journal 277 (2010) 1058–1066 ª 2010 The Authors Journal compilation ª 2010 FEBS 1065
2 Blatch GL & Lassle M (1999) The tetratricopeptide
repeat: a structural motif mediating protein–protein
interactions. Bioessays 21, 932–939.
3 Main ERG, Xiong Y, Cocco MJ, D’Andrea L & Regan
L (2003) Design of stable alpha-helical arrays from an
idealized TPR motif. Structure 11, 497–508.
4 Cortajarena AL & Regan L (2006) Ligand binding by
TPR domains. Prot Sci 15, 1193–1198.
5 Cortajarena AL, Kajander T, Pan W, Cocco MJ &
Regan L (2004) Protein design to understand peptide
ligand recognition by tetratricopeptide repeat proteins.
Protein Eng Des Sel 17, 399–409.
6 Cortajarena AL, Yi F & Regan L (2008) Designed TPR
modules as novel anticancer agents. ACS Chem Biol 3,
161–166.
7 Kajander T, Cortajarena AL, Mochrie SG & Regan L
(2007) Structure and stability of a consensus TPR
superhelix. Acta Crystallogr D 63, 800–811.
8 Jinek M, Rehwinkel J, Lazarus BD, Izaurralde E,
Hanover JA & Conti E (2004) The superhelical TPR-
repeat domain of O-linked GlcNAc transferase exhibits
structural similarities to importin alpha. Nat Struct Mol
Biol 11, 1001–1007.
9 Scheufler C, Brinker A, Bourenkov G, Pegoraro S, Mo-
roder L, Bartunik H, Hartl FU & Moarefi I (2000)
Structure of TPR domain–peptide complexes: critical
elements in the assembly of the Hsp70–Hsp90 multi-
chaperone machine. Cell 101, 199–210.
10 Wallace AC, Laskowski RA & Thornton JM (1995)
LIGPLOT: a program to generate schematic diagrams
of protein–ligand interactions. Protein Eng 8, 127–134.
11 Fraczkiewicz R & Braun W (1998) Exact and efficient
analytical calculation of the accessible surface area and
their gradient for macromolecules. J Comput Chem 19,
319–333.
12 Kajander T, Cortajarena AL & Regan L (2006)
Consensus design as a tool for engineering repeat
proteins. Methods Mol Biol 340, 151–170.
13 Pace CN, Vajdos F, Fee L, Grimsley G & Gray T
(1995) How to measure and predict the molar absorp-
tion coefficient of a protein. Prot Sci 4, 2411–2423.
14 Luft JR, Collins RJ, Fehrman NA, Lauricella AM,
Veatch CK & DeTitta GT (2003) A deliberate
approach to screening for initial crystallization condi-
tions of biological macromolecules. J Struct Biol 142,
170–179.
15 Otwinowski Z & Minor W (1997) Processing of X-ray
diffraction data collected in oscillation mode. Methods
Enzymol 276, 307–326.
16 Vagin AA & Teplyakov A (1997) MOLREP: an auto-
mated program for molecular replacement. J Appl Crys-
tallogr 30, 1022–1025.
17 Collaborative Computational Project, Number 4
(1994) The CCP4 suite: programs for protein crystal-
lography. Acta Crystallogr D 50, 760–763.
18 Bru
¨
nger AT, Adams PD, Clore GM, DeLano WL,
Gros P, Grosse-Kunstleve RW, Jiang JS, Kuszewski J,
Nilges M, Pannu NS et al. (1998) Crystallography &
NMR system: a new software suite for macromolecular
structure determination. Acta Crystallogr D 54,
905–921.
19 Murshudov G, Vagin A & Dodson E (1997) Refinement
of macromolecular structures by the maximum-likeli-
hood method. Acta Crystallogr D 53, 240–255.
20 Winn M, Isupov M & Murshudov GN (2001) Use of
TLS parameters to model anisotropic displacements in
macromolecular refinement. Acta Crystallogr D 57,
122–133.
21 Emsley P & Cowtan K (2004) Coot: model-building
tools for molecular graphics. Acta Crystallogr D 60,
2126–2132.
22 Lovell SC, Davis IW, Arendall WBI, de Bakker PIW,
Word JM, Prisant MG, Richardson JS & Richardson
DC (2003) Structure validation by C-alpha geometry:
phi, psi, and C-beta deviation. Protein Struct Funct
Genet 50, 437–450.
Structure of designed TPR module–ligand complex A. L. Cortajarena et al.
1066 FEBS Journal 277 (2010) 1058–1066 ª 2010 The Authors Journal compilation ª 2010 FEBS