Segmenting the markets for savings among the poor across countries potx
Bạn đang xem bản rút gọn của tài liệu. Xem và tải ngay bản đầy đủ của tài liệu tại đây (710.74 KB, 18 trang )
v3.0
1
Segmenting the markets for savings
among the poor across countries
Report prepared for the Bill and Melinda Gates Foundation
By
Bankable Frontier Associates
1
, Somerville MA
Executive summary
Findings:
• We analyze macro-level FinScope datasets from seven African countries and a micro-
level household panel from South Africa and find quantitative evidence supporting
savings patterns observed elsewhere: the poor do save, using a variety of formal and
informal savings instruments, and a substantial percentage save proportionately more
than higher income neighbors within the same community.
• The strong take-up in South Africa of a new category of basic bank accounts
demonstrates the strong desire for appropriate formal products among those who have
never banked before. Attitudes towards savings differentiate those among the poor
who adopted the product as their first bank account ever from those who did not.
However, the ‘dropout’ rate, at 23% of adopters, is high.
• Merely opening or having a savings account is not the same as using it regularly. Savings
may also be measured by its intensity of saving (how much of income is saved) as well
as its duration (the period over which it accumulates before being accessed). The
portfolio of savings in financial instruments is categorized into four clusters by duration
and formality; and the flows into each cluster are quantified.
Implications for a strategy to scale up savings of the poor:
• The objective must be carefully specified: merely counting new savings accounts
opened does not capture underlying savings activity; and given the already high
intensity of savings, poor people may be unable to save much more as a proportion of
income. However, households may choose to rebalance their portfolio of financial
assets towards safer and longer duration instruments which match their timing needs.
This re-balancing effect should also be measured following new product introduction.
• In order to test a business case, and/or justify subsidy, the potential size of the savings
market among the poor needs to be measured. This could be done by segmenting the
likely market using the combination of a basic standard national survey, building on the
methodology developed by Fin-Scope, and a more detailed look at household flows
provided by the micro-level study.
• We quantify here the possible effect if poor households were to rebalance their
portfolios of financial assets using actual numbers from South Africa: more than $159
million may flow into formal savings instruments within a year.
Recommendations
• We recommend the collection of baseline data in each country which enables a
baseline to be drawn; and further research into adoption patterns of successful savings
patterns in order to inform segmentation of the market for savings. In particular, there
is value in analyzing cases where additional savings options have been added to basic
bank accounts so that households can easily diversify their savings portfolio.
1
This report was written by a project team comprising David Porteous, Daryl Collins, Jeff Abrams and David Toniatti.
Marguerite Robinson has provided useful comments throughout.
v3.0
2
!" #$%&'()* %+'$,
The microcredit movement has demonstrated that poor people can and do repay loans. We
have known for a while that poor people also can and do save (Rutherford 2000, Robinson
2004). However, discussions about savings instruments and behavior often remain
undifferentiated: Central banks publish average national household savings rates which cover a
multitude of household types and circumstances; and providers offer ‘one size fits all’ savings
products. But who actually saves among the poor? And how?
One of the lessons from rapid growth of consumer credit is the need to differentiate among
potential customers—not only in terms of their risk worthiness but also their propensity to
behave in certain ways. Better segmentation and understanding of the potential market for
savings instruments is helpful in at least two respects: First, by enabling better market sizing,
it can help financial institutions assess the business case for building ‘big pipes’, that is, basic
bank accounts offered en masse which can be used for saving. Such accounts are also usually
the first step for unbanked people on the ladder of formal financial instruments. We accept
that such ‘pipe-laying’ is indeed necessary as an initial approach to connect large numbers to
the formal financial system. However, it may not be sufficient to sustain regular usage of the
new accounts or to serve the different savings needs of many of the newly-connected. A next
phase of product development, based on finer segmentation, may offer more tailored and
wider-ranging product features. Second, then, finer segmentation supports the development of
‘add-on’ savings products which service diverse needs.
This paper examines how different groups among the poor are saving based on evidence arising
from two data sources which are further described in immediately following sub-sections:
• for cross-country analysis and single country adoption analysis, we draw on cross-country
FinScope datasets from seven African countries, which have not been used for this purpose
before;
• in South Africa, we use a 2004 micro-level household panel called the Financial Diaries,
which track all the income, expenditure and financial flows of a small sample of poor and
relatively poor households over a ten month period.
These sources allow us to explore potentially useful means of segmentation of the savings
markets in these countries, as the basis for strategies by financial providers, government and
donors to scale-up savings. Specifically, the paper addresses the following questions:
• In section 2, what does evidence from the take-up of a new basic bank account by first
time users among the poor in one of the countries (South Africa) tell us about adoption
patterns for basic formal instruments?
• In section 3, how to define and measure savings, and who are savers by these definitions?
In addition to considering evidence on individual instrument usage, we specifically
construct a portfolio of savings instruments used by the poor based on flows and balances
held in different classes of financial instruments.
• Finally, in section 4, how large is the potential market for savings instruments among the
poor? We illustrate the implications of one approach, based on using actual numbers of
portfolio distribution combined with assumptions on adoption, to yield an initial estimate.
1.1 FinScope household survey data
FinScope surveys, developed by FinMark Trust, ask in detail about the usage of and attitudes
toward financial instruments by the adult population as a whole in a country. FinScope surveys
have been completed in seven countries in southern and east Africa, Botswana, Namibia, South
Africa, Kenya, Tanzania, Uganda and Zambia, with the field work mostly in 2005 and 2006. The
average sample size was around 3000 respondents in each country, together representing some
86 million individuals. These will be known here as the ‘FinScope countries’. The surveys are
designed to be nationally representative of adult individuals, and in most countries, the true
number likely (with 95% confidence) to fall with a range of 5% above or below the weighted
v3.0
3
survey number. Questionnaires differ somewhat among the countries, affecting to some extent
the ability to undertake cross country econometric analysis.
2
FinScope data enables savers to be defined based on their declared usage of savings
instruments, from a pre-coded list of options which differ somewhat by country and are listed
in Annex A. These options include informal options, such as savings clubs, alongside formal
options such as bank accounts, but focuses on financial instruments other than personal ones:
in other words, cash savings in the home, with a money guard or savings in the form of
livestock are not included here, although these options are offered in certain FinScope surveys.
1.2 The Financial Diaries
The Financial Diaries (“Diaries”) dataset seeks to understand the usage of financial instruments
by poor households at a detailed level. The Diaries continuously tracked a full set of cash flows
across 152 households (“the Diaries households”) from February through November 2004.
The Diaries methodology is distinct from FinScope in at least two relevant ways. First, the
Diaries use the household as the unit of analysis, which is helpful because money is fungible
through the household. For instance, one member may be saving while the other is borrowing
(or otherwise dissaving), and presumably this is related to the household’s overall cash
management strategy. Second, one-off surveys can tell us whether a respondent has a certain
instrument and even if he/she uses that instrument, but it falls short of telling us the intensity
with which it is used. The Diaries data measures such intensity (e.g., how often and to what
extent a particular instrument is used) and therefore allows us to analyze usage more deeply.
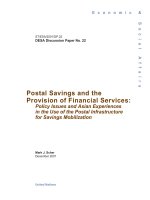
Table 1 below shows the range of the Diaries’ household incomes while Figure 1 shows the LSM
profile of the Diaries population compared to the total population.
Table 1: Financial Diaries Sample by US$ per day income
3
(% of households)
Urban
Rural
Overall sample
Below $2
2%
22%
10%
$2 - $5
28%
36%
31%
$5 - $10
31%
22%
28%
Above $10
39%
19%
32%
2
We are grateful to FinMark Trust for allowing access to FinScope SA data which is owned by a consortium of mainly
private funding organizations for the purposes of this research.
3
Dollar per day calculations are done by taking average daily income per capita in South African rand, deflating by a
factor of 1.98 to convert from 2004 to 1993 prices, then dividing by a PPP exchange rate factor of 1.67 to arrive at a
dollar per person per day figure for each household. Note that had average daily per capita been adjusted using 2004
market exchange rates rather than 1993 PPP exchange rates, 32% of the sample would have been considered below $2
per day, rather than the 10% shown. Where ZAR is converted to US$, the average exchange rate for the Diaries period
of 6.50/US$ is used.
Box A: Definitions of poverty
The standard measure, $2 per head per day Purchasing Power Parity (PPP)-adjusted, can be used
only for the Financial Diaries sample, but not for the cross-country FinScope surveys, since
household income is not collected in all countries, and when it is, it is within bands which do not
conform to the cutoff thresholds.
Other measures can be applied to get similar results from FinScope. In South Africa alone, in
which more detailed analysis is undertaken, we used:
• Living Standard Measures (LSMs), which are segmentation tools used in consumer
marketing in South Africa. The LSM is a wealth proxy, calculated entirely on observable
goods, which runs from 1 (very poor and rural) to 10 (wealthy and urban) (see Annex B).
LSM1-3 constitute 33% of the SA population, roughly equivalent to the number (30%) living
on under $2 per capita per day in Bannerjee & Duflo (2007). In local terms, LSM1-5 are
considered financially underserved, and are targeted in the Financial Services Charter,
designed to increase financial access to the previously ‘unbanked’.
• Questions asked by FinScope about hunger and basic services, such as those who report
that their household has experienced some shortage of food or a lack of clean drinking
water, which can be combined into a poverty proxy.
Since LSMs are not measured in the other FinScope countries and the questions about hunger and
services are not consistently asked across all, in cross-country econometrics, we use a simple
quality of housing indicator as a poverty proxy.
Note that only 10% of Diaries households qualified as poor under the application of the $2 per day
measure (see Table 1); whereas 19% were in LSM 3 (see Figure 1). All Diaries households live in
what are regarded locally as poor communities and indeed all are at or below LSM6, and most
below LSM5; but when speaking of the poor here, we focus on households in LSM3.
v3.0
4
Figure 1: Diaries and LSM distribution
Source: Financial Diaries and FinScope SA 2006 for LSM
-" .#/,0'),1)+2(,+%3,%450,6+22,*'7589,,:4',*'75;3,<$(,64 5$=,
The supply of appropriate formal savings instruments is so suppressed in most developing
countries that when a suitable instrument is offered, the take-up is often overwhelming. This
has been the experience of leading banks like Indonesia’s BRI and Kenya’s Equity. But who
comes, and how quickly? These parameters are sometimes little understood but are vital for
making the business case for ‘laying large pipes’, that is, for a new savings product roll out.
South Africa’s so-called “Mzansi” bank account offers a case study to analyze adoption patterns
using FinScope data across time. Mzansi is a brand name of a category of basic bank accounts
with similar features which was launched in late 2004 by a consortium of four large commercial
banks and the state-owned Postbank, as a coordinated effort to increase financial access.
Features of the Mzansi account include inter alia: (i) low or no minimum balance, (ii) no
monthly service charge, (iii) at least one free monthly deposit, (iv) nominal interest of up to
3.25%, and (v) various other transactions (deposit, withdrawal, bank transfers, payments, etc.)
via multiple channels (e.g., branch, ATM, P.O.S. and some internet and/or mobile banking) at
fees set by each institution. Mzansi therefore embodies many basic elements of good design for
basic bank accounts. Thus, at a minimum, Mzansi allows holders to save money in a regulated
institution via free monthly deposits, without having savings eroded by minimum fees.
4
The take-up of Mzansi among the previously ‘unbanked’ has been impressive. After less than 2
years from product launch, almost two million individuals had opened and kept Mzansi
accounts
5
and of these, 1.2 million (60%) had never before had a bank account (“Mzansi 1
st
timers”).
6
76% of all Mzansi 1
st
-timers said the purpose of opening an account was to save. The
client base of Mzansi in 2006 is also quite evenly distributed across income terciles, as shown in
Table 2: in this, Mzansi compares favorably with other large savings programs highlighted in a
recent WSBI study (2008), in particular Bansefi of Mexico. However, whereas the savings banks
shown below are government institutions, Mzansi is a consortium of private and public banks.
The private banks launched Mzansi in terms of their commitments to development under the
Financial Sector Charter; all feared cannibalizing their existing account holder base and some
have subsequently complained that the revenues on the new accounts are not sufficient for
4
However, worth noting is that the nominal interest rate paid (up to 3.25%) is lower than recent inflation.
5
By 2006, although 2,518,946 had adopted it, because 573,972 dropped out, only 1,944,474 still held an account.
6
At 2007, 3,925,804 people had adopted Mzansi, of whom 77% still had it, hence 23% of all adopters had dropped out.
Of those who still had it, 65% were Mzansi 1
st
-timers, similar to the proportion for all adopters.
v3.0
5
them to sustain the offering. The question of profitability (or the need for subsidy) makes it all
the more important that adequate market sizing is undertaken for such new products so that
returns, whether for state or private institutions, can be undertaken.
Table 2: Client base of Mzansi compared to that of large government savings banks
!"#$%&'()*+, '
!/01+,#.'
!2-34-3+ '
!536+ '
!2&-+7-36.'
Mzansi'
8-390)+'
2:8'
;"5'
2&-+'<" 8'
% of clients in:
Poorest third
26%
32%
14%
13%
32%
Next third
35%
33%
24%
28%
42%
Top third
39%
35%
61%
59%
26%
Source: WSBI (2008)
To understand the pattern of Mzansi adoption, we compare Mzansi 1
st
-timers to those already
banked (some of whom also opened a Mzansi account) and to the unbanked in the country; we
also look at Mzansi ‘dropouts’. Table 3 below provides background data to highlight several
relevant issues about who has taken up the Mzansi offering:
• Young people (ages 16-29) were much more prevalent among ‘Mzansi 1
st
-timers’ than they
were among the ‘non-Mzansi banked’ segment: In 2006, young people represented 62% of
Mzansi 1
st
-timers and only 29% of non-Mzansi banked. Thus, relative ‘youth’ positively
influenced Mzansi adoption.
• There is a dramatic difference between the ‘banked’ and ‘unbanked’ with respect to
expressed behavior such as working to a budget: 70% of the banked and only 23% of the
unbanked claim to do so. At 55%, Mzansi 1
st
-timers are closer to the banked than
unbanked; in other words, there is a significant correlation between working to a budget
and Mzansi use/adoption, although the available data alone cannot prove causality.
• Also, there is a significant difference between the ‘banked’ and ‘unbanked’ with respect to
attitudes towards savings: of the ‘banked’, 40% say they “sacrifice to save” and 69% say
they “try to save regularly”; compared to 12% and 16%, respectively, for the unbanked.
Mzansi 1
st
-timers are much more like the banked in this respect too: 46% say they “sacrifice
to save” and 55% “try to save regularly”.
• Mzansi has had a relatively high penetration in rural areas: Just as 40% of all South Africans
are rural, 39-40% of all Mzansi users/adopters are rural, much higher than the proportion
among those banked through other products.
• A substantial proportion (23%) of Mzansi adopters had dropped it by year-end 2006; the
dropout rate for Mzansi 1
st
-timers was essentially the same (22%).
=
Table 3: Comparison of Mzansi to Non-Mzansi Banked and Unbanked (2006 Finscope data)
''
'
'
(77'/4-39+'
(6#>%0*9'
!+3,7$6+3?'
6*#>#$%9.'
'
/4-39+'
@$**03% '
A90*9'
!01,7$6+3?'
6*#>#$%9.'
/4-39+'B
9%
C
%+D0*9'
!-36'
,$**03%7E'
$9+3?.'
/4-39+'
6*#>#$%9'
8-3F06G'3#%'
/4-39+'B9%C
%+D0*'#*'
6*#>#$%'
A3H-3F06G'
3#%'/4-39+'
6*#>#$%'
2#%-7'
:#>$7-%+#3'
;$DH0*'
2,518,946
1,944,474
1,157,451
573,972
14,486,846
14,918,530
31,136,800
I'#)'%#% -7'>#>$7-%+#3'
8%
6%
4%
2%
47%
48%
100%
I'+3'0-,&',#7$D3'?*#$>J'
Demographics:'
7
Finscope 2006 data did not allow further analysis of the breakdown of Mzansi dropouts between Mzansi-1
st
-timers and
non-1
st
-timers; however, Finscope 2007 data does allow this, and can be analyzed for this in the future.
v3.0
6
(?0'BKCLM'
51%
49%
62%
57%
29%
43%
37%
(?0'NOCPQ'
44%
47%
36%
33%
55%
38%
46%
R$*-7'
40%
39%
42%
41%
28%
67%
40%
53,#D0J'S#*D-7'0D>7#ED03%'
28%
30%
20%
23%
51%
5%
27%
53,#D0J'<#T0*3D03%'?*-3%'
33%
33%
36%
33%
18%
27%
24%
U"/'BCN'
28%
26%
31%
35%
15%
51%
33%
U"/'QCP'
39%
35%
38%
51%
26%
32%
30%
U"/'KCBO'
34%
39%
31%
14%
59%
17%
37%
Attitudes:'
807+0T0' 9-T+3?9'-,,$D$7-%0'
72%
78%
72%
53%
81%
54%
67%
%*E'%#'9- T0'*0?$7-*7E'
53%
54%
55%
50%
69%
16%
43%
9-,*+)+,0'%#'9-T0'
40%
41%
46%
39%
40%
12%
27%
V#*F'%#'-'H$6?0% '
56%
57%
55%
51%
70%
23%
47%
6#3W%'%*$9%'+3)#*D-7'?*#$>9'
42%
46%
42%
27%
55%
38%
46%
W9-T0*9W'!&-T0'XB'9-TY'539%*Y.'
85%
100%
100%
36%
92%
5%
50%
As a big ‘pipe-building’ project, Mzansi appears successful: within three years of product
launch, it connected 2.5 million (15%) of the previously-unconnected. The material differences
in adoption rates across distinct segments could be helpful in designing future large-scale
rollouts. However, the substantial dropout rate (23%) also suggests the need to go beyond
measuring success merely in terms of accounts opened; and to look at underlying patterns of
usage and who is most likely to continue using. While one-size-fits-all can make very beneficial
strides as a ‘phase one’ approach, there is also a need for ‘phase two’ follow-up offerings, in
order to increase meaningful usage and, in turn, increase customer retention rates.
>" ?'@+$A,150'$(,%< B5C)D3,%',75<;)& 5,);<A5,'/,;<@+$A;,;5&@+*5;",
3.1 Defining and measuring savings
A key issue in analyzing savings behavior is how to define savings. At one level, savings
constitutes all additions to household net worth, where the wealth is likely to be held in
physical assets as well as financial assets. Figure 2 below shows the breakdown of net worth
between financial assets and physical assets at the beginning and end of the study. Physical
assets (including illiquid home values which are inherently hard to value) certainly make up the
larger proportion of net worth; however, simply because someone holds more physical assets
than financial assets should not imply a firm “preference” for saving in physical over financial.
It may rather simply reflect an ongoing lack of viable financial alternatives in which to
accumulate long-term savings. Diaries households did not actively “save” in physical assets
during the year – the value of physical assets barely changed at all. Financial assets, on the
other hand, were actively used and actively grew over time. The median household grew
financial assets at a rate of 14% in just under a year. A key question emerging from Figure 2 is:
if households are able to mobilize relatively so much financial savings in this period, then why
have they not accumulated financial assets over time so that they represent a larger share of
net worth? A large part of the answer is that households are able to save a great deal in
financial assets over the short term, but may be unable or unwilling to accumulate them over
the long-term, an issue we return to in Section 3.1.3.
Figure 2: Total asset profile of Financial Diaries households (US$)
v3.0
7
We now consider three different definitions of financial savings and their measures in the
available data:
• The usage of financial instruments;
• The intensity of savings (savings flows in financial instruments as a % of household
income); and
• The duration of savings (the period over which savings balances accumulate, either by
instrument or aggregated).
3.1.1 Reported savings instrument usage
FinScope and the Diaries ask respondents which instruments they use. The available list of
savings instruments from FinScope South Africa and the Diaries is compared below, along with
their categorization as ‘regulated’ or not, based on the status of the provider.
Table 4: Instrument definitions
Instrument
Category
FinScope SA
Financial Diaries
Mzansi account
Regulated
X
Savings book at a bank
Regulated
X
Savings/Transaction account
Regulated
X
Post Bank account
Regulated
X
x
8
Fixed Deposit bank account
Regulated
X
Money market account
Regulated
X
Endowment/Investment/Savings
policy
Regulated
X
Education policy
Regulated
X
Retirement annuity
Regulated
X
X
Provident fund
Regulated
X
X
8
The Diaries tracks “bank accounts”, but does not distinguish details within that general category. Mzansi had not
been launched at the time of the Diaries.
v3.0
8
Pension fund
Regulated
X
Stokvel/umgalelo/savings club
Non-Regulated
X
Other savings club (e.g. church)
Non-Regulated
X
X
9
Savings in the house
10
Non-Regulated
X
Money guard
Non-Regulated
X
The instrument-based definition is therefore that a ‘saver’ uses at least one instrument from
the list provided. While this definition is perhaps easiest to measure, the difficulty with this
approach is that the full list of possible instruments has to be quite long. If there are missing
categories on the pre-coded survey list or if respondents do not adequately understand the
items on the list, the response rate may be lower than expected. Also, the exact list of
instruments offered varies in each FinScope country in order to capture the options considered
most appropriate to that country (see Annex A).
Applying the instrument-based definition results in the cross-country profiles shown in Table 5
below. Whereas typically around half of the population report having at least one formal or
informal savings instrument in most of these countries, the proportion in Tanzania and Uganda
is much lower. When we consider only the poor, the rates of instrument usage in most cases
do not drop significantly; however, among the poor, a significant proportion in countries like
Kenya, Tanzania and Uganda use only informal (unregulated) savings instruments.
Table 5: Overview of FinScope data
Botswana
Kenya
Namibia
South Africa
Tanzania
Uganda
Zambia
1. % of total
population using at
least 1 defined
savings product
47.4%
50.0%
50.0%
49.8%
15.7%
11.4%
40.5%
2. Of the poor:
% using at least 1 de-
fined savings product
40.5%
51.9%
32.8%
33.2%
9.0%
10.0%
31.9%
3. Of poor who save:
(a) % using formal
and informal savings
products
(b) % using only infor-
mal saving products
16.8%
10.9%
19.1%
59.2%
6.7%
3.4%
20.5%
9.6%
6.7%
58.9%
3.2%
82.5%
9.1%
9.1%
While the use of informal instruments such as rotating or accumulating savings is common
across the region, FinScope data provides a view on the risk associated with this, and attitudes
towards informal groups of this kind. For countries in which the question was asked, Table 6
shows personal experience of loss as a percentage of those who use an informal instrument —
ranging from as high as 20% in Botswana to 3% in Uganda.
11
Perhaps as a result of the losses,
some ambivalence towards group-based mechanisms emerges from the data, with around a
third of those using informal instruments expressing mistrust in them, although the framing of
this question differs across countries and affects comparability with Uganda.
Table 6: Experience of informal savings mechanisms (FinScope)
Botswana
Kenya
Namibia
South
Africa
Tanzania
Uganda
Zambia
9
The Diaries tracks “informal savings clubs”, but does not distinguish details within that general category.
10
Note that the concept of ‘savings in the house’ was intentionally distinguished from cash on hand in Diaries
interviews, so that casual cash balances day to day were not confused with more intentional savings efforts.
11
Note that this number for Uganda is lower than the finding by Wright and Mutesasira (2001) that some 26% of clients
from focus group and individual interviews had lost savings in the informal sector.
v3.0
9
% of those using informal
instruments reporting per-
sonal money loss in the group
20.0%
7.6%
2.6%
3.7%
% of those using informal
instruments who agree with
statement “I don’t trust
informal groups ”
44.7%
24.3
32.4%
77.9%
39.8%^
18.1%*
26.1%
Note: * indicates where statement was expressed in opposite form. ^only available for 735 of 4962 respondents.
The relatively high rates of mistrust of informal groups among those continuing to use them
(Table 6, bottom row) is striking; such behavior may stem from a lack of ‘safer’ alternatives.
3.1.2 The intensity of savings
Counting the number of savings accounts, or even preferably the number of people with
accounts, is not indicative of the significance or intensity of that usage: in the Diaries sample,
74% of households report using a formal savings instrument such as a bank account but there
was wide variation in usage levels. We therefore need another dimension when assessing
savings behavior: the intensity of savings, measured as the cash flow into defined financial
instruments over time as a percentage of household income.
Figure 3 below shows the median monthly savings of a Diaries household over the 10 month
period divided by average monthly income over the period. Savings intensity varies month by
month and seems to increase towards year end.
12
The median intensity over the entire 10
months was 21%. Since median monthly income was $290, this means that $60 per month was
saved in a financial product of some sort during this period. At such low income levels, this
rate is high; trying to encourage proportionally more savings may be unrealistic, although it is
possible that access to a safe savings instrument might give more reason to save what
otherwise might have been spent.
12
Our discussions with households indicate that many savings activities are intended to fund year-end activities, such as
Christmas feasts, home improvement, school fees/uniforms. Therefore, we suspect that much of the savings
accumulation that happens during the year is spent in the December/January period. Unfortunately, because the
study was completed just before this period, we were not able to confirm our suspicions with actual cash flow data.
v3.0
10
Figure 3: Intensity of savings by month (Financial Diaries)
13
The intensity can also be analyzed by income group and by the instruments used. Table 7 below
shows that the poorest group does not save markedly less as a percentage of income than their
middle-income counterparts. However, the poor do save in different financial instruments.
Households earning less than $5 per day tend to accumulate savings almost entirely in informal
instruments, such as savings clubs and hiding savings in the house. Very little savings happens
in the bank, even though over half of these households report having bank accounts.
Households earning above $5 per day save substantially more in formal instruments, such as
bank accounts, provident funds and retirement annuities; although, note that this higher-
income segment continues to use informal instruments as well.
Table 7: Calculating savings flows and cycles, based on $ per day income (Financial Diaries)
Income
per day
Percent of
sample
Mean
accumulation as
% of income
% of the mean accumulated in:
Saving in
the house
Money
guarding
Savings
clubs
Bank
accounts
Provident fund or
savings annuities
< $2
10%
18%
45%
0%
48%
7%
0%
$2 - $5
31%
14%
29%
1%
49%
13%
1%
$5 - $10
28%
18%
8%
4%
21%
52%
10%
> $10
32%
31%
9%
1%
31%
19%
40%
Total
sample
100%
21%
19%
2%
36%
25%
16%
3.1.3 Duration of savings
In addition to instrument usage and intensity, savings may be measured by duration: the length
of the period over which households manage to accumulate savings using the instrument before
withdrawing it to use for a variety of purposes, including investment in physical assets.
Duration can be calculated for each Diaries household and each instrument by counting the
number of days households manage to accumulate money over the period before the balance
falls (see Annex C for more detail). Note that longer duration is not necessarily good: as
discussed more below, the important issue is that households can match the timing of their
underlying reason for savings with an instrument which has an appropriate time profile.
Figure 4 below shows the average duration across the sample for the five different types of
savings instruments captured in the Diaries. On average, both money guarding and savings in
the house had the lowest durations, with households managing to hold on to their
13
Savings flows are defined here as monthly flows into: bank accounts (net), a savings place in the home (net), savings
clubs (gross), provident funds (gross), retirement annuities (gross), and money guarding (gross).
v3.0
11
accumulations for just under 3 months. Bank accounts had only a slightly longer duration of
3.5 months. Savings clubs had an average duration of 6.6 months. As expected, provident
funds and savings annuities had the maximum duration of 10 months, and if the study had
continued beyond the 10 months, the measured duration of these would have been higher.
Figure 4: Average duration of savings (Financial Diaries)
Combining the allocation of accumulated savings (Table 7 above) with the duration of each
instrument (Figure 4), yields a weighted average duration of the entire savings portfolio, by
each dollar per day segment. As Figure 5 below shows, not surprisingly, the poorest have the
shortest duration in their savings portfolios, managing to accumulate savings for an average of
only 4 months; the middle income segment extends the duration to around 5 months; and the
wealthiest have the longest duration, at more than 7 months. This last number would be even
higher if the full terms of the retirement products, held largely by this group, were included.
Figure 5: Weighted duration by household income (Financial Diaries)
3.1.4 The household portfolio
Households use a portfolio of financial instruments to meet different needs. The definitions
discussed above allow us to categorize the instruments used by Diaries households into
clusters, and then measure the diversification across these clusters.
v3.0
12
Two characteristics appear especially relevant:
• whether the instrument is offered by a regulated (therefore formal) financial
institution or not, which provides some proxy for risk; and
• the duration of accumulation—whether long or short.
Figure 6 uses these two factors to cluster the Diaries financial instruments into four distinct
quadrants. Quadrant 1 consists of bank savings accounts, which, while shown to be relatively
low duration, are regulated and therefore in general lower risk. Quadrant 2 instruments have
the advantage of being both long duration and regulated; examples include provident funds,
savings annuities, and committed bank instruments such as fixed deposits. Savings clubs in
Quadrant 4 are relatively long in duration, but they are unregulated and riskier (see Section
3.1.1 above). Quadrant 3 consists of both cash savings in the house and the use of money
guards, which have low duration and are unregulated.
Figure 6: The household portfolio: Instruments categorized by formality and duration
Diaries data enables the measurement of the flows into each quadrant: as Table 8 shows, for
poor people (LSM3), the flows are concentrated in quadrants 3 and 4, which are predominantly
unregulated; whereas wealthier people tend to diversify the accumulation across all quadrants.
Table 8: Portfolio allocation (Financial Diaries)
LSM
Mean savings
accumulation
(US$)
Quadrant
1
Quadrant
2
Quadrant
3
Quadrant
4
3
$180
13%
0%
42%
45%
4
$828
32%
5%
50%
12%
5
$1,231
27%
28%
25%
20%
3.2 Improving the range of options
The preceding analysis has shown that the poor already save substantially out of income.
However, the range of instruments available to them is limited, leaving little option but to save
with portfolios of financial instruments that are relatively risky and of relatively short duration.
Moreover, the most heavily-used savings instrument in the Diaries, informal savings clubs, are
tied to liquidation at a particular time and purpose. As a result, households cannot access
untied funds at a moment’s notice for an emergency or an unexpected opportunity.
The effect of this gap is shown in evidence from the Financial Diaries. While expected events,
such as a traditional feast or the start of school, were often financed with savings built up in
savings clubs, savings almost never played a role in unexpected events: instead, households
relied on loans or gifts from relatives. Similar patterns were shown in Financial Diaries studies
in Bangladesh and India, where illness was a common unexpected emergency and was rarely
financed by savings. Likewise, when an unexpected opportunity arose, such as a chance to buy
land or increase business stock, households lacked access to an untied savings reserve.
Regulated
Quadrant 1
Bank account
Quadrant 2
Provident funds
Savings annuities
Extent of
formality
Unregulated
Quadrant 3
In-house Savings
Money guarding
Quadrant 4
Savings clubs
Short Duration
Long Duration
v3.0
13
The objective of building better financial products for the poor needs to be understood within
the context of what would serve the poor the best based on the needs they face. Simply
increasing take-up of financial services does not tell us whether these financial products
address serious deficiencies in the financial protection or opportunity enhancement within the
lives of the poor. Within the context of savings, the poor are able to save, even from meager
budgets, but the instruments that allow them to do this do not generate an adequate pool of
open-ended, long duration savings, which would help buffer against adverse events or take
advantage of unexpected opportunities.
3.3 What demand side issues may limit a broader portfolio of savings instruments?
Clearly, supply-side issues have a vital effect on the choice of instruments available, but the
focus of this paper is on demand-side characteristics. Markets can be segmented on various
bases, such as users’ personal characteristics or, alternatively, their common needs. We
consider here two categories of user characteristics which may limit access to untied, safe and
longer duration savings instruments: their attitudes towards savings and cash flow profile.
3.3.1 Attitudes towards savings
Developing a long term pool of savings is certainly shaped by attitudes towards the future and
by a belief about the usefulness of savings. Perhaps households are not optimistic about the
future and do not feel they have a reason to save beyond the next year. FinScope surveys ask a
number of questions which attempt to get at attitudes towards savings. As shown in Table 9
below, a large majority in most countries express a positive belief that regular savings of small
amounts results in accumulation (and even that this may result in financial ‘security’ in some
formulations). Interestingly, a similar proportion expresses a high degree of debt aversion (not
shown below). In terms of behavior, a high proportion of adults (from 43% in SA to 65% in
Botswana) say that they try to save regularly, and a significant proportion (22% in Namibia to
67% in Tanzania) say that they are even willing to sacrifice something in order to save.
Table 9: Savings attitudes across countries (FinScope)
% who respond:
Botswana
Kenya
Namibia
So. Africa
Tanzania
Uganda
Zambia
Regular savings
accumulates…
45%
77%
89%
67%
n/a
71%
71%
I try to save regularly
65%
n/a
58%
43%
49%
61%
50%
I am willing to
sacrifice to save
47%
n/a
22%
27%
69%
35%
24%
These results suggest that the underlying beliefs and attitudes towards savings are positive in
the FinScope countries. If anything, the ‘culture of savings’ appears stronger in the lower
income countries like Kenya, Tanzania, Uganda and Zambia which have less developed financial
systems, and where there may be less access to consumer credit. However, actual behavior
may diverge from stated behavior or belief: for example, while debt aversion is high, the usage
of debt instruments among those who express aversion is also high. Nonetheless, it appears
that the soil in these countries is fertile for offering new appropriate savings instruments.
In a controlled test of attitudinal and behavioral responses (Annex F1), savers and non-savers
differ substantially with respect to their attitudinal responses. For example, savers are much
more likely than non-savers to have and work to a household budget. Such explanatory factors
may be helpful in segmenting who is more likely to be a saver and, therefore, who is an
optimal target for at least ‘phase one’ marketing of a savings product rollout. The Mzansi
discussion above allowed us to explore a practical application of this by looking at who adopted
basic bank accounts in that recent rollout in South Africa.
v3.0
14
3.3.2 Cash flow factors explaining savings instrument usage
Diaries data, shown in Table 10 below, indicates that household financial behavior is heavily
influenced by the primary source of household income.
Table 10: Calculating savings flows & cycles, based on primary income source (Fin. Diaries)
%
of
sample
Mean
Monthly
Income
(US$)
Mean
accumulated
as % of
income
Mean accumulated in:
Weighted
avg.duration
of savings
cycle
Saving
in the
house
Money
guarding
Savings
clubs
Bank
account
Provident
funds/savings
annuities
Gov’t grants
27%
$187
15%
22%
4%
59%
7%
1%
4.8
Remittances
9%
$200
17%
33%
0%
34%
34%
0%
4.0
Casual
5%
$205
6%
46%
0%
5%
35%
0%
1.5
Business
7%
$304
36%
31%
0%
38%
21%
0%
4.0
Salaried job
49%
$620
20%
9%
1%
27%
29%
31%
6.4
Formal
employment
pension
3%
$649
86%
18%
0%
5%
77%
0%
3.3
Total sample
100%
$423
21%
19%
2%
36%
25%
16%
Households reliant on predictable income sources, such as formal employment or government
grants, are not necessarily likely to save more intensely,
14
but they are likely to participate in
savings instruments that will increase the duration of their portfolio, such as savings clubs,
while those who cannot predict their income are less likely to. Casual workers, for example,
with similar income levels to grant recipients but with unpredictable income sources, rarely
participate in savings clubs, while grant recipients (with their predictable income source) use
these instruments heavily. This supports the proposition of this white paper that the
development and marketing of financial instruments can benefit from closer market
segmentation, as products can be designed based on segment characteristics. For example,
certain savings instruments, such as fixed deposit accounts, could be designed in light of highly
predictable cash flows for certain groups, such as government grant recipients.
3.3.3 Additional factors
Additional FinScope econometric tests across the seven countries (Annex F3) reveal that while
gender proved insignificant in relation to savings instrument usage across all the countries,
age, urban location, living in a formal house (the poverty proxy) and high school education
were all significantly positively correlated with savings usage, all as expected.
E" ?<&B5%,;+ F+$AG,<$, +22);%&<%+'$,,
Financial institutions developing and offering savings products for the poor will require some
estimation of size of savings which may be attracted. This number will affect the savings
deposit ‘float’ which is one aspect of the business case for taking savings.
15
The market size for
new formal financial savings instruments among the poor will be determined by two main
elements:
14
Those with business income have the highest intensity, perhaps reflecting the fact that certain savings behavior is
part of their business practice; for instance, one kind of ‘saving’ (accumulation) begets other forms of ‘savings’ –
(discounted prices for bulk inventory purchases). Given such patterned behavior by this self-employed segment,
financial products can be designed accordingly (e.g., a savings account with convenient transactional capability).
15
Of course, the fee and cost elements must also be considered; and considering these, it is possible, even
likely, that a savings program targeting small balance deposits only may not be viable on its own; but only
if linked to a larger base of savers or if cross-sold to other products such as credit.
v3.0
15
• The quantum of savings which is channeled into the new instrument/s; and
• The number of people who take it up (and over which period).
In terms of the quantum, the earlier analysis of savings intensity (Section 3.1.2) showed that
the poor already save quite intensively and may find it difficult, without higher disposable
incomes, to save more. However, if given the opportunity, they may well choose to reallocate
their savings flows from existing instruments towards new instruments which better meet their
needs, such as risk diversification and with a time profile, or duration, better suited to their
particular purpose for saving. This reallocation is what we will call portfolio rebalancing.
For illustration purposes, we assume that, in the presence of new formal savings instruments of
both short and long duration (quadrants 1 & 2 of Figure 6), poor people in LSM3 - whose
portfolios are heavily oriented to informal instruments (see Table 8) – choose to redirect their
flows so that their allocation of savings looks more like that of higher income groups—
specifically LSM5, who already use formal instruments more. Note that the LSM5 profile does
not assume that all flows are now formal - this would not be likely or credible - but simply that
a higher proportion is: 53% vs. 12%, as shown by the larger area in Quadrants 1 and 2 in Figure 7
below. The effect of this rebalancing for LSM3 would yield, over this 10 month period, an
average increase of accumulation in formal instruments of $76 per household.
Figure 7: Rebalancing of household savings portfolio
Current LSM 3 Proposed Rebalancing
1
Legend
1
2
Regulated
&
Long
Duration
Regulated
&
Short
Duration
3
4
Unregulated
&
3
4
Long
Duration
Unregulated
&
Short
Duration
Note: Size of quadrants is drawn to proportionate scale
In terms of the number of adopters of new formal instruments, the adoption of Mzansi among
poor savers indicates receptivity to appropriate formal instruments (at least in Quadrant 1-
short duration). The earlier analysis of the drivers of savings combined with the Mzansi profile
provides a means of segmenting those groups among the poor currently without formal
instruments who are most likely potential adopters of the new products.
Thus we do not simply assume that all poor adults (LSM 1-3) will be readily receptive to the
new offering; instead, we segment the poor to find the group(s) most likely to adopt based on
one or more of the following:
(a) showing a positive attitude towards savings (‘try to save regularly’ or ‘sacrifice to save’)
and money management (‘budget’), since Mzansi adoption and the cross country studies
indicated that these were differentiators; or
(b) having a predictable income stream (formal employment or government grants); or
(c) youth (Age 16-29), since Mzansi indicates relatively high adoption rates in this segment.
Figure 8 below shows the relative magnitude of this group (in orange), among the 10.3m adults
in this low LSM range: while 24% already use some form of formal savings (hence little
v3.0
16
rebalancing effect may be expected here), of the 76% currently with no formal savings, 51%
appear more likely to adopt a new formal product, while the balance of 25% appear to have
lower potential for take-up. The higher potential group amounts to some 5.2m new savers.
Combining this number, scaled for household size, with the earlier flow quantum released by
the assumed rebalancing, the total amount of savings released by poor households for formal
instruments of short and long duration would be $159 million over 10 months; if scaled pro-
rata, $191 million per annum.
16
This is a substantial number for a financial institution with the
cost base and distribution to address this market.
Figure 8: Proposed high potential segment targets within poor (LSM1-3 only)
Formal
Savings
Currently No Formal Savings, and
(24%)
Low Potential
(25%)
Currently No Formal Savings, BUT
High Potential
(51%)
Mzansi
(5%)
Note: This figure is drawn to scale.
H" I+$(+$A;3,+7D2+*<%+'$;,J,&5*'775$(<%+'$;,,
5.1 Findings
This paper has combined analysis for the first time from two large scale data sets to test
different definitions, measures and drivers of savings among the people from seven African
countries, with special focus on poor households in South Africa.
The findings here confirm many insights from the global savings literature, namely:
• Poor people do save, often at an intensity similar to that of their wealthier neighbors;
• They use a mix of instruments, formal and informal, to assemble portfolios of financial
instruments; informal instruments are subject to risk of loss of money, and as a result,
there are varying levels of trust associated with them;
• Their portfolios are different from moderate income people in that, on the whole, the poor
use formal and longer duration instruments less;
16
Note that this assumes the mean amount is collected from all LSM1-3 households, without taking into account
distributional questions within and across the groups which would warrant further analysis.
v3.0
17
• In South Africa, the take-up of Mzansi basic bank accounts among poor customers who have
never had a bank account before indicates strong underlying demand for appropriate, basic
savings instruments provided by formal institutions.
However, the use of the FinScope databases with the Diaries household panel enabled these
insights to be more specifically quantified and measured.
5.2 Implications for donor strategies to scale up the savings of the poor
The Mzansi takeup confirms that there is strong demand among the poor for a convenient,
accessible and relatively affordable basic bank account product as the cornerstone of a
financial instrument portfolio. In countries which lack such a product category, donor emphasis
should be placed on how to support this development. This will require market sizing and
segmentation, such as illustrated here, in order to make the business case to financial
institutions to develop the product themselves; or else to decide on the quantum of subsidy
which may be necessary to incentivize them to do this.
However, the experience with Mzansi also suggests some caution with respect to the definition
and measurement of initiatives to increase savings:
• Instrument-based measures are inadequate by themselves (especially if simply measuring
number of accounts opened which may far exceed the number of unique users); and
• The intensity of savings is already relatively high among poor people so that scaling up is
less likely to mean saving more overall, but rather channeling saving flows to new and
better financial instruments.
• Measurement of outcome (by donors) should aim to include capturing the portfolio
rebalancing effect as the result of the introduction of new instruments.
5.3 Recommendations for scaling up strategy
This paper has undertaken exploratory work using the available primary data to indicate how it
may inform strategies for the development of new savings products. Some further work has
already been done on segmentation measures in these countries: one example is the Financial
Summary Measure (FSM), developed by FinMark Trust, which aims go beyond LSM measures on
observables to categorize based on attitudinal and usage factors such as those captured in
FinScope. However, while in use in South Africa, FSMs are still at an early stage of development
in other FinScope countries. Our main recommendations have to do with developing these
exploratory insights further so that they can inform financial institutions as well as policy
makers and donors in their efforts to scale up savings.
1. Data collection: In any country in which scaling up savings is targeted, a basic household
survey, building on FinScope methodology, should be designed to establish benchmarks on
usage and attitudes. A consistent basic questionnaire should be administered across
countries to enable cross country comparison. Then, deeper insights into financial behavior
could be done with targeted Financial Diaries research on targeted populations.
2. Adoption research: In addition to more in-depth analysis of Mzansi, there would be benefit
in further research around the take-up of appropriate savings patterns in other countries,
such as the rollout of Equity Bank in Kenya, where national level FinScope data is also
available as a national backdrop. This would enable more precision on the segmentation
and sizing of those most likely to adopt a new formal product.
3. Add on savings at second stage: The proposition of a basic bank account such as Mzansi is
to offer a ‘portal’ through which other financial products, including savings and insurance,
could be offered at lower transaction costs to provider and client, enabling them to
rebalance their portfolio of financial assets on an ongoing basis. The extent to which such
add on savings products are available, and their take-up, would merit further research: for
example, some South African banks already offer special savings products, leveraging and
v3.0
18
linked to the Mzansi brand, and there has been discussion of developing a ‘Mzansi mutual
fund’. This research would inform design of savings instruments linked to the provision of
electronic stores of value.
K5/5&5$ *5;,
Banerjee & Duflo (2007) “What is middle class about middle classes around the world”, Mimeo
December, available via
Bankable Frontier Associates (2007) “Financial services access and usage in southern and east
Africa: What do FinScope surveys tell us?”, available via
Robinson, M (2004) “Mobilizing savings from the poor: basic principles and practices”, available
via ./content/article/detail/23749
Rutherford, S (2000) The Poor and their money, Delhi: OUP
Wright, G & L. Mutesasira (2001) “The Relative Risks to the Savings of Poor People”, MicroSave
Briefing Note No.6, available via www.microsave.org
World Savings Banks Institute (2008), “Who are the clients of savings banks?”, available at
www.wsbi.org.