Measuring Commercial Bank Profitability: Proceed with Caution potx
Bạn đang xem bản rút gọn của tài liệu. Xem và tải ngay bản đầy đủ của tài liệu tại đây (282.6 KB, 18 trang )
FEDERA L RESERVE BANK OF ST
.
LOUIS
RE V I EW
NOVEMBER
/
DECEMBER
20 0 7 515
Measuring Commercial Bank Profitability:
Proceed with Caution
R. Alton Gilbert and David C. Wheelock
The federal tax code creates challenges for comparing the profit rates of different banks on a con-
sistent basis. The earnings of banks that elect to operate under subchapter S of the federal tax code
are not subject to federal corporate income tax, but shareholders of these “S-banks” are taxed on
their pro rata share of the entire earnings of the bank. The number of banks electing subchapter S
tax treatment has increased rapidly, especially among small banks. The authors use estimates of
the federal corporate income tax that S-banks would pay if they were subject to the tax to show
that the difference in the tax treatment of S-banks and other banks has a large impact on measures
of U.S. banking system profitability. Further, the article shows that adjustment of S-bank earnings
by estimates of federal income taxes to make them comparable with the earnings of other banks
can markedly affect conclusions of studies that use net income as a measure of performance.
Finally, the article shows that S-banks (even after their earnings are reduced by estimated federal
taxes) tend to out-earn their peers; S-banks also tend to have higher earnings rates than their peers
in the year before they elect S-bank status. (JEL G21, G28, H25)
Federal Reserve Bank of St. Louis Review, November/December 2007, 89(6), pp. 515-32.
corporations are taxed twice—once at the firm
level under the corporate income tax and again
at the shareholder level under the personal
income tax. However, the earnings of banks and
other firms that elect subchapter S tax treatment
(S-corporations) are not subject to the federal
corporate income tax. (However, shareholders
of S-corporations are subject to personal income
taxes on their pro rata share of the firm’s entire
earnings, including nondistributed retained earn-
ings. Corporations not electing subchapter S status
operate under subchapter C of the federal tax
code—hereafter, C-corporations.)
Because the earnings of S-corporations are
taxed differently from those of C-corporations,
the profit rates of S- and C-corporations are not
directly comparable on the basis of standard
measures of after-tax rates of return.
M
easures of after-tax rates of return,
such as the return on average total
assets (ROA) and the return on
total equity (ROE), are widely used
to assess the performance of firms, including
commercial banks. Bank regulators and analysts
have used ROA and ROE to assess industry per-
formance and forecast trends in market struc-
ture—as inputs in statistical models to predict
bank failures and mergers—and for a variety of
other purposes where a measure of profitability
is desired.
The usefulness of standard profit measures
can be affected by tax laws and regulations, which
are subject to occasional amendment and revision.
Subchapter S of the federal tax code, for example,
was established to benefit small businesses by
granting them relief from the double taxation of
corporate dividends. The dividends paid by most
R. Alton Gilbert is a former vice president and banking economics advisor and David C. Wheelock is an assistant vice president and economist
at the Federal Reserve Bank of St. Louis. The authors thank Andrew Meyer and Rajdeep Sengupta for helpful comments. Craig Aubuchon
and Daniel McDonald provided research assistance.
©
2007, The Federal Reserve Bank of St. Louis. Articles may be reprinted, reproduced, published, distributed, displayed, and transmitted in
their entirety if copyright notice, author name(s), and full citation are included. Abstracts, synopses, and other derivative works may be made
only with prior written permission of the Federal Reserve Bank of St. Louis.
Recent growth in the number of banks that
elect to operate under subchapter S of the federal
tax code has complicated the use of after-tax profit
measures to assess trends in industry profitability
and to compare rates of return across banks and
over time. This article examines the consequences
of the proliferation of S-banks for assessing the
profitability of the U.S. banking industry. The
quarterly Uniform Bank Performance Report
(UBPR) produced by the Federal Financial
Institutions Examination Council (FFIEC) pro-
vides hypothetical after-tax rate of return data
for individual S-banks: That is, S-banks’ rates of
return are adjusted by an estimate of the federal
corporate income tax that those banks would have
had to pay if they were subject to the tax.
1
The
adjustment is quantitatively large for many banks,
indicating that comparisons of S- and C-banks
using standard after-tax profit measures can lead
to erroneous conclusions. Because S-banks are
more prevalent among smaller banks, comparison
of average after-tax profit rates across groups of
banks delineated by size is especially problematic
unless differences in the tax treatment of S- and
C-bank earnings are taken into account. This
article shows quantitatively the impact of the
differences in the tax treatment of S- and C-banks
on measures of U.S. banking system profitability.
We find that the net profit rates of S-banks
tend to exceed those of similarly sized C-banks,
even after S-bank earnings are adjusted by the
UBPR estimate of federal income taxes that they
would have had to pay if they were subject to
the corporate income tax. The UBPR adjustment
does not account for any differences in how S- and
C-banks are taxed by states, however, nor does it
capture differences in how S- and C-banks are
managed in response to the incentives they face
because of how their earnings are taxed. We find
that S-banks consistently have higher pre-tax
earnings rates and net interest margins than C-
banks and tend to be more cost efficient. Further,
we find that C-banks that became S-banks tended
to have higher profit rates in the year before they
changed status than other C-banks, suggesting
that S-bank status alone cannot fully account for
the higher average adjusted profit rates of S-banks.
Because one cannot meaningfully compare
the earnings of S- and C-banks on the basis of
standard after-tax profit rates, some analysts use
pre-tax profit measures to evaluate the perform-
ance of banks and in statistical models that
include a profit measure. Presumably banks seek
to maximize after-tax profits rather than pre-tax
profits, however, and some strategies for maximiz-
ing after-tax profits can result in relatively low
pre-tax earnings rates. For example, some banks
hold large amounts of securities whose interest
payments are exempt from taxation at the federal,
state, and/or local levels. All else equal, a bank
that holds a large amount of tax-advantaged secu-
rities may have a relatively low pre-tax rate of
return but a relatively high after-tax rate of return.
Hence, comparison of pre-tax profit rates can give
a misleading view of bank performance. The UBPR
includes an adjustment to banks’ pre-tax income
for tax-exempt earnings. This article investigates
how large an impact this adjustment has on pre-
tax bank earnings rates.
In summary, the federal tax code creates
challenges for measuring the profit rates of banks
on a consistent basis across banks and across time.
The UBPR, however, provides two measures of
bank profits designed to permit such comparisons:
(i) pre-tax income adjusted for earnings on tax-
advantaged securities and (ii) after-tax income
adjusted for the federal corporate income tax that
S-banks would have had to pay if they were C-
banks. While these measures can be useful, this
article suggests that analysts should proceed
with caution when using any measure of bank
profitability.
The following section illustrates the implica-
tions of subchapter S tax treatment for after-tax
measures of bank earnings and for shareholder
income. Subsequently, we examine the growth
in the number of S-banks across different groups
sorted by asset size and show how the prolifera-
tion of S-banks has affected measures of banking
industry profitability. We then examine how con-
clusions about the viability of small, community
Gilbert and Wheelock
516
NOVEMBER
/
DECEMBER
200 7
FEDERA L RESERVE BANK OF S T
.
LOUIS
RE V I EW
1
Regulators use the UBPR for offsite surveillance of banks. Private-
sector bank analysts also frequently use the report, which can be
accessed at the web site of the FFIEC, an interagency body com-
prising the federal regulators of bank and thrift institutions. See
www.ffiec.gov.
banks can be substantially affected by whether
or not one adjusts S-bank earnings for estimated
federal taxes. Further, we examine differences in
the financial characteristics of S- and C-banks
and explore the implications of using pre-tax
earnings as an alternative to after-tax profits.
HOW THE TAXATION OF
S-BANK PROFITS AFFECTS BANK
RETURNS AND SHAREHOLDER
INCOME
Subchapter S enables small firms to avoid
double taxation on distributed earnings without
sacrificing the advantages of limited liability.
Although the earnings of ordinary (subchapter C)
corporations are subject to the federal corporate
income tax, the earnings of subchapter S corpo-
rations are exempt from the tax. However, share-
holders of subchapter S corporations are subject
to personal income tax on their pro rata share of
the entire earnings of the corporation, not just on
dividends. The example below illustrates how the
shareholders of S-banks benefit from the elimina-
tion of double taxation of dividends.
Consider the hypothetical C- and S-banks
with financial data given in Table 1. Each bank
has total assets of $50 million and pre-tax income
of $1 million. In addition, each bank pays 30 per-
cent of its net after-tax income as dividends to its
shareholders.
2
To simplify the illustration, we
assume that the state corporate income tax is zero
for these banks. Further, we assume that the share-
holders of each bank have a marginal tax rate of
30 percent and that the federal income tax rate
for corporations is also 30 percent.
The C-bank pays federal income tax of
$300,000, whereas the S-bank pays no federal
income tax. The C-bank reports net after-tax
income of $700,000, and the S-bank reports net
after-tax income of $1,000,000. Thus, the standard
ROA of the C-bank is 1.4 percent, whereas the
standard ROA of the S-bank is 2 percent. This
difference in ROA is due entirely to the difference
in how the earnings of the two banks are taxed,
because their pre-tax earnings and their total
assets are the same. The UBPR would report the
adjusted net income of the S-bank as $700,000, the
Gilbert and Wheelock
FEDERA L RESERVE BANK OF S T
.
LOUIS
RE V I EW
NOVEMBER
/
DECEMBER
20 0 7 517
Table 1
Illustration of the Effects of Taxation as an S-Bank on Bank Profit Rates and Shareholder Returns
C
-bank S-bank
Total assets $50,000,000 $50,000,000
Pre-tax income 1,000,000 1,000,000
F
ederal corporate income tax 300,000 0
Net income after tax 700,000 1,000,000
Adjustment to the net income of the S-bank for taxes it would pay –300,000
if taxed as a C-bank
UBPR tax-adjusted net income of bank 700,000 700,000
Dividends to shareholders 210,000 300,000
Taxes paid by shareholders 63,000 300,000
Returns to shareholders
Retained earnings 490,000 700,000
Plus dividends 210,000 300,000
Minus taxes on dividends 63,000 300,000
Increase in the net worth of shareholders 637,000 700,000
2
In practice, S-banks tend to have higher dividend payout rates
than C-banks. We assume equal payout rates in our example for
simplicity and to focus on the implications of the different federal
corporate income tax rates for S- and C-banks.
same as the net income of the C-bank, and the
adjusted ROA of each bank would be 1.4 percent.
3
The C-bank pays dividends of $210,000,
whereas the S-bank pays dividends of $300,000.
With a marginal tax rate of 30 percent, the share-
holders of the C-bank pay income tax of $63,000
on their dividends, whereas the shareholders of
the S-bank pay income tax of $300,000 because
they are taxed on the full earnings of the bank,
not just on the dividends they receive.
Positive profits in the current year increase
the net worth of the shareholders of both the C-
bank and S-bank. The increase in net worth is
higher for the shareholders of the S-bank by
$63,000, which is the amount of tax that the share-
holders of the C-bank pay on their dividends. Of
course, these magnitudes would differ under
other possible assumptions.
The Proliferation of S-Banks
Congress created subchapter S of the federal
tax code in 1958, but commercial banks have
been permitted to elect subchapter S status only
since January 1997. The number of commercial
banks electing subchapter S tax treatment has
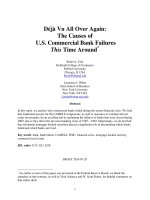
since risen rapidly. Figure 1 illustrates the growth
in the number and percentage of banks electing
S-status over time. The number of S-banks
increased from 601 banks (representing 6.6 per-
cent of the industry) at year-end 1997 to 2,155
banks (representing 28.8 percent of the industry)
at year-end 2005.
Subchapter S corporations are limited to a
maximum of 100 shareholders, which precludes
many larger banks from electing S-status.
4
Hence,
S-banks are concentrated among smaller banks.
Table 2 reports the relative number and asset
Gilbert and Wheelock
518
NOVEMBER
/
DECEMBER
200 7
FEDERA L RESERVE BANK OF S T
.
LOUIS
RE V I EW
3
UBPR adjusts an S-banks’ net income by subtracting from pre-tax
income the UBPR estimate of the federal corporate income tax
that the S-bank would have had to pay if it were taxed as a C-bank,
which creates a measure comparable to C-banks’ adjusted net
income, which equals after-tax net income.
0
1,000
2
,000
3,000
4
,000
5,000
6,000
7,000
8,000
9
,000
1997 1998 1999 2000 2001 2002 2003 2004 2005
Number of Banks
0
5
1
0
1
5
20
25
30
3
5
Percent
S
-Banks
C-Banks
P
ercent S-Banks
Figure 1
Number of Banks Electing Subchapter-S and -C Status
4 See Landau (2005) and www.s-corp.org/asp/products/
product_3_4.asp for information about the history of subchapter
S and current requirements for election of S status.
holdings of S-banks for five size groups, as well
as across all groups, as of December 31, 2005.
5
For example, S-banks accounted for less than 6
percent of banks with $1 billion or more of assets
and just 0.5 percent of the total assets of banks
with more than $1 billion of assets. By contrast,
S-banks accounted for over 40 percent of banks
and over 43 percent of the total assets of all banks
with less than $50 million of assets.
EFFECTS OF THE TAX TREATMENT
OF S-BANKS ON MEASURES OF
BANK INCOME
This section examines how the proliferation
of banks electing S status has affected aggregate
measures of banking industry profitability.
6
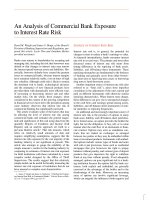
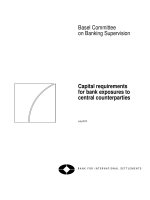
Figures 2 and 3 plot annual data from 1996 to
2005 on median after-tax ROA and ROE, respec-
tively, for large and small banks; here, large banks
are those with more than $1 billion of assets and
small banks are those with less than $1 billion of
assets. The median after-tax profit rates of large
banks exceeded those of small banks throughout
the period and increased relative to those of small
banks after 2000.
7
In addition to the standard ROA and ROE
measures, the dashed lines in Figures 2 and 3
also show median earnings rates based on the
alternative measure in which the earnings rates
of S-banks are reduced by the UBPR estimates of
the tax that they would have had to pay if subject
to the federal corporate income tax. The median
values of ROA adjusted and ROE adjusted shown
in the figures are calculated using the standard
ROA and ROE measures for C-banks and the
measures that are adjusted for estimated federal
corporate income taxes for S-banks.
8
Because few
large banks are S-banks, the S-bank adjustment
for estimated taxes has only a small effect on the
median profit rates of banks with assets of at least
$1 billion. However, for small banks, the impact
of the adjustment is large and has been growing
Gilbert and Wheelock
FEDERA L RESERVE BANK OF S T
.
LOUIS
RE V I EW
NOVEMBER
/
DECEMBER
20 0 7 519
5
The data reported in Table 2 are for all banks in peer groups 1
through 15 of the UBPR. These peer groups include all U.S. com-
mercial banks except those chartered during the most recent five
years. Including such banks would raise the total number of S-
banks to 2,155. Peer groups 1 through 15 also exclude credit card
specialty banks, bankers’ banks, and thrifts. See the March 2006
UBPR user’s guide (FFIEC, 2006, Section II: Technical Information).
6
Hein, Koch, and MacDonald (2005) present similar information
through 2002.
Table 2
S-Bank Presence By Bank Size Group, 2005
N
umber of banks Assets (in thousands)
Bank size group All banks S-banks Percent S-banks All banks S-banks Percent S-banks
Greater than $1 billion 460 26 5.7 $7,190,934,374 $37,148,074 0.5
$300 million to $1 billion 1,094 186 17.0 525,041,331 85,106,377 16.2
$100 million to $300 million 2,279 654 28.7 380,418,078 105,267,783 27.7
$50 million to $100 million 1,585 616 38.9 112,932,985 43,362,442 38.4
Less than $50 million 1,480 597 40.3 44,274,181 19,095,383 43.1
All groups 6,898 2,079 30.1 8,253,600,949 289,980,059 3.5
NOTE: Data include only those banks in peer groups 1 through 15 of the Uniform Bank Performance Report. Size groups are based
on total end-of-year assets.
7
Figures 2 and 3 report median profit rates because extreme values
distort mean profit rates. Comparisons such as those in Figures 2
and 3 can be sensitive to how one distinguishes “large” and “small”
banks. For example, Bassett and Brady (2001) find that between
1985 and 2000, small banks (defined as those outside the largest
1,000 banks) consistently had higher average earnings rates than
the largest 100 U.S. banks. Bassett and Brady do not use the UBPR
data on net income adjusted for the tax treatment of S-banks.
8
See FFIEC (2006, Section II, “Technical Information,” p. 4) for
information about the adjusted measure of after-tax earnings of
S-banks for estimated income taxes. This document is available at
www.ffiec.gov/ubprguide.htm.
Gilbert and Wheelock
520
NOVEMBER
/
DECEMBER
200 7
FEDERA L RESERVE BANK OF S T
.
LOUIS
RE V I EW
0.8
0.9
1
1.1
1
.2
1
.3
1
.4
1996 1997 1998 1999 2000 2001 2002 2003 2004 2005
P
ercent
ROA Large Banks
ROA Small Banks
ROA Large Banks Adjusted
ROA Small Banks Adjusted
Figure 2
ROA With and Without S-Bank Adjustment
Table 3
Median Return on Assets (ROA) and Return on Equity (ROE) for Banks Grouped by Size and
Tax Status, 2005
All banks
ROA ROE
Bank size group Number ROA adjusted ROE adjusted
More than $1 billion 450 1.30 1.28 13.87 13.62
$300 million to $1 billion 1,071 1.21 1.16 13.27 12.84
$100 to $300 million 2,250 1.17 1.08 11.77 11.01
$50 to $100 million 1,560 1.10 0.99 10.55 9.52
Less than $50 million 1,429 0.99 0.89 8.51 7.64
NOTE: Includes only those banks in peer groups 1 through 15 of the Uniform Bank Performance Report. ROA adjusted: ROA with
adjustment for imputed taxes; for all banks, this is the median ROA across all banks, where ROA for S-banks is adjusted for imputed
taxes. ROE adjusted: ROE with adjustment for imputed taxes; for all banks, ROE adjusted is the median ROE across all banks, where
ROE for S-banks is adjusted for imputed taxes. Bank size groups are based on total end-of-year assets.
Gilbert and Wheelock
FEDERA L RESERVE BANK OF S T
.
LOUIS
RE V I EW
NOVEMBER
/
DECEMBER
20 0 7 521
8
9
10
1
1
1
2
1
3
14
15
16
1
7
1996 1997 1998 1999 2000 2001 2002 2003 2004 2005
P
ercent
ROA Large Banks
ROA Small Banks
ROA Large Banks Adjusted
ROA Small Banks Adjusted
Figure 3
ROE With and Without S-Bank Adjustment
C-banks S-banks
ROA ROE
Number ROA ROE Number ROA adjusted ROE adjusted
426 1.28 13.62 24 1.78 1.34 19.07 13.78
896 1.14 12.55 175 1.74 1.25 19.64 14.25
1,607 1.05 10.41 643 1.63 1.18 17.47 12.49
952 0.94 8.80 608 1.49 1.08 15.15 10.91
848 0.82 6.94 581 1.37 0.97 12.41 8.88
Table 3, cont’d
over time as the number of S-banks has risen.
Moreover, the earnings gap between large and
small banks based on the adjusted earnings meas-
ures has been getting wider over time.
Table 3 presents information on the median
after-tax profit rates (ROA and ROE) of commer-
cial banks of various size groups for 2005. The
table also reports median adjusted ROA and ROE
(calculated as in Figures 2 and 3).
Only 24 banks with $1 billion or more of
assets elected S-bank status in 2005; accordingly,
for all banks with total assets greater than $1 bil-
lion, the differences between median ROA and
median adjusted ROA and between median ROE
and median adjusted ROE are small. The median
ROA of commercial banks with at least $1 billion
of assets is 1.30 percent and median ROE is
13.87 percent, whereas median adjusted ROA is
1.28 percent and median adjusted ROE is 13.62
percent.
Tax adjustment of S-bank earnings has a
larger impact on group median earnings rates for
smaller banks. For the smallest banks—those with
no more than $50 million of assets—median ROA
drops from 0.99 percent to 0.89 percent and
median ROE drops from 8.51 percent to 7.64
percent when S-bank profit rates are adjusted to
include imputed taxes. Hence, the exemption of
S-banks from the corporate income tax has an
especially large impact on median after-tax earn-
ings rates for groups consisting of small banks.
In addition to showing median profit rates
across all banks in each size group, Table 3 reports
data for C- and S-banks separately. For S-banks,
we report median values of both unadjusted and
adjusted ROA and ROE. The median values of
ROA and ROE for S-banks are considerably larger
than those for C-banks, with much of the differ-
ences accounted for by the different tax treatment
of S- and C-banks. Adjusting ROA and ROE to
include the UBPR estimate of federal income taxes
has a large impact on median earnings rates for
S-banks across all size ranges. For example, for
the S-banks with less than $50 million of assets,
the adjustment reduces median ROA from 1.37
percent to 0.97 percent and median ROE from
12.41 percent to 8.88 percent. Clearly, the absence
of federal corporate income taxes on S-bank earn-
ings has a large impact on their measured after-
tax rates of return, indicating that caution is war-
ranted when comparing after-tax rates of return
of S- and C-banks—or of groups of banks that
include both S- and C-banks.
9
IMPLICATIONS OF THE
ADJUSTMENT OF S-BANK
PROFITS FOR ECONOMIC
RESEARCH: AN EXAMPLE
INVOLVING THE VIABILITY OF
SMALL BANKS
The total number of small banks and their
share of industry assets have been falling in recent
years. This trend has led many analysts to ques-
tion whether small, “community” banks remain
viable in today’s banking environment. Advances
in communications and information-processing
technology have eroded the benefits of close
proximity and local ties that traditionally enabled
community banks to provide financial services
profitably to small firms and other local borrow-
ers. In addition, the removal of state and federal
restrictions on branch banking has put further
strain on many community banks by exposing
them to increased competition.
Conclusions about the viability of community
banks have often been based on comparisons of
the profit rates of small and large banks. For exam-
ple, DeYoung, Hunter, and Udell (2004) compare
after-tax rates of return (ROA and ROE) of com-
munity and rural banks with those of mid-size
banks (defined as banks with assets between $1
billion and $10 billion of assets) and large banks
(defined as banks with at least $10 billion of
assets). Their data on bank profits are not adjusted
for the corporate income tax that S-banks would
pay if they were taxed like C-banks.
DeYoung, Hunter, and Udell (2004) show
that in 2001, the average ROA of “best practice”
9
Hein, Koch, and MacDonald (2005) and Keeton, Harvey, and
Willis (2003) also note that the growing number of banks electing
S status distorts comparison of after-tax rates of return across
banks and especially comparisons between groups of large and
small banks.
Gilbert and Wheelock
522
NOVEMBER
/
DECEMBER
200 7
FEDERA L RESERVE BANK OF S T
.
LOUIS
RE V I EW
community banks exceeded the average ROA of
mid-size and large banks, where “best-practice”
banks are defined as those with an ROE exceeding
the median for their asset-size group. In addition,
these authors show that the average ROE of best-
practice community banks with at least $100
million of assets also exceeded average ROE for
mid-size and large banks. The authors conclude
that these and other comparisons strongly suggest
that the “community bank business model is
economically viable,” though they also note that
many community banks are not operating profit-
ably or at an efficient scale (p. 122).
Table 4 updates and extends the analysis of
DeYoung, Hunter, and Udell (2004) using data
for 2005. The table reports mean values of ROA
and ROE for three groups of community banks
based on asset size and for all community banks
headquartered in rural areas (i.e., outside of met-
ropolitan statistical areas). As in DeYoung, Hunter,
and Udell (2004), we define large community
banks as those with assets between $500 million
and $1 billion of assets, medium community
banks as those with assets between $100 million
and $500 million of assets, and small community
banks as those with assets less than $100 million.
We identify large banks as those with total assets
in excess of $1 billion. For each group, we report
separate means for banks with ROE exceeding
the group median and for those with ROE below
the group median. Further, we report means
based on the standard after-tax ROA and ROE
measures and for data using the tax-adjusted S-
bank measure.
10
As shown in Table 4, for each group of com-
munity banks the mean values of unadjusted ROA
and ROE for the best-practice banks exceed those
for large banks—where, again, best-practice banks
are defined as those with ROE above the median
for their group and large banks are defined as
those with assets in excess of $1 billion. Among
large community banks, for example, best-practice
banks have a mean ROA of 1.55 percent, com-
pared with a mean of 1.32 percent for large banks.
Among rural community banks, best-practice
banks have a mean ROA of 1.45 percent. How-
ever, the group means are substantially reduced
if one adjusts S-bank earnings rates to include
estimates of their hypothetical federal tax liabil-
ity. For example, among large community banks,
the mean adjusted ROA of best-practice banks is
1.43 percent, whereas among rural community
banks, the mean adjusted ROA of best-practice
Gilbert and Wheelock
FEDERA L RESERVE BANK OF S T
.
LOUIS
RE V I EW
NOVEMBER
/
DECEMBER
20 0 7 523
10
Our data are from the UBPR and include all banks in peer groups
1 through 15. However, we omitted banks with extreme values of
ROA (those in the upper-most or smallest 1 percent tails of the
distribution) to eliminate outliers and some banks that appear to
have been misclassified in the UBPR.
Table 4
Implication of S-bank Adjustment for Mean ROA and ROE of Best- and Worst-Practice Banks,
2005
ROA ROE
Above median ROE Below median ROE Above median ROE Below median ROE
Unadjusted Adjusted Unadjusted Adjusted Unadjusted Adjusted Unadjusted Adjusted
Large community banks 1.55 1.43 0.94 0.92 17.95 16.55 9.36 9.24
Medium community banks 1.60 1.36 0.89 0.87 17.87 15.30 8.37 8.18
Small community banks 1.52 1.22 0.71 0.67 15.39 12.36 5.68 5.45
Rural community banks 1.45 1.19 0.60 0.57 15.10 12.37 4.65 4.46
Mean value for large banks 1.32 14.14
NOTE: Includes only those banks in peer groups 1 through 15 of the Uniform Bank Performance Report. Data exclude banks with
ROA among the largest or smallest 1 percent of observations.
banks is 1.19 percent. Further, among both small
and rural community banks, the mean values of
adjusted ROA and adjusted ROE for best-practice
banks are lower than the overall means for large
banks. Of course, these results do not necessarily
imply that small community banks and rural
banks are not viable. A definitive answer to the
viability question would require a full account-
ing of the costs and benefits of electing S-bank
tax treatment, which include not only the corpo-
rate and personal income tax issues, but also the
implications for growth associated with legal
limits on the number of shareholders an S-bank
may have. However, the analysis here does show
that conclusions about the profitability of banks
of different sizes, and hence about the viability
of small banks, can be markedly affected by
whether or not one adjusts rate of return meas-
ures to include estimates of the federal corporate
income taxes that S-banks would pay if subject
to that tax.
A COMPARISON OF S- AND
C-BANK CHARACTERISTICS
The UBPR tax adjustment of S-bank profits
closes much of the gap between the after-tax profit
rates of S- and C-banks of similar asset size. How-
ever, for most size groups it does not close the
gap entirely. For all years from 1997 to 2005, we
find that even with the imputation for federal
corporate income taxes, S-banks tend to have
higher adjusted rates of return than do C-banks.
Table 5 presents information for 2005. For banks
in the same asset-size group, the means of adjusted
ROA and adjusted ROE of S-banks are higher
than those of C-banks. The p-values shown below
the differences in the mean profit rates of S-banks
and C-banks in the bottom panel of Table 5 indi-
cate that these differences are statistically signifi-
cant for banks with assets of less than $1 billion.
11
We made similar comparisons for other years
and obtained results that are similar to those for
2005, except as noted below.
12
There are several possible explanations for
why the tax-adjusted earnings rates of S-banks
tend to exceed the earnings rates of C-banks. The
UBPR adjustment to the net income of S-banks
does not take into account any differences in the
applicability of state corporate income or other
taxes between S- and C-banks. In addition, this
report makes no attempt to adjust profit measures
for differences in the incentives that S- and C-
banks face in the management of their revenues
and expenses because of the differences in how
their income is taxed. The adequacy of the UBPR
net income adjustment has implications for stud-
ies involving bank profit rates, such as those
addressing the viability of community banks.
For example, if the adjustment is too small, then
the differences between the adjusted and unad-
justed profit measures for small banks shown in
Table 4 understate the true differences.
Comparison of Mean Values of Various
Financial Ratios Across S- and C-Banks
Aside from the possibility that the UBPR tax
adjustment of S-bank earnings is incomplete,
S-banks might have higher average earnings rates
than similar-size C-banks because of superior
operating efficiency. This section compares S-
and C-banks on the basis of various financial
characteristics in an effort to understand better
why S-bank earnings rates tend to exceed those
of C-banks.
We compare S- and C-bank performance on
measures of pre-tax net operating income (as a
percentage of average total assets), net interest
income, net non-interest income, and cost effi-
ciency.
13
As shown in Table 5, we find that S-
banks consistently have higher pre-tax profit rates
11
The information reported in Table 5 is based on data for all com-
mercial banks assigned to peer groups 1 through 15 in the UBPR
except those with values for ROA among the upper or lower 1
percent in a given year. By dropping banks with extreme values of
ROA, we avoided including observations with implausible values,
some of which were for banks that appeared to be misclassified in
the UBPR.
Gilbert and Wheelock
524
NOVEMBER
/
DECEMBER
200 7
FEDERA L RESERVE BANK OF S T
.
LOUIS
RE V I EW
12
For banks with assets between $300 million and $1 billion, the
difference is statically significant in some years between 1997
and 2004. For banks with less than $300 million, the difference is
statically significant in every year.
13
See Harvey and Padget (2000) for additional discussion of the
implications of S-status election for commercial banks and evi-
dence on differences in the characteristics and performance of
S- and C-banks during 1997-99.
Gilbert and Wheelock
FEDERA L RESERVE BANK OF S T
.
LOUIS
RE V I EW
NOVEMBER
/
DECEMBER
20 0 7 525
Table 5
Mean Values of Various Performance Measures, 2005
S-Banks
Op. profit + Net Net
ROA ROE Pre-tax op. personnel/ interest non-interest Cost
Bank size group adjusted adjusted profit/assets assets margin margin efficiency
More than $1 billion 1.35 15.20 2.02 3.74 4.31 –1.80 56.80
$300 million to $1 billion 1.24 14.06 1.79 3.65 4.45 –2.03 58.27
$100 to $300 million 1.18 12.80 1.69 3.51 4.44 –2.17 60.15
$50 to $100 million 1.09 11.20 1.56 3.37 4.37 –2.29 62.65
Less than $50 million 0.99 9.31 1.42 3.32 4.40 –2.47 66.32
C-Banks
Op. profit + Net Net
Pre-tax op. personnel/ interest non-interest Cost
Bank size group ROA ROE profit/assets assets margin margin efficiency
More than $1 billion 1.27 13.76 1.93 3.40 3.89 –1.42 54.98
$300 million to $1 billion 1.17 12.70 1.73 3.41 4.21 –1.92 58.56
$100 to $300 million 1.06 10.85 1.53 3.28 4.33 –2.20 62.01
$50 to $100 million 0.94 8.95 1.33 3.18 4.34 –2.46 66.91
Less than $50 million 0.82 6.96 1.11 3.18 4.35 –2.67 76.62
Difference Between C-Banks and S-Banks (mean and p-value for hypothesis tests)
Op. profit + Net Net
Pre-tax op. personnel/ interest non-interest Cost
Bank size group ROA* ROE* profit/assets assets margin margin efficiency
More than $1 billion –0.07 –1.45 –0.09 –0.34 –0.42 0.38 –1.82
0.32 0.20 0.33 0.07 0.04 0.02 0.34
$300 million to $1 billion –0.07 –1.34 –0.06 –0.24 –0.24 0.11 0.29
0.05 0.00 0.19 0.02 0.01 0.06 0.38
$100 to $300 million –0.12 –1.97 –0.16 –0.23 –0.11 –0.03 1.85
0.00 0.00 0.00 0.00 0.02 0.27 0.00
$50 to $100 million –0.16 –2.24 –0.23 –0.19 –0.03 –0.18 4.26
0.00 0.00 0.00 0.00 0.30 0.00 0.00
Less than $50 million –0.18 –2.48 –0.31 –0.14 –0.05 –0.19 10.30
0.00 0.00 0.00 0.04 0.23 0.00 0.04
NOTE: ROA* (ROE*): Difference between mean ROA (ROE) of C-banks and mean adjusted ROA (ROE) for S-banks; p-values for the
hypothesis test are below the differences. Sample includes only those banks in peer groups 1 through 15 of the Uniform Bank
Performance Report. Data exclude banks with ROA among the largest or smallest 1 percent of observations. Bank size groups are
based on total end-of-period assets.
than C-banks of similar size, and the differences
are statistically significant for banks with less than
$300 million of assets.
14
S-banks also tend to
have higher net interest margins (i.e., net interest
income divided by average earning assets) than
C-banks, as reflected in higher mean values across
all size groups.
15
For 2005, the differences in the
means are statistically significant for banks in
the three largest size groups. However, for banks
with less than $100 million of assets, we cannot
reject the hypothesis that mean values of net
interest margins of S- and C-banks are equal.
Although for other years we also find that S-banks
tend to have higher mean net interest margins
than C-banks, the differences in the means are
often not statistically significant, especially for
the smallest banks.
We also compare non-interest margins (i.e.,
net non-interest income divided by average total
assets) across S- and C-banks. For banks with less
than $100 million of assets, S-banks consistently
have higher mean non-interest margins than C-
banks. However, for larger banks, especially those
with more than $300 million of assets, we find
that S-banks tend to have lower mean non-interest
margins than C-banks, and the difference is sta-
tistically significant in some years.
16
Finally, we compare the cost efficiency of S-
and C-banks using the efficiency ratio (i.e., total
overhead expenses as a percentage of net interest
income plus non-interest income). Except for
banks with at least $1 billion of assets, we find
that S-banks consistently have lower efficiency
ratios than C-banks (implying that S-banks are
more cost efficient). Mean values are significantly
smaller for S-banks with less than $300 million
of assets than for C-banks of similar size. We also
find that S-banks tend to have smaller mean effi-
ciency ratios than C-banks in other years, though
the differences are consistently statistically sig-
nificant only for banks with less than $100 million
of assets. Hence, it appears that relatively low
overhead expenses can account for at least part of
the higher profit rates of smaller S-banks as com-
pared with C-banks. For S-banks with between
$100 million and $300 million of assets, we find
that both lower overhead expenses and higher net
interest margins may play some role; whereas,
for S-banks with between $300 million and $1
billion of assets, a higher net interest margin is
more important for explaining the higher profit
rates of S-banks.
17
Taxes may account for some of the tendency
for S-banks to have lower overhead expenses than
C-banks of similar size, which further suggests
caution when comparing either pre-tax or adjusted
after-tax profit rates across S- and C-banks. S-
banks are closely held corporations, and their
senior managers often own a high percentage of
the outstanding stock of the banks they manage.
Owner/managers generally prefer to receive
income in the form of earnings distributions
rather than salary because salary is subject to
employment taxes but other distributions are not.
S-banks are required to pay reasonable compen-
sation to shareholder-employees,
18
but the differ-
ential tax treatment of salary income and other
distributions of S-bank earnings might help
explain the tendency for S-banks to have rela-
tively lower overhead expenses, and hence higher
pre-tax operating profit rates, than C-banks.
Unfortunately, data on the salaries of share-
holder-employees of banks are not available to
test for differences in the compensation of owner/
managers of S- and C-banks. The UBPR does pro-
vide data on total personnel expenses, however.
We test whether lower personnel expenses can
explain the higher mean pre-tax operating profit
rates of S-banks. Table 5 reports mean values of
Gilbert and Wheelock
526
NOVEMBER
/
DECEMBER
200 7
FEDERA L RESERVE BANK OF S T
.
LOUIS
RE V I EW
14
For banks with assets between $300 million and $1 billion, this
difference is statistically significant in some years between 1997
and 2004. For banks with less than $300 million, the difference is
statistically significant in every year.
15
The UBPR makes a tax-equivalent adjustment to net interest
income and, hence, to net interest margin, to account for differences
in the tax treatment of different assets that banks hold without
regard to whether a bank is an S- or C-bank. The implications of
this adjustment are examined in a later section.
16
Because there were very few S-banks with more than $1 billion of
assets, especially before 2001, differences in the mean values for
S- and C-banks in this size range are not especially interesting.
17
The UBPR does not include data on the efficiency ratio before
2000. In addition, for banks with between $300 million and $1
billion of assets, in some years, the differences between mean
values for S- and C-banks of net interest margin, and of net pre-
tax operating profit, are not statistically significant.
18
See Hritz (2005).
the sum of pre-tax net operating profit (as a per-
centage of average total assets) plus personnel
expenses (also as a percentage of average total
assets) for banks in the five size groups. If lower
personnel expenses account for the higher pre-tax
operating profit of S-banks, we would expect to
fail to reject the hypotheses that the mean values
of the sum of personnel expenses and pre-tax net
operating profit are equal for S- and C-banks.
However, we reject the hypothesis at standard
significance levels for banks in all size groups,
indicating that lower personnel expenses cannot
account fully for the higher mean pre-tax operat-
ing profit rates of S-banks.
19
Ex Ante Performance of S-Banks
We have been unable to identify definitively
why S-banks tend to earn more than C-banks of
similar size. Therefore, we next investigate the
C-banks that have become S-banks and whether
Gilbert and Wheelock
FEDERA L RESERVE BANK OF S T
.
LOUIS
RE V I EW
NOVEMBER
/
DECEMBER
20 0 7 527
19
For banks with $300 million or more of assets, we cannot reject
the hypothesis in some years. However, we always reject the
hypothesis for banks with less than $300 million of assets.
Table 6
2004 Performance of C-Banks that Became S-Banks in 2005
P
re-tax
operating Net interest Cost Number
Bank size group ROA ROE profit/assets margin efficiency of banks
Performance of C-banks that became S-banks in 2005 (mean values of various performance measures in 2004)
More than $1 billion 1.22 13.15 1.91 4.17 62.07 3
$300 million to $1 billion 1.23 14.62 1.83 4.44 58.37 9
$100 to $300 million 1.06 11.06 1.55 4.38 62.79 40
$50 to $100 million 1.06 10.58 1.57 4.43 62.96 40
Less than $50 million 0.91 8.19 1.24 4.32 70.18 35
Performance of C-banks that did not become S-banks in 2005 (mean values of various performance measures in 2004)
More than $1 billion 1.22 13.53 1.81 3.82 57.77 398
$300 million to $1 billion 1.13 12.28 1.65 4.10 60.19 850
$100 to $300 million 1.03 10.63 1.48 4.25 63.11 1,701
$50 to $100 million 0.91 8.69 1.27 4.27 67.11 1,056
Less than $50 million 0.78 6.90 1.08 4.30 71.57 923
Means of non-converting banks minus means of converting banks (p-values for hypothesis tests of equal means)
More than $1 billion 0.00 0.38 –0.10 –0.35 –4.29
0.35 0.35 0.33 0.14 0.30
$300 million to $1 billion –0.10 –2.34 –0.18 –0.34 1.83
0.26 0.14 0.23 0.06 0.30
$100 to $300 million –0.03 –0.43 –0.07 –0.13 0.32
0.36 0.32 0.30 0.16 0.39
$50 to $100 million –0.16 –1.89 –0.30 –0.16 4.15
0.02 0.01 0.00 0.10 0.03
Less than $50 million –0.12 –1.28 –0.16 –0.02 1.39
0.08 0.09 0.12 0.39 0.32
NOTE: Includes only those banks in peer groups 1 through 15 of the Uniform Bank Performance Report. Data exclude banks with
ROA among the largest or smallest 1 percent of observations.
they had higher rates of return than other C-banks
before they became S-banks. If so, it would sug-
gest that at least some of the tendency for S-banks
to have higher rates of return than C-banks might
be due to inherent characteristics rather than their
status as S-banks.
Table 6 presents summary data on several
financial ratios for banks that converted to S-
banks during 2005. The table reports mean values
of various performance measures as of year-end
2004 for C-banks that converted to S-bank status
during 2005, as well as for C-banks that remained
C-banks in 2005. The table also reports the differ-
ences in the mean values for converting and non-
converting banks and p-values for tests of the
hypothesis that the means of converting and non-
converting banks are equal. Only three banks with
more than $1 billion of assets became S-banks in
2005. Among smaller banks we find a tendency
for converting banks to have had higher rates of
return during 2004 than non-converting banks.
Converting banks with less than $100 million of
assets had significantly higher ROA, ROE, and
pre-tax operating-profit rates during 2004 than
did non-converting banks. Converting S-banks
with between $300 million and $1 billion of
assets had significantly higher net interest margins
than similar-sized non-converting banks; convert-
ing banks with between $50 million and $100
million of assets had significantly lower cost effi-
ciency ratios (i.e., they were more cost efficient).
Table 7 reports data for other years; specifi-
cally, the table shows the differences in the mean
values of ROA and ROE between non-converting
and converting banks in the indicated years. As in
Table 6, the mean values used to prepare Table 7
are as of December 31 of the year prior to conver-
sion, and the differences shown are the mean
values for non-converting banks less the mean
values for converting banks. As shown in the
table, the banks that converted to S-bank status
in a given year tended to have higher ROA and
ROE in the year before they converted to S-bank
status than the banks that did not convert; in
several cases the differences in the means are
statistically significant. Hence, it appears that
characteristics other than S-bank status explain
at least some of the tendency for S-banks to out-
earn C-banks of similar size. Banks that choose
to switch to S-bank status appear to be systemati-
cally different from those of similar size that do
not elect S-status.
Gilbert and Wheelock
528
NOVEMBER
/
DECEMBER
200 7
FEDERA L RESERVE BANK OF S T
.
LOUIS
RE V I EW
Table 7
Means of Non-Converting Banks Minus Means of Converting Banks
(p-values for hypothesis tests of equal means)
2005 2004 2003 2002
B
ank size group
ROA ROE N* ROA ROE N* ROA ROE N* ROA ROE N*
More than $1 billion 0.00 0.38 3 n/a n/a 0 n/a n/a 0 n/a n/a 0
0.35 0.35 n/a n/a n/a n/a n/a n/a
$300 million to $1 billion –0.10 –2.34 9–0.06 1.47 7 0.02 0.47 14 –0.07 –2.23 15
0.26 0.14 0.29 0.15 0.38 0.33 0.28 0.09
$100 to $300 million -0.03 –0.43 40 –0.15 –1.87 39 –0.11 –1.39 59 –0.02 –0.29 42
0.36 0.32 0.01 0.02 0.09 0.06 0.36 0.36
$50 to $100 million –0.16 –1.89 40 –0.12 –1.53 40 –0.23 –2.82 43 –0.23 –2.96 66
0.02 0.01 0.10 0.09 0.00 0.00 0.00 0.00
Less than $50 million –0.12 –1.28 35 –0.27 –3.03 45 –0.17 –1.80 54 –0.18 –1.99 78
0.08 0.09 0.00 0.00 0.03 0.02 0.00 0.00
NOTE: N*: Number of C-banks converting to S-banks in given year. Includes only those banks in peer groups 1 through 15 of the
Uniform Bank Performance Report. Data exclude banks with ROA among the largest or smallest 1 percent of observations. Bank size
groups are based on total end-of-period assets.
PRE-TAX EARNINGS AS AN
ALTERNATIVE EARNINGS
MEASURE
The pitfalls of comparing banks on the basis
of after-tax measures of return caused by the pro-
liferation of S-banks have led some analysts and
regulators to use pre-tax profit measures. For
example, the FDIC uses income before taxes and
extraordinary charges (as a percentage of total
assets) in its statistical model designed to identify
banks whose financial condition has deteriorated
significantly since its last on-site examination
(Collier et al., 2003).
20
Presumably, however,
banks seek to maximize after-tax profit, and pre-
tax profit is not necessarily a good measure of a
bank’s performance. Many banks invest substan-
tial proportions of their assets in securities that
yield tax-exempt income. By holding large
amounts of tax-advantaged securities, a bank
could appear relatively unprofitable on a pre-tax
basis but highly profitable on an after-tax basis.
The UBPR includes an adjustment to make
pre-tax operating profits more comparable across
banks with different mixes of taxable and tax-
exempt securities.
21
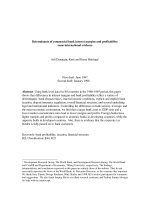
Figure 4 shows the impact of
this adjustment on median pre-tax net operating
income divided by average total assets for large
and small banks, where, as before, large banks are
defined as those with $1 billion or more of assets
and small banks are those with less than $1 billion
of assets. The figure shows that over the 10-year
period from 1996 to 2005, the median pre-tax net
operating-income rate of large banks consistently
exceeded that of small banks. Further, the figure
shows the impact of the adjustment of pre-tax
operating income rates for tax-exempt income.
The dotted lines show median pre-tax net oper-
ating income rates with the adjustment for tax-
exempt income. Over the 10-year period, the
adjustment contributed between 0.06 and 0.10
percentage points to the median rate for large
banks and between 0.10 and 0.13 percentage
Gilbert and Wheelock
FEDERA L RESERVE BANK OF S T
.
LOUIS
RE V I EW
NOVEMBER
/
DECEMBER
20 0 7 529
2001 2000 1999 1998 1997
ROA ROE N* ROA ROE N* ROA ROE N* ROA ROE N* ROA ROE N*
n/a n/a 0 n/a n/a 0–0.22 –1.82 1–0.42 –1.19 1–0.25 –1.59 1
n/a n/a n/a n/a n/a n/a n/a n/a n/a n/a
–0.08 –0.73 9–0.23 –2.56 3 0.27 1.51 5–0.25 –2.96 12 0.07 1.66 6
0.28 0.34 0.14 0.15 0.04 0.19 0.04 0.11 0.37 0.33
–0.14 –1.05 41 –0.04 –0.31 37 –0.05 –0.58 58 –0.09 –0.54 75 –0.19 –1.92 86
0.06 0.20 0.29 0.35 0.25 0.26 0.07 0.24 0.00 0.00
–0.22 –2.17 58 –0.10 –0.69 55 –0.10 –2.06 90 –0.17 –1.76 131 –0.17 –2.68 174
0.00 0.00 0.16 0.27 0.02 0.00 0.00 0.00 0.00 0.00
–0.18 –2.27 96 –0.21 –1.72 93 –0.18 –1.78 109 –0.14 –1.61 224 –0.18 –1.93 299
0.00 0.00 0.00 0.00 0.00 0.00 0.00 0.00 0.00 0.00
20
The Federal Reserve uses a similar model (Board of Governors of
the Federal Reserve System, 2006). See also Whalen (2005).
21
Pre-tax net operating income (TE) equals net interest income (on a
tax-equivalent basis) plus non-interest income and realized gains
(or losses) on securities, less non-interest expenses, provisions for
loan and lease–financing receivables losses, and provisions for
allocated transfer risk. See FFIEC (2006, Section III, p. 4).
Table 7, cont’d
points to the median rate for small banks.
Although the impact of the adjustment on pre-tax
net operating-income rates has typically been
somewhat larger for small banks than for large
banks, the adjustment added approximately
0.10 percentage points to the median pre-tax net
operating-income rates of both large and small
banks in 2005.
CONCLUSIONS
The proliferation of banks that elect sub-
chapter S tax treatment has greatly complicated
the meaningful comparison of banks on the basis
of after-tax rates of return. Because S-bank earn-
ings are not subject to the federal corporate
income tax, S-banks generally have higher after-
tax rates of return than other commercial banks
(i.e., C-banks). However, S-bank shareholders
face a personal income tax liability for their pro
rata share of the bank’s entire earnings—not just
the portion distributed as dividends. S-banks
have proliferated, however, because the dividends
that they pay to shareholders are not taxed twice.
S-banks are permitted to have no more than 100
shareholders, which generally restricts the elec-
tion of S-status to small banks that do not antici-
pate rapid growth and whose shares do not trade
publicly.
In an attempt to make after-tax earnings rates
of S-banks comparable with those of C-banks, the
Uniform Bank Performance Report produced by
the Federal Financial Institutions Examination
Council includes estimates of the federal corpo-
rate income taxes that S-banks would pay if sub-
ject to that tax. Using these estimates, this article
shows that the different federal tax treatments of
S- and C-banks has a quantitatively large impact
on comparisons of mean after-tax profit rates
across banks. Because most S-banks are smaller
institutions, comparisons of mean after-tax rates
of return across groups of different-size banks are
especially problematic. If S-bank earnings are not
Gilbert and Wheelock
530
NOVEMBER
/
DECEMBER
200 7
FEDERA L RESERVE BANK OF S T
.
LOUIS
RE V I EW
1
1.2
1.4
1.6
1.8
2
2.2
1996 1997 1998 1999 2000 2001 2002 2003 2004 2005
P
ercent
Adjusted Pre-Tax Operating Income Large Banks
Adjusted Pre-Tax Operating Income Small Banks
Pre-Tax Operating Income Large Banks
Pre-Tax Operating Income Small Banks
Figure 4
Impact of Adjustment for Tax-Exempt Income on Pre-Tax Net Operating Income/Assets
adjusted to make them comparable with C-bank
earnings, we find that mean earnings rates of
groups of best-practice small banks compare
favorably with mean earnings rates of large banks,
similar to the results of DeYoung, Hunter, and
Udell (2004). However, we also find that mean
earnings rates of best-practice small banks are
considerably lower if S-bank earnings are adjusted
by estimates of federal income taxes, indicating
that conclusions of studies that use net after-tax
income as a measure of performance can be
affected markedly by whether or not S-bank
earnings rates are adjusted for taxes.
Our research also finds that S-banks tend to
have higher rates of return than C-banks of similar
size even when S-bank earnings rates are adjusted
by the UBPR estimates of their hypothetical fed-
eral corporate income taxes. Smaller S-banks also
tend to have higher pre-tax net operating income
rates than similar-sized C-banks, mainly because
of lower expenses and higher ratios of net non-
interest income to assets, whereas larger S-banks
tend to have higher net interest margins than C-
banks of similar size. Owner/managers of S-banks
generally prefer to receive income in the form of
distributed earnings, rather than salary, to limit
employment taxes. However, we find that lower
personnel expenses do not explain fully the ten-
dency for S-banks to have higher pre-tax net
operating income rates than C-banks. Finally, we
find that C-banks that became S-banks in a given
year tended to have higher after-tax rates of return
than other C-banks in the year before they became
an S-bank. This result suggests that characteristics
other than election of subchapter S tax status
account for some of the tendency for S-banks to
out-earn C-banks. The banks that choose S-bank
tax status appear to be systematically different
from other banks of similar asset size.
The growth in the number of banks electing
subchapter S tax treatment has seriously com-
promised the usefulness of standard after-tax
return measures, such as ROA and ROE, for com-
paring profit rates across banks, and undoubtedly
explains the increasing use of pre-tax earnings
measures in studies of bank performance. Our
study does not show that any particular measure
of return is superior for comparing the profit rates
of different banks, as the ideal measure largely
depends on the question at hand. The evidence
reported here indicates that researchers and other
analysts should exercise caution when using any
profit measure to evaluate bank performance,
however, particularly in light of the proliferation
of S-banks.
REFERENCES
Bassett, William F. and Brady, Thomas F. “The
Economic Performance of Small Banks, 1985-2000.”
Federal Reserve Bulletin, November 2001, 87(11),
pp. 719-28.
Board of Governors of the Federal Reserve System.
Commercial Bank Examination Manual.
Washington, DC: 2006;
www.federalreserve.gov/boarddocs/SupManual.
Collier, Charles; Forbush, Sean; Nuxoll, Daniel A.
and O’Keefe, John. “The SCOR System of Off-Site
Monitoring: Its Objectives, Functioning, and
Performance.” FDIC Banking Review, 2003, 15(3),
pp. 17-32.
DeYoung, Robert; Hunter, William C. and Udell,
Gregory F. “The Past, Present, and Probable Future
for Community Banks.” Journal of Financial
Services Research, April/June 2004, 25(2/3),
pp. 85-133.
Federal Financial Institutions Examination Council.
A User’s Guide for the Uniform Bank Performance
Report. Arlington, VA: March 2006.
Harvey, James and Padget, Jane. “Subchapter S—
A New Tool for Enhancing the Value of Community
Banks.” Federal Reserve Bank of Kansas City
Financial Industry Perspectives, December 2000,
pp. 17-31.
Hein, Scott E.; Koch, Timothy W. and MacDonald, S.
Scott. “On the Uniqueness of Community Banks.”
Federal Reserve Bank of Atlanta Economic Review,
First Quarter 2005, 90(1), pp. 15-36.
Hritz, Steven R. “Reasonable Compensation and SE
Taxes.” Tax Advisor, October 2005, pp. 608-10.
Gilbert and Wheelock
FEDERA L RESERVE BANK OF S T
.
LOUIS
RE V I EW
NOVEMBER
/
DECEMBER
20 0 7 531
Keeton, William; Harvey, James and Willis, Paul.
“The Role of Community Banks in the U.S.
Economy.” Federal Reserve Bank of Kansas City
E
conomic Review, Second Quarter 2003, 88(2),
pp. 15-43.
Landau, Zev. “Recent Reform and Simplifications for
S Corporations.” CPA Journal, November 2005,
75(11), pp. 46-50.
Whalen, Gary. “A Hazard Model of CAMELS
Downgrades of Low-Risk Community Banks.”
Working Paper No. 2005-1, Office of the Comptroller
of the Currency, May 2005.
Gilbert and Wheelock
532
NOVEMBER
/
DECEMBER
200 7
FEDERA L RESERVE BANK OF S T
.
LOUIS
RE V I EW