Báo cáo khoa học: The silencing of adenine nucleotide translocase isoform 1 induces oxidative stress and programmed cell death in ADF human glioblastoma cells doc
Bạn đang xem bản rút gọn của tài liệu. Xem và tải ngay bản đầy đủ của tài liệu tại đây (819.05 KB, 15 trang )
The silencing of adenine nucleotide translocase isoform 1
induces oxidative stress and programmed cell death in
ADF human glioblastoma cells
Annalisa Lena
1
*, Mariarosa Rechichi
1
*, Alessandra Salvetti
1
, Donatella Vecchio
1
,
Monica Evangelista
2
, Giuseppe Rainaldi
2
, Vittorio Gremigni
1
and Leonardo Rossi
1,3
1 Dipartimento di Morfologia Umana e Biologia Applicata, University of Pisa, Italy
2 Laboratorio di Terapia Genica e Molecolare, Istituto di Fisiologia Clinica, CNR, Pisa, Italy
3 Istituto Toscano Tumori, Italy
Introduction
Adenine nucleotide translocase (ANT) represents a
crucial player in the crosstalk between mitochondrial
and cytoplasmic energetic pools. Indeed, it catalyzes
the last step of oxidative phosphorylation: the
exchange of ATP generated in mitochondria by ATP
synthase with the ADP produced in the cytosol by
most energy-consuming reactions [1–3]. In humans,
four different ANT isoforms have been identified:
ANT1 is predominant in differentiated tissues; ANT2
is present in proliferating cells; and ANT3 is ubiqui-
tous. ANT4 has been recently identified through a
genome scan and appears to be exclusively expressed
in testis [4–9]. ANT2 mRNA levels are high also in
tumors, especially in neoplastic cells with high glyco-
lytic rates [10–13].
Apart from their unique role in ATP ⁄ ADP
exchange, ANT proteins are also involved in the for-
mation of the permeability transition pore [14], they
act as uncoupling proteins in both basal and fatty acid
induced proton conductance [15], and they mediate
protoporfirine IX transport through the inner mito-
chondrial membrane for heme biosynthesis [16].
Keywords
adenine nucleotide translocase; ADF cells;
glioblastoma multiforme; mitochondrion;
reactive oxygen species
Correspondence
L. Rossi, Dipartimento di Morfologia Umana
e Biologia Applicata, Sezione di Biologia e
Genetica, Via Volta 4, 56126 Pisa, Italy
Fax: +39 050 2219 101
Tel: +39 050 2219 112
E-mail:
*These authors contributed equally to this
work.
(Received 17 December 2009, revised
12 April 2010, accepted 28 April 2010)
doi:10.1111/j.1742-4658.2010.07702.x
Adenine nucleotide translocases (ANTs) are multitask proteins involved in
several aspects of cell metabolism, as well as in the regulation of cell
death ⁄ survival processes. We investigated the role played by ANT isoforms
1 and 2 in the growth of a human glioblastoma cell line (ADF cells). The
silencing of ANT2 isoform, by small interfering RNA, did not produce sig-
nificant changes in ADF cell viability. By contrast, the silencing of ANT1
isoform strongly reduced ADF cell viability by inducing a non-apoptotic
cell death process resembling paraptosis. We demonstrated that cell death
induced by ANT1 depletion cannot be ascribed to the loss of the
ATP ⁄ ADP exchange function of this protein. By contrast, our findings
indicate that ANT1-silenced cells experience oxidative stress, thus allowing
us to hypothesize that the effect of ANT1-silencing on ADF is mediated by
the loss of the ANT1 uncoupling function. Several studies ascribe a pro-
apoptotic role to ANT1 as a result of the observation that ANT1 overex-
pression sensitizes cells to mitochondrial depolarization or to apoptotic
stimuli. In the present study, we demonstrate that, despite its pro-apoptotic
function at a high expression level, the reduction of ANT1 density below a
physiological baseline impairs fundamental functions of this protein in
ADF cells, leading them to undertake a cell death process.
Abbreviations
ANT, adenine nucleotide translocase; ATR, atractyloside; AVO, acidic vesicular organelle; BA, bongkrekic acid; CCCP, carbonyl cyanide
m-chlorophenylhydrazone; NAC, N-acetyl-
L-cysteine; ROS, reactive oxygen species; siRNA, small interfering RNA.
FEBS Journal 277 (2010) 2853–2867 ª 2010 The Authors Journal compilation ª 2010 FEBS 2853
Because of their multitask nature, ANTs are
involved in several aspects of cell metabolism, as well
as in cell survival ⁄ death processes, and have been
related to several pathologies, including cancer and
neurodegenerative diseases [17,18]. Moreover, recent
data indicate that ANT isoforms play different, some-
times opposing, roles, suggesting that their expression
pattern may allow cells to adapt to specific require-
ments [5,11,19–23]. In particular, ANT1 and ANT3
are considered to play a pro-apoptotic role [19,24],
whereas ANT2 down-regulation produces a strong
reduction in breast cancer cell viability and chemosen-
sitizes HeLa cells to lonidamine treatment [20,21].
The present study aims to provide new information
about the function of ANT proteins in the regulation
of cell death⁄ survival processes. We analyzed the role
of ANT1 and ANT2 isoforms in a human glioblas-
toma cell line, the ADF cells in which, we had pre-
viously characterized the effect of several putative
ANT targeting agents [25]. We found that ANT2 is
more abundant than ANT1 in ADF cells, although we
observed that silencing of ANT1, but not ANT2,
strongly reduced ADF viability by inducing an
increase in oxidative stress that leads to cell death. We
also demonstrated that the ANT1-silencing effect on
cell viability is independent of its primary role in
ATP ⁄ ADP exchange. Our data allow us to suggest a
model in which ANT1 depletion might trigger, in
ADF cells, an increase in cellular reactive oxygen spe-
cies (ROS) as a consequence of a reduction in its basal
proton conductance function.
Results
ANT1 and ANT2 small interfering RNAs (siRNAs)
efficiently down-regulate the expression of their
corresponding ANT isoform
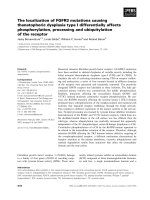
The amount of ANT1 and ANT2 transcripts
expressed in ADF cells was evaluated by absolute
real-time RT-PCR. As shown in Fig. 1A, the number
of ANT2 transcripts is approximately five-fold higher
than that of ANT1 transcripts. Specific siRNAs were
designed to selectively down-regulate ANT1 and
ANT2 isoforms. The siRNAs were tested for their
ability to reduce the expression of their cognate
mRNAs by absolute real-time quantification of ANT1
and ANT2 specific transcripts. As shown in Fig. 1B,C,
ANT1 and ANT2 siRNAs were able to strongly
reduce (by more than ten-fold) the expression of their
cognate mRNAs with respect to nontransfected ADF
cells or Scramble-transfected ADF cells, 24 h after
transfection. Importantly, ANT1 siRNAs did not
modify the expression level of ANT2, and ANT2 siR-
NAs did not modify the expression level of ANT1
(Fig. 1B,C). Moreover, both ANT1 and ANT2
siRNAs did not modify ANT3 expression (data not
shown). The reduction in the amount of isoform spe-
cific transcripts is maintained for least 72 h after
transfection (data not shown).
We also evaluated the ability of ANT1 and ANT2
specific siRNAs to reduce ANT expression at the pro-
tein level. Because of the absence of a specific antibody
able to discriminate between isoforms 1 and 2, only a
partial reduction of ANT protein is appreciable after
ANT2 and especially ANT1 siRNA transfection by
western blot analysis, as performed using polyclonal
anti-ANT serum, 72 h after transfection (Fig. 1D). For
this reason, we also assayed ANT1 or ANT2 protein
reduction by measuring the ability of ANT1 and
ANT2 siRNAs to inhibit translation of the respective
recombinant proteins. As shown in Fig. 1E, FLAG-
ANT1 and FLAG-ANT2 protein expression is almost
completely absent in ANT1 siRNA- and ANT2
siRNA-transfected cells, respectively.
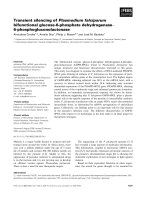
ANT1-silencing strongly reduces ADF and
U87-MG cell viability
We evaluated the effect of ANT specific isoform
down-regulation on ADF cell viability by crystal violet
assay. ANT2 down-regulation by ANT2 siRNA trans-
fection did not alter cell viability. By contrast, ANT1
depletion strongly affects cell viability 24, 48 and 72 h
after transfection (Fig. 2A). To exclude the possibility
that the effect of ANT1 on cell viability might be a
specific feature of ADF cells, we tested the effect of
ANT1 siRNA on the viability of an additional glio-
blastoma cell line, the U87-MG cells. U-87-MG
showed a higher number of ANT1 transcripts then
ADF cells ( 20 · 10
6
and 5 · 10
6
, respectively). At
24 and 48 h after transfection with ANT1-a and
ANT1-b siRNAs, ANT1 transcripts of U87-MG cells
were noticeably reduced with respect to Scramble-
transfected cells (Fig. 2B). As shown in Fig. 2C, ANT1
depletion significantly affects U87-MG cell viability 24,
48 and 72 h after transfection. The effect of ANT1
siRNA on ADF cell viability is not rescued after
strongly increasing the ANT2 expression level by
pcDNA-ANT2 transfection (Fig. 2D). We also com-
pared the effect of ANT1 and ANT2 isoform co-silenc-
ing with that of ANT1-silencing alone. We found that
ANT2-silencing did not significantly affect the effect of
ANT1-silencing on ADF cell viability (Fig. 2E).
De novo protein synthesis is required for
programmed cell death. Thus, to evaluate whether
ANT1-silencing induces glioblastoma cell death A. Lena et al.
2854 FEBS Journal 277 (2010) 2853–2867 ª 2010 The Authors Journal compilation ª 2010 FEBS
ANT1-silencing effect on cell viability might be a
result of the onset of a programmed cell death process,
we analyzed the effect of siRNA in the presence of the
protein synthesis inhibitor puromycin. As shown in
Fig. 2F, treatment with puromycin significantly
reduced the ANT1 siRNA-mediated effect on ADF
cell viability, indicating that the reduction in cell
viability induced by ANT1 siRNA requires protein
synthesis.
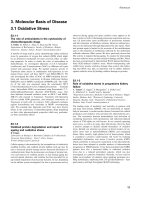
ANT1-silencing induces ADF cell apoptosis and a
non-apoptotic cell death modality similar to
paraptosis
To gain more insight regarding the observed reduction
in cell viability, we evaluated the mitotic and apoptotic
indexes in ANT1 siRNA- and Scramble-transfected
cells, as well as in nontransfected control cells. As
shown in Fig. 3, ANT1 siRNA-transfected cells show
a slightly reduced number of mitosis and a signifi-
cantly increased number of apoptotic figures with
respect to controls. This difference is detectable 24 h
after transfection (data not shown) and becomes even
more evident 48 h after transfection (Fig. 3B).
However, the percentage of cells with fragmented
nuclei is low ( 2% at 24 h and 20% at 48 h), sug-
gesting that other mechanisms of cell death are occur-
ring. With the aim of identifying these cell death
mechanisms, we analyzed ADF cell ultrastructure 24
and 48 h after transfection with ANT1 siRNA or
Scramble. Ultrastructural examination (Fig. 4A,G)
confirmed the presence of a few cells showing partially
condensed chromatin, as a morphological feature of
apoptosis, in siRNA-transfected samples (Fig. 4E). By
contrast, the majority of ANT1 siRNA-transfected
cells showed cytoplasmic vacuolation (Fig. 4C,D),
which was not observable in Scramble-transfected cells
(Fig. 4A,B). Vacuoles were derived predominantly
from the endoplasmic reticulum, although mitochon-
drial swelling was also observed in some of the
analyzed cells (Fig. 4D). ANT1 siRNA-treated cells
showed no ultrastructural evidence of membrane rup-
ture and were also negative to propidium iodide stain-
ing (data not shown), indicating that the plasma
membrane is maintained intact, allowing us to exclude
primary necrosis as the principal cell death modality.
Moreover, autophagic vacuoles were not observed,
thus allowing us to exclude a autophagic-like cell death
A
C
E
B
D
Fig. 1. Analysis of ANT1 and ANT2 expres-
sion in nontransfected ADF cells and in
ANT1- and ANT2-silenced ADF cells. (A)
Number of ANT1 and ANT2 transcripts in
nontransfected ADF cells. (B) Number of
ANT1 transcripts in nontransfected, Scram-
ble- and ANT1 and ANT2 siRNA-transfected
cells. (C) Number of ANT2 transcripts in
nontransfected, Scramble- and ANT1 and
ANT2 siRNA-transfected cells. (D) Western
blot analysis of ANT protein in Scramble-
and ANT1 and ANT2 siRNA-transfected
cells; the 33 kDa band corresponds to ANT
proteins, the 43 kDa band corresponds to
actin. (E) Western blot analysis of FLAG-
ANT1 and FLAG-ANT2 recombinant protein
expression revealed by anti-FLAG serum.
Anti-ERK1 ⁄ 2 antibody was used as loading
control. pcDNA-ANT1, pcDNA-ANT2 or
pcDNA were transfected 24 h after trans-
fection with ANT1 or ANT2 siRNA. Protein
expression analysis was performed 24 h
after the transfection with pcDNA-ANT1,
pcDNA-ANT2 or pcDNA; the 39 kDa band
corresponds to recombinant FLAG-ANT1 or
ANT2 protein, the 42 kDa band corresponds
to ERK2, the 44 kDa band, where it is visi-
ble, corresponds to ERK1.
A. Lena et al. ANT1-silencing induces glioblastoma cell death
FEBS Journal 277 (2010) 2853–2867 ª 2010 The Authors Journal compilation ª 2010 FEBS 2855
0
0.5
1
1.5
2
2.5
3
3.5
4
24 h 48 h 72 h
AB 540 nm
siRNA ANT1-b siRNA ANT1-a
Scramble Non-transfected cells
0
0.2
0.4
0.6
0.8
1
1.2
1.4
1.6
1.8
2
AB
CD
EF
24 h 48 h 72 h
AB 540 nm
siRNA ANT1-a siRNA ANT2-a
Scramble
Scramble 24 h
si ANT1-b 24 h
si ANT1-a 24 h
Scramble 48 h
si ANT1-b 48 h
si ANT1-a 48 h
Non transfected cells
siRNA ANT1-b siRNA ANT2-b
***
***
***
***
***
***
0
20
40
60
80
100
120
24 h 48 h 72 h
Percentage of live cells vs control
ANT1 siRNA ANT1 siRNA +
p
urom
y
cin
0
20
40
60
80
100
120
24 h 48 h 72 h
Percentage of live cells vs control
Scramble siRNA ANT1 siRNAANT1+ siRNA ANT2
0
20
40
60
80
100
120
24 h 48 h 72 h
Percentage of live cells vs control
PcDNA + scramble PcDNA + siRNA ANT1
PcDNA-ANT2 + scramble PcDNA-ANT2 + siRNA ANT1
*
*
***
**
*
***
0
5 000 000
10 000 000
15 000 000
20 000 000
25 000 000
30 000 000
ANT1 molecules/µg RNA
Fig. 2. Effect of ANT1 and ANT2-silencing on ADF cells. (A) Cell growth curves analyzed by crystal violet assay in nontransfected ADF cells,
and in Scramble- and ANT1 siRNA and ANT2 siRNA ADF-transfected cells. Each point represents the average of three experiments per-
formed in triplicate. The number of live cells counted in ANT1 siRNA-transfected cells was compared with that in Scramble-transfected cells
using an unpaired t-test. ***P < 0.001. (B) Number of ANT1 transcripts in Scramble- and ANT1 siRNA-transfected U-87-MG cells, 24 and
48 h after transfection. (C) Cell growth curves analyzed by crystal violet assay in nontransfected U87-MG cells, and in Scramble- and ANT1
siRNA U87-MG-transfected cells. Each point represents the average of two experiments performed in triplicate. The number of live cells
counted in ANT1 siRNA-transfected cells was compared with that of Scramble-transfected cells using an unpaired t-test. ***P < 0.001;
**P < 0.01; *P < 0.1. (D) Crystal violet assay of PcDNA + ANT1 siRNA-, PcDNA-ANT2 + ANT1 siRNA-, PcDNA + Scramble- and PcDNA-
ANT2 + Scramble-transfected cells. Each bar indicates the percentage of live cells versus the corresponding control (PcDNA + ANT1 siRNA
versus PcDNA+Scramble and PcDNA-ANT2 + ANT1 siRNA versus PcDNA-ANT2 + Scramble) and is the mean of two independent experi-
ments performed in triplicate. (E) Crystal violet assay of ANT1 siRNA- and ANT1 + ANT2 siRNA-transfected cells. Each bar indicates the
percentage of live cells versus the corresponding control (ANT1 siRNA versus 50 n
M Scramble and ANT1 siRNA + ANT2 siRNA versus
100 n
M Scramble) and is the mean of two independent experiments performed in triplicate. (F) Crystal violet assay of ANT1 siRNA-transfect-
ed cells and ANT1 siRNA-transfected cells treated with 10 l
M puromycin. Each bar indicates the percentage of live cells versus the
corresponding control (ANT1 siRNA versus Scramble and ANT1 siRNA+puromycin versus Scramble + puromycin) and is the mean of two
independent experiments performed in triplicate.
ANT1-silencing induces glioblastoma cell death A. Lena et al.
2856 FEBS Journal 277 (2010) 2853–2867 ª 2010 The Authors Journal compilation ª 2010 FEBS
process. To obtain a positive control for autophagy,
we analyzed the ultrastructure of ADF cells treated
with betulinic acid (Fig. 4F,G), which is known to
induce autophagy in this cell line [25]. In this case,
cells contain giant autophagosomes (a feature of auto-
phagy) distributed throughout the cytoplasm. Engulfed
organelles in the autophagosome display degenerative
alterations. To further exclude an autophagic-like cell
death process, we also analyzed the development of
acidic vesicular organelles (AVO), by vital staining
using acridine orange. AVO positive cells were not
detectable 24 and 48 h after ANT1 siRNA transfec-
tion (Fig. 4H,I). By contrast, several AVO-positive
cells were detectable 24 h after treatment with bon-
gkrekic acid (BA) (Fig. 4J). All these morphological
features resemble those described for paraptosis [26].
ANT1-silencing produces mitochondrial
transmembrane potential (DW ) dissipation in a
small percentage of ADF cells
The fact that some cells show mitochondrial swelling
suggests an effect of ANT1 siRNA on the mitochon-
drial transmembrane potential. Thus, we performed
cytoflurimetric evaluation of DW dissipation by using
the JC1 dye. Quadrants in the cytometry plot were
established by comparing the distribution of the events
in nontransfected cells (Fig. 5A) and nontransfected
cells treated with the uncoupler carbonyl cyanide
m-chlorophenylhydrazone (CCCP) used as a control
for complete DW dissipation (Fig. 5B). Twenty-four
hours after ANT1 siRNA treatment, the majority of
the transfected cells exibit well polarized mitochondria
(Fig. 5D) comparable to those of nontransfected cells
(Fig. 5A) or Scramble-treated cells (Fig. 5C). Only a
small percentage (11 ± 2%) of the analyzed events
show DW dissipation (Fig. 5D). The amount of depo-
larized cells slightly increases in ANT1 siRNA samples
(18 ± 2%), 48 h after transfection. Fluorescence
microscopy analysis of JC1-stained cells confirmed that
ANT1 siRNA treatment does not induce essential
modification of mitochondrial polarization (Fig. 5E,F).
ANT1-silencing produces cell viability reduction
independent of its ATP/ADP exchange function
The reduction in cell survival observed in ANT1
siRNA treated cells could be the result of a reduction
in the cytoplasmic ATP pool, determined by the loss
of the ATP ⁄ ADP exchange function of ANT1. To
test this hypothesis, we blocked this function in non-
transfected cells by exposing them to BA or ATR,
two natural inhibitors of ANT-mediated ATP ⁄ ADP
exchange function [3]. Surprisingly, as shown in
Fig. 6A,B, treatment with both inhibitors, at concen-
trations currently used in a variety of cell types, did
not produce a reduction in cell viability with respect
to vehicle-treated control cells. In response to
ATP ⁄ ADP co-transport blockade, ADF cells might
0
5
10
15
20
25
30
0 5 10 15 20 25
Number of apoptosis/1000 cells
Number of mitosis/1000 cells
A
B
siRNA ANT1
Scramble
Non-transfected cells
Fig. 3. Analysis of apoptotic and mitotic index in ANT1 siRNA-trans-
fected ADF cells by Hoechst 33342 staining. (A) Representative
image of a fragmented nucleus (white arrowhead) stained with
Hoechst 33342. (B) Number of mitosis and apoptotic figures
counted in a representative experiment 48 h after transfection in
nontransfected, Scramble- and ANT1 siRNA-transfected cells. Each
point is the average of three counts of the same sample.
A. Lena et al. ANT1-silencing induces glioblastoma cell death
FEBS Journal 277 (2010) 2853–2867 ª 2010 The Authors Journal compilation ª 2010 FEBS 2857
compensate for the reduction in cytoplasmic ATP by
increasing glycolysis. However, the analysis of glucose
consumption after BA or ATR treatment did not
reveal any increase in glucose utilization (Fig. 6C,D).
By contrast, the amount of glucose consumption is
significantly higher in ANT1 siRNA-transfected cells
A
B
C
D
E
F
G
HI J
*
Fig. 4. Analysis of cell death modality in ANT1 siRNA-transfected ADF cells by transmission electron microscopy and acridine orange stain-
ing. (A) Representative electron micrograph of a Scramble-treated ADF cell. (B) Magnification of the box depicted in (A) showing electron-
dense mitochondria (black arrowheads) and normal endoplasmic reticulum (white arrows). (C) Representative electron micrograph of a ANT1
siRNA-treated ADF cell observed 48 h after treatment. (D) Magnification of the box depicted in (C) showing swallen mitochondria (black
arrowheads) and heavily enlarged endoplasmic reticulum (white arrows). (E) Electron micrograph of an apoptotic cell showing partial chroma-
tin condensation in ANT1 siRNA-treated ADF cells observed 48 h after treatment. (F) Representative electron micrograph of an ADF cell,
24 h after treatment with betulinic acid. (G) Magnification of the box depicted in (F) showing normal electron-dense mitochondria (arrow-
head) and a giant autophagosome engulfed with organelles that display degenerative alterations (asterisk). (H) Acridine orange-stained ADF
cells visualized 24 h after ANT1 siRNA transfection. (I) Acridine orange-stained ADF cells visualized 48 h after ANT1 siRNA transfection. (J)
Acridine orange-stained ADF cells visualized 24 h after betulinic acid treatment.
ANT1-silencing induces glioblastoma cell death A. Lena et al.
2858 FEBS Journal 277 (2010) 2853–2867 ª 2010 The Authors Journal compilation ª 2010 FEBS
than in ANT2 siRNA- and Scramble-transfected cells,
72 h after transfection (Fig. 6E).
ANT1-silencing induces oxidative damage
We evaluated the ability of ANT1 siRNA to sensitize
ADF cells to the treatment with pro-oxidants. Accord-
ingly, we measured ADF cell viability 24 h after treat-
ment with H
2
O
2
(10, 25, 50, 75, 100, 125, 150, 175 and
200 lm). ANT1-silencing results in a sustained sensiti-
zation to H
2
O
2
treatment (IC
50
= 56 ± 12) with
respect to nontransfected (IC
50
= 115 ± 10) and
Scramble-transfected (IC
50
= 88 ± 11) cells (Fig. 7A).
Increased susceptibility to pro-oxidant treatment sug-
gests that ADF cells show oxidative damage as a
consequence of ANT1-silencing. According to this
hypothesis, we found that ANT1 siRNA-treated cells
show higher lysosomal membrane instability, a possi-
ble sign of phospholipid peroxidation damage, with
respect to control cells. Lysosomal membrane instabil-
ity was monitored by neutral red retention assay. Neu-
tral red accumulates in lysosomes from which it is
gradually released. The rate of this release directly
depends upon the lysosomal membrane status. Lyso-
somes with peroxidized phospholipids will release the
dye more rapidly than healthy lysosomes. As shown in
Fig. 7B,C, neutral red release is higher in ANT1-
silenced cells than in control cells, either at 24 or 48 h
after treatment.
To confirm that ANT1 depletion-mediated reduction
in cell survival is the result of a worsening in the
oxidative status of ADF cells, we also evaluated the
ability of the anti-oxidant compound N-acetyl-l-cyste-
ine (NAC) to rescue ADF cells from ANT1 siRNA
UQ: 97.5%
UQ: 3%
LQ: 2.5%
LQ: 97%
UQ: 97%
UQ: 86%
LQ: 14%LQ: 3%
10
0
10
1
10
2
10
3
FL1-H
FL2-H
10
4
10
0
10
1
10
2
10
3
10
4
10
0
10
1
10
2
10
3
FL1-H
FL2-H
10
4
10
0
10
1
10
2
10
3
10
4
10
0
10
1
10
2
10
3
FL1-H
FL2-H
10
4
10
0
10
1
10
2
10
3
10
4
10
0
10
1
10
2
10
3
FL1-H
FL2-H
10
4
10
0
10
1
10
2
10
3
10
4
AB
C
D
E
F
Fig. 5. Analysis of ANT1-silencing on DW
dissipation and the effect of the mitochon-
drial ATP ⁄ ADP transport inhibitors on ADF
cell viability. (A–D) The ability of ANT1-
silencing to dissipate the DW was evaluated
by JC1 staining and cytofluorimetry. Repre-
sentative cytometry plots obtained 24 h
after transfection for nontransfected cells
(A), CCCP-treated cells (B), Scramble-trans-
fected cells (C) and ANT1 siRNA-transfected
cells (D) are shown. Percentage of events in
each quadrant (lower quadrant, LQ, depolar-
ized cells; upper quadrant, UQ, polarized
cells) are indicated; FL2-H, red fluorescence,
FL1-H, green fluorescence. (E,F) fluores-
cence microscope images of JC1-stained
ADF cells 24 h after transfection. (E)
Scramble-transfected cells. (F) ANT1
siRNAa-transfected cells.
A. Lena et al. ANT1-silencing induces glioblastoma cell death
FEBS Journal 277 (2010) 2853–2867 ª 2010 The Authors Journal compilation ª 2010 FEBS 2859
treatment. Although elevated concentrations of ROS
are toxic to the cells, their role as second messengers
in intracellular signal transduction is important for
cancer cell growth and survival [27]. We therefore
assayed different dose ⁄ time conditions for NAC treat-
ment on nontransfected ADF cells: pre-treatment with
20 lm NAC for 30 min was the most severe condition
that did not affect cell proliferation in the subsequent
48 h. As shown in Fig. 7D, treating ADF cells with
20 lm NAC for 30 min prior to transfection signifi-
cantly protects them from the effect of ANT1-silenc-
ing. Indeed, 48 h after transfection, ANT1-depleted
cells are reduced by 45% and 19%, with respect to
Scramble-transfected cells in untreated and NAC-trea-
ted samples respectively.
Discussion
At present, few data are available on the expression of
ANT isoforms in astrocytes and astrocytic tumors. It
has been reported that ANT1 levels are increased in
reactive astrocytes [28] and that ANT2 levels are
increased in glial cells and neurons during hypertonic-
ity in the brain [29]. In the present study, we demon-
strate that human ADF glioblastoma cells express
ANT1 and ANT2 isoforms, and that ANT2 transcripts
are more abundant than those coding for ANT1
protein.
The ANT2 isoform is known to be up-regulated in
tumor cells, especially in neoplastic cells with high gly-
colytic rates [10,12,13] and, in this context, it has been
0
0.5
1
1.5
2
2.5
3
24 h 48 h 72 h
Folds of glucose consumption
Scramble siRNA ANT1 siRNA ANT2
0
0.5
1
1.5
2
2.5
3
24 h 48 h 72 h
Folds of glucose consumption
Vehicle Bong. Ac. 1 µM Bong. Ac. 2 µM
0
1
2
3
4
5
24 h 48 h 72 h
AB 540 nm
Vehicle Bong. Ac. 1 µM Bong. Ac. 2 µM
0
0.5
1
1.5
2
2.5
3
24 h 48 h 72 h
Folds of glucose consumption
Vehicle
ATR 20 µ
M
0
0.5
1
1.5
2
2.5
3
3.5
4
24 h 48 h 72 h
AB 540 nm
Vehicle ATR 20 µM
AB
C
D
***
E
Fig. 6. Analysis of the effects of BA, ATR and ANT1 siRNA on cell viability and glucose consumption. (A,B) Cell growth curves analyzed by
crystal violet assay in BA and vehicle-treated (A) and in ATR and vehicle-treated (B) cells. Each point is the average of three experiments per-
formed in triplicate. (C,D) Glucose consumption in BA and vehicle-treated (C) and ATR and vehicle-treated (D) cells. Values are normalized
versus the glucose consumption of vehicle-treated cells to which an arbitrary value of 1 was attributed. Each bar is the mean of two inde-
pendent experiments performed in quadruplicate. (E) Glucose consumption of Scramble-, ANT1 siRNA- and ANT2 siRNA-transfected cells.
Each bar is the mean value of two experiments performed in quadruplicate. Values are normalized versus the glucose consumption of
Scramble-transfected cells to which an arbitrary value of 1 was attributed. The glucose consumption quantified in ANT1 siRNA-transfected
cells was compared with that quantified for Scramble-transfected cells using an unpaired t-test. ***P < 0.001.
ANT1-silencing induces glioblastoma cell death A. Lena et al.
2860 FEBS Journal 277 (2010) 2853–2867 ª 2010 The Authors Journal compilation ª 2010 FEBS
hypothesized that ANT2 transports nucleotides in the
opposite direction (i.e. by importing the glycolysis-
derived ATP into mitochondria); this is necessary for
providing energy for intramitochondrial functions and
contributes to the maintenance of DW, an essential
condition for cell survival [11,30]. This proposed role
for ANT2 in cell proliferation, and its very low expres-
sion in differentiated tissues, make ANT2 protein or
transcript an ideal target for anticancer strategy. In
accordance with this hypothesis, a recent study showed
that breast tumor cell growth can be reduced by
depleting ANT2 expression [21]. Surprisingly, ANT2
down-regulation in ADF cells did not reduce cell
growth and did not dissipate DW. These results are
also in accordance with a study performed by Le Bras
et al. [20], who demonstrated that ANT2 depletion
induced no major changes in cell cycle and in mito-
chondria aspect and network, and suggest that ADF
cells possess alternative mechanisms for providing
mitochondria with ATP and maintaining DW, which
can compensate for ANT2 loss of function. Another
possibility is that a more prolonged treatment is
required to observe the effect of ANT2 depletion on
ADF cell proliferation and ⁄ or that ANT2 molecules
escaping the silencing ( 2 · 10
6
transcripts), under
our experimental conditions, are sufficient to guarantee
the function of ANT2. By contrast, we observed a con-
sistent reduction in cell viability in ANT1-depleted
cells. The effect on cell viability produced by ANT1-
silencing is strongly reduced in the presence of puro-
mycin, a natural inhibitor of protein synthesis, suggest-
ing that ANT1-depleted cells undergo a programmed
cell death process that requires de novo protein synthe-
sis. Indeed, ultrastructural analysis allowed us to iden-
tify morphological signs of two different kinds of
programmed cell death processes. First, we observed a
few apoptotic cells that correlate well with the increase
in apoptosis demonstrated by the analysis of the apop-
totic index 24 and 48 h after ANT1 siRNA transfec-
tion. Second, transmission electron microscopy also
revealed that, after ANT1 depletion, the majority of
cells showed several cytoplasmic ultrastructural modifi-
cations consisting in vacuolation primarily ascribable
to rough endoplasmic reticulum physical enlargement.
Mitochondria swelling was also observed in some cells.
No ruptures in plasma membrane were detected by
0
0.1
0.2
0.3
0.4
0.5
0.6
0.7
Red area/cell area
siRNA ANT1
Scramble
AB
0
0.05
0.1
0.15
0.2
0.25
0.3
0.35
0.4
Red area/cell area
siRNA ANT1
Scramble
**
***
***
***
**
**
CD
0123
0
25
50
75
100
125
456
Percentage of live cells
Non-transfected cells Scramble
siRNA ANT1
T1 T2 T3 T4 T5
T1 T2 T3 T4 T5
0
0.2
0.4
0.6
0.8
1
1.2
Without NAC NAC 20 µ
M
AB 540
Non-transfected Scramble siRNA ANT1
**
NS
Dose of H
2
O
2
(Log)
Fig. 7. Analysis of oxidative stress status of ANT1-silenced ADF cells. (A) Sigmoidal dose–response curves of the effect on cell viability mea-
sured 24 h after H
2
O
2
treatment (10–200 lM) in nontransfected, Scramble- and ANT1 siRNA-transfected cells. (B,C) Representative experi-
ments of neutral red retention assay performed 24 h (C) or 48 h (D) after transfection with ANT1 siRNA or Scramble. Images were taken
every 10 min; the time of analysis (T10, 10 min, T2, 20 min, etc.) is indicated on the x-axis. Each point is the mean red area ⁄ cell area value
obtained by analyzing six to eight images taken in different microscope fields. The red area ⁄ cell area value quantified in ANT1 siRNA-trans-
fected cells was compared with that quantified for Scramble-transfected cells using an unpaired t-test. ***P < 0.001; **P < 0.01. (D)
Absorbance values obtained by the crystal violet assay in NAC-treated or untreated nontransfected cells, and Scramble- and ANT1 siRNA-
transfected cells, 48 h after transfection. The absorbance values recorded in ANT1 siRNA-transfected cells were compared with that of the
Scramble-transfected cells using an unpaired t-test. **P < 0.01; NS, not significant.
A. Lena et al. ANT1-silencing induces glioblastoma cell death
FEBS Journal 277 (2010) 2853–2867 ª 2010 The Authors Journal compilation ª 2010 FEBS 2861
both morphological examination and propidium iodide
staining, thus allowing us to exclude primary necrosis
as a principal death modality. These features resemble
those described for paraptosis, a caspase-independent
programmed cell death modality. Paraptotic cell death
was described during development in some cases of
neurodegeneration and in macrophage-mediated cyto-
toxicity upon glioma cells [30,31]. In the latter case,
paraptotic cell death is induced by the ROS produced
by macrophage activation and can be mimicked, in vi-
tro, in cytotoxicity studies performed using H
2
O
2
[31].
This last finding, as well as the observed resistance
of ADF cells to treatment with ATP ⁄ ADP transport
blockers, indicating that cell death produced by
ANT1-silencing in this cell line could not be ascribed
to the impairment of ATP ⁄ ADP exchange function
performed by this protein, led us to analyze oxidative
stress in ANT1-depleted ADF cells. A number of
observations demonstrate that ANT1 siRNA-transfect-
ed ADF cells experience oxidative stress. First, the
observation that ANT1 siRNA strongly sensitizes
ADF cells to H
2
O
2
treatment suggests that, in ANT1
depleted cells, the detoxifying system for H
2
O
2
is
already saturated by endogenous production. Second,
the neutral red retention assay demonstrates that
ANT1-silenced cells show lysosome membrane instabil-
ity, an indirect sign of possible phospholipid peroxida-
tion. Third, ANT1-silenced cells increase glucose
consumption, which might be interpreted as an
attempt by the cell to potentiate its detoxifying system.
Indeed, in addition to its role in energy production,
glucose metabolism also leads to the formation of
pyruvate and NADPH, both of which are considered
to function in the cellular detoxification of hydroper-
oxides [32,33]. Finally, we provide direct evidence that
the anti-oxidant NAC rescues the ANT1-silencing
effect on ADF cell survival, thus indicating that ANT1
effect is mediated by oxidative stress.
A possible explanation for the ANT1-silencing effect
on oxidative stress and cell survival could reside in the
loss of the basal proton conductance function
described for ANT1. The amount of ANT protein
present in the mitochondrial inner membrane has been
shown to strongly affect the basal proton conductance,
independent of the ATP ⁄ ADP exchange function, sug-
gesting that ANT is a major catalyst of the basal fatty-
acid-independent proton leak in mitochondria [34].
More recent data indicate that ANT1 and ANT2 may
be responsible for basal and fatty acid-induced uncou-
pling, respectively [22]. Basal proton conductance may
play a fundamental role in the regulation of DW in gly-
colitic tumor cells that possess an incomplete electron
transport chain and do not utilize F0F1-ATP synthase
for cytoplasmic ATP production. In this context, it
might be hypothesized that protons, accumulated by
the electron transport chain in the intermembrane
space, principally flow back into the matrix using the
basal conductance function of ANT1. Lowering the
ANT1 density at the mitochondrial inner membrane
level might impair the balance between proton efflux ⁄
influx into the matrix, thus determining mitochondria
hyperpolarization.
A strong positive correlation between mitochondrial
membrane potential and ROS production has been
clearly demonstrated [35]. With our JC1 analysis, we
were unable to detect a significant increase in the mito-
chondria membrane potential of ADF cells. However,
this cannot exclude small intermittent increases in DW
that are sufficient to induce ROS production. Indeed,
it has been reported that even a small increase in mem-
brane potential gives rise to a large stimulation of
H
2
O
2
production [36]. Similarly, only a small decrease
in membrane potential (10 mV) is able to inhibit H
2
O
2
production by 70% [37]. A possible explaination is
that, when DW is sufficiently high, the half-life of
CoQH
·
and some other electron transport intermedi-
ates, increases [36]. Moreover, when electron transfer
is hindered by a high membrane potential, Complex
III may leak electrons to oxygen, resulting in the for-
mation of superoxide. Therefore a ‘mild uncoupling’
(i.e. a small decrease in membrane potential) has been
suggested to exert a natural antioxidant effect [38].
Accordingly, we demonstrate that ANT1 depletion did
not produce DW dissipation in the majority of ADF
transfected cells. The limited amount of depolarized
cells detected at both 24 and 48 h after transfection
with ANT1 siRNA might reflect those cells that are in
an advanced status of cell death. The extension of the
present study to other lines of astrocytic tumors, as
well as normal astrocytes, will be necessary to confirm
the fundamental role of ANT1 in sustaining basal pro-
ton conductance and thus in the reduction of ROS
production and oxidative stress.
Three previous studies [19,39,40] report that ANT1
overexpression induces apoptosis in a variety of
immortalized fibroblasts and tumor cell lines, not
including glioma cells. Two of these studies attribute
the pro-apoptotic effect of ANT1 overexpression to its
function in modulating mitochondrial permeability
transition pore opening. Zamora et al. [40] show that
ANT1 overexpression results in the recruitment of the
IjBa-NF-jB complex into mitochondria, with a corre-
sponding decrease in nuclear NF-jB DNA binding
activity. In this situation, NF-jB transcriptionally reg-
ulated genes with anti-apoptotic activity, such as Bcl-
XL, MnSOD-2 and c-IAP2, are down-regulated and,
ANT1-silencing induces glioblastoma cell death A. Lena et al.
2862 FEBS Journal 277 (2010) 2853–2867 ª 2010 The Authors Journal compilation ª 2010 FEBS
consequently, cells are sensitized to apoptosis. Accord-
ing to these interpretations, we should have found a
decrease in apoptotic cell death and an increased pro-
liferation rate in our ANT1-silenced cells. By contrast,
under our experimental conditions, we find an increase
in the number of dead cells. However, the results
obtained in the present study are consistent with the
finding that an increase in ANT1 expression levels in
activated astrocytes is not associated with an increase
in cell death but rather an augmented energy mobiliza-
tion capacity that contributes to neuroprotective,
energy-dependent glutamate uptake [28]. This suggests
that, in astrocytes, and possibly in astrocytic tumors, a
high expression level of ANT1 does not play a pro-
apoptotic role. Another possibility is that, although
apparently contrasting, these findings could be
explained by the idea that, when the quantity of
ANT1 exceeds a physiological concentration, ANT1
sensitizes cells to mitochondrial depolarization or to
apoptotic stimuli by both modulating the mitochon-
drial permeability transition and recruiting IjBa-NF-
jB complex into mitochondria. However, this does not
exclude the possibility that the reduction of ANT1
level below the physiological baseline impairs, in ADF
tumor cells, the fundamental functions of this protein,
such as basal proton conductance, which produces a
severe effect on cell viability.
Experimental procedures
Cell cultures
Human ADF glioblastoma cell line, obtained from a WHO
grade IV human glioblastoma [41], and human U87-MG
cell line, a kind gift of Professor C. Martini (Department of
Psychiatry, Neurobiology, Pharmacology and Biotechnol-
ogy, University of Pisa, Italy), were maintained under stan-
dard culture conditions (37 °C, 95% humidity, 5% CO
2
)in
RPMI 1640 medium supplemented with 10% fetal bovine
serum, 2 mL of glutamine, 100 UÆmL
)1
penicillin,
100 mgÆmL
)1
streptomycin and 1% non-essential amino
acids (complete medium).
Drugs
The drugs employed included atractyloside potassium salt
(ATR A6882; Sigma-Aldrich, St Louis, MO, USA), CCCP
(C2759; Sigma-Aldrich), BA (Biomol International,
Plymouth Meeting, PA, USA) and puromycin (Invitrogen,
Paisley, UK). Stock solutions of 10 and 1 mgÆmL
)1
were
prepared in distilled water for atractyloside and BA, respec-
tively. A 200 mm stock solution was prepared in dimethyl-
sulfoxide for betulinic acid; a 5 mm stock solution was
prepared in absolute ethanol for CCCP; and a
100 mgÆmL
)1
stock solution was prepared in distilled water
for puromycin.
RNA isolation, reverse transcription-PCR and
cloning of human ANT1 and ANT2
RNA was extracted from 5 · 10
6
cells using the Nucleospin
RNA II kit (Macherey-Nagel, Duren, Germany) in accor-
dance with the manufacturer’s instructions. For RT-PCR,
1 lg of total RNA was reverse transcribed using the
Superscript II reverse transcriptase (Invitrogen). Full-length
cDNAs of ANT1 and ANT2 were amplified using the spe-
cific primers: ANT1 forward: 5¢-TCGCGGATCCATGGG
TGATCACGCTTGG-3¢ (containing a BamHI restriction
site at the 5¢ end); ANT1 reverse: 5¢-ACGCGTCGACGA
CATATTTTTTGATCTCATCAT-3¢ (containing a SalI
restriction site at the 5¢ end); ANT2 forward: 5¢-TCGCT
GATCAATGACAGATGCCGCTGTGTCC-3¢ (containing
a BclI restriction site at the 5¢ end); and ANT2 reverse: 5¢-
ACGCGTCGACTGTGTACTTCTTGATTTCATCATAC
AAGACAAG-3¢ (containing a SalI restriction site at the 5¢
end). PCR cycling conditions for ANT1 were 2 min at
94 °C, 30 cycles of 30 s at 94 °C, 45 s at 50 °C and 90 s at
68 °C; for ANT2, they were 2 min at 94 ° C, 35 cycles of
30 s at 94 °C, 45 s at 49 °C and 90 s at 72 °C. In both
PCRs, a final extension was carried on at 72 °C for 7 min.
The amplified fragments were BamHI-SalI digested and
cloned in the pcDNA3 vector (Invitrogen), modified to
achieve a short FLAG epitope. The resulting expression
vectors were composed of the ORF encoding human ANT1
or ANT2 fused with the FLAG epitope at their COOH ter-
minal position. After transformation in competent Escheri-
chia coli cells, some clones were isolated and plasmid DNA
was sequenced by automated fluorescent cycle sequencing
(Applied Biosystems, Foster City, CA, USA). Selected
clones (PcDNA-ANT1 and PcDNA-ANT2) were used in
the applications described below.
RNA interference
Among a series of siRNAs, designed according to the
guidelines of Elbashir et al. [42], the two most effective
against human ANT1 isoform (accession number
NM_001151) and human ANT2 isoform (accession number
NM_001152) were identified using energy profiling guide-
lines [43]. SiRNAs were synthesized using the Ampli-Scribe
T7 high yield transcription kit (Epicenter Biotechnologies,
Madison, WI, USA) in accordance with manufacturer’s
instructions. The sequences used as templates were: ANT1
siRNA-a: 5¢-AAGCATGCCAGCAAACAGATCTCTCTT
GAAGATCTGTTTGCTGGCATGCTATAGTGAGTCGT
ATTACC-3¢; ANT1 siRNA-b: 5¢-AAGCTGGAGGAAG
ATTGCAAATCTCTTGAATTTGCAATCTTCCTCCAG
A. Lena et al. ANT1-silencing induces glioblastoma cell death
FEBS Journal 277 (2010) 2853–2867 ª 2010 The Authors Journal compilation ª 2010 FEBS 2863
CTATAGTGAGTCGTATTACC-3¢; ANT2 siRNA-a: 5¢-
AAGCTGGAGCTGAAAGGGAATTCTCTTGAAATTC
CCTTTCAGCTCCAGCTATAGTGAGTCGTATTACC-3¢;
and ANT2 siRNA-b: 5¢-AAGGATCCCAAGAACACTCA
CTCTCTTGAAGTGAGTGTTCTTGG GATCCTATAG T
GAGTCGTATTACC-3¢.
ANT1 siRNA-a, ANT1 siRNA-b, ANT2 siRNA-a and
ANT2 siRNA-b were used in the analysis of the cell growth
curves. In all the other experiments, ANT1 siRNA and
ANT2 siRNA refer to ANT1 siRNA-a and ANT2 siRNA-a,
respectively.
Transfection
ADF cells were transfected using Lipofectamine 2000
reagent (Invitrogen) in accordance with the manufacturer’s
instructions. Five hours after transfection, medium was
replaced with complete medium and the cells were used for
the experiments.
In the overexpression experiments, 90% confluent ADF
cells were transfected with 1.6 lgÆmL
)1
of pcDNA-ANT1,
pcDNA-ANT2 or pcDNA (control). In RNA interference
experiments, 30% confluent ADF cells were transfected
with siRNA-ANT1-a, siRNA-ANT1-b, siRNA-ANT2-a,
siRNA-ANT2-b, siRNA-ANT1-a+siRNA-ANT2-a or
Scramble (Scrambled Negative Control Stealth transfected
cells; Ambion, Applied Biosystems Carlsbad, CA, USA) at
a final concentration of 50 nm. Transfection efficiency was
routinely measured in a separate well using the BLOCK-IT
fluorescent oligo (Invitrogen) and transfection experiments
were used for the subsequent analysis only if transfection
efficiency, as evaluated 24 h after transfection, was higher
than 80% .
Immunoblotting
ADF transfected cells and ADF control cells were lysed by
adding 80 lL of lysis buffer [1% Triton X-100, 10% glyc-
erol, 20 mm Tris-HCl (pH 7.5), 150 mm NaCl, 10 mm
EDTA, 1 mm phenylmethylsulphonyl fluoride, 0.5 lm apro-
tinin, 0.5 lm leupeptin] and used for western blot analysis
with rabbit anti-FLAG serum (dilution 1 : 1000; Sigma-
Aldrich) or with goat anti-ANT serum (dilution 1 : 200;
Santa Cruz, Santa Cruz, CA, USA). After incubation with
a 1 : 100 000 dilution of peroxidase-conjugated anti-rabbit
or anti-(goat IgG) sera (Bio-Rad, Hercules, CA, USA),
cross-reactive bands were detected using the Supersignal
West Dura substrate (Pierce, Rockford, IL, USA). To
check that equal amounts of total proteins were loaded in
each line, after anti-FLAG detection, filters were stripped
and reprobed with mouse anti-ERK1 ⁄ 2 antibody (dilution
1 : 1000; Santa Cruz) and revealed as described above.
After anti-ANT detection, filters were stripped and
reprobed with rabbit anti-Actin antibody (dilution 1 : 150;
Santa Cruz) and revealed as described above.
Absolute real-time PCR
Real-time RT-PCR was performed using SYBR Green
technology and Brilliant II SYBRGreeen QPCR master
mix (Stratagene, Agilent, Santa Clara, CA, USA) to
amplify 20 ng of retrotranscribed total RNA. Conditions
for the amplification were: 40 cycles of 30 s at 94 °C, 60 s
at 60 °C and 60 s at 72 °C. The primers used in the amplifi-
cation reaction were: ANT1 forward: 5¢-GGGTGTGGA
TCGGGATAAG-3¢; ANT1 reverse: 5¢-CATGGAACTCA
CGCTGGG-3¢; ANT2 forward: 5¢-ACGTGTCTGTGCAG
GGTATT-3¢; ANT2 reverse: 5¢-GTGTCAAATGGATAGG
AAG-3¢; ANT3 forward: 5¢-AACCAAGAGAACCACG
TAGAA-3¢; and ANT3 reverse: 5¢-CTTAGAACACGACT
TGGCTC-3¢.
For calibration curves, ANT1, ANT2 and ANT3 amplifi-
cation products were purified and quantified by measuring
A
260
. Serial dilutions of the amplified fragments containing
100 000 000, 1000 000 and 10 000 cDNA copies were used
in the amplification experiments. These curves were used to
extrapolate the number of ANT1, ANT2 and ANT3 tran-
scripts from their Ct values.
Crystal violet assay
After transfection and ⁄ or treatment, cells were processed as
previously described [25]. Briefly, cells were washed in Phos-
phate buffered saline (PBS; 137 mm NaCl, 2.7 mm KCl,
10 mm Na
2
PO
4
,2mm KH
2
PO
4
, pH 7) fixed in paraformal-
dehyde (4%) and stained with a crystal violet solution. After
removal of crystal violet, plates were washed by immersion in
a beaker filled with tap water and air-dried. Crystal violet
destaining solution (0.6 mL) was then added to each well and
A
540
was measured. Three wells for each type of sample were
measured; values were blank-subtracted using the optical
density of wells containing growth medium only as blank. In
some experiments, the IC
50
was calculated by a sigmoidal
dose–response curve, using the graphpad prism 4 software
(GraphPad Software Inc., San Diego, CA, USA).
Mitotic and apoptotic index
Sixty thousand ADF cells were plated in 24-well plates.
The next day, cells were transfected with siRNA-ANT1-a
or Scramble. After 24 or 48 h, cells were detached, collected
by centrifugation and resuspended in 40 lL of a glycerol,
acetic acid, PBS (1 : 1 : 13) solution containing 5 lgÆmL
)1
of Hoechst 33342 (H21492; Invitrogen). Cells were treated
with 0.05 lg Æ mL
)1
colchicine for 3 h before collection. Two
5 lL aliquots of cell suspension for each sample were spot-
ted onto a glass slide and allowed to dry. Mitotic and
apoptotic figures were counted under the fluorescence
microscope. Two 10 lL aliquots for each sample were used
to count the number of total cells with a hemocytometer.
For each treatment, the mitotic and apoptotic index (i.e.
ANT1-silencing induces glioblastoma cell death A. Lena et al.
2864 FEBS Journal 277 (2010) 2853–2867 ª 2010 The Authors Journal compilation ª 2010 FEBS
mitotic figures or apoptotic figures ⁄ total cells) were calcu-
lated in three replicate wells. At least 80 000 cells were
scanned for each type of sample.
Detection of AVOs
As a marker of autophagy, the appearance and volume
AVOs was visualized by acridine orange staining as
described previously [25] in siRNA-ANT1-a and Scramble-
transfected ADF cells. The cytoplasm and nucleus of the
stained cells fluoresced bright green, whereas the acidic
autophagic vacuoles fluoresced bright orange. To carry out
a control of specificity, the cells were treated with 200 nm
bafilomycin A1 for 30 min before the addition of acridine
orange to inhibit the acidification of autophagic vacuoles.
As a positive control for autophagy induction, ADF cells
were treated for 24 h with 15 lm betulinic acid [25].
Glucose consumption assay
At 24, 48 and 72 h after transfection, 150 lL of medium
from each sample were transferred to 1.5 mL tubes and cen-
trifuged for 5 min at 300 g. Seventy-five microliters of the
resulting supernatants were collected and diluted with 75 lL
of distilled water and 450 lL of o-Toluidine Reagent
(T1199; Sigma-Aldrich). After heating at 100 °C for 8 min,
A
630
was measured. A calibration curve with serial dilutions
of d-glucose (400, 600, 800, 1200 and 1400 mgÆL
)1
) was pro-
cessed contemporarily to the samples in each experiment.
Neutral red release assay
After transfection with siRNA-ANT1-a and Scramble, cells
were stained for 10 min at 15 °C in serum-free medium con-
taining neutral red dye (3-amino-7-dimethylamino-2-methyl-
phenazine hydrochloride) at the final concentration of
20 lgÆmL
)1
. After removal of neutral red dye, new complete
medium was added to the cells. Images were then taken
every 10 min, under an Axiovert microscope (Carl Zeiss,
Oberkochen, Germany). Images were then converted to
grayscale mode using Adobe Photoshop cs (Adobe Systems,
Inc., San Jose, CA, USA), and the red area, as well as total
cell area, were measured using imagej software [44].
Evaluation of mitochondrial potential by the JC1
staining assay
Changes in mitochondrial membrane potential were ana-
lyzed using the specific lipophilic fluorescent cation
5,5¢,6,6¢-tetrachloro-1,1¢,3,3¢-tetraethylbenzimidazol-carbocyanine
iodide (JC1; T3168; Invitrogen), which accumulates into the
mitochondrial matrix. JC-1 was prepared as a 1000· stock
solution in dimethylsulfoxide (5 mgÆmL
)1
). At 24 and 48 h
after transfection, cells were detached by trypsin treatment
and stained for 30 min at 37 °C in fresh medium containing
JC1 (final concentration of 10 lgÆmL
)1
). Cells were then
washed twice with PBS, suspended in 500 lL of PBS and
analyzed using a FACScalibur cytofluorimeter (Becton
Dickinson, Franklin Lakes, NJ, USA). In each experiment,
some ADF cell samples were exposed for 30 min to the
uncoupling agent CCCP at a 50 lm concentration, and then
used as dissipation control. Data were analyzed using cell-
questÔ software (Becton Dickinson).
Transmission electron microscope analyses
At 24 or 48 h after ANT1 siRNA-a or Scramble transfec-
tion, both floating and adherent ADF cells were collected
by centrifugation. The pellets were washed in NaCl ⁄ P
i
and
fixed as previously described [45]. Ultrathin sections were
placed on Formvar carbon-coated nickel grids, stained with
uranyl acetate and lead citrate and observed under a Jeol
100 SX transmission electron microscope (Jeol, Ltd, Tokyo,
Japan).
Statistical analysis
In crystal violet assays aimed to analyze: the effect of
ANT2 overexpression on ANT1-silenced cells (Fig. 2C); the
effect of ANT1 and ANT2 co-silencing on ADF cells
(Fig. 2D); and the effect of puromycin on ANT1-silenced
cells (Fig. 2E), to allow the direct comparison of samples
with different controls bars indicate the percentage of live
cells with respect to the relative controls, as specifically
indicated in figure legend.
In glucose consumption assays, the absorbance data
obtained from the analysis of the cell medium were normal-
ized versus the total number of cells quantified in the
respective wells by the crystal violet assay. Data obtained
in viability, neutral red retention, and glucose consumption
assays were analyzed using the Student’s t-test for all pair-
wise comparisons. Data are presented as the mean ± SD
for replicate experiments.
Acknowledgements
We thank Dr Paola Iacopetti for critical reading of the
manuscript. Grant sponsor: Fondi per il finanziamento
progetti di ricerca Istituto Toscano Tumori (ITT) (to
L.R.); Fondazione Cassa di Risparmio di Livorno and
Fondazione Cassa di Risparmio di Lucca, Italy (to
V.G.).
References
1 Klingenberg M (1985) The ADP ⁄ ATP carrier in mito-
chondrial membranes. In The Enzymes of Biological
A. Lena et al. ANT1-silencing induces glioblastoma cell death
FEBS Journal 277 (2010) 2853–2867 ª 2010 The Authors Journal compilation ª 2010 FEBS 2865
Membranes, Vol. 4 (Martonosi AN ed), pp. 511–553.
Plenum Publishing Co, New York.
2 Fiore C, Tre
´
ze
´
guet V, Le Saux A, Roux P, Schwimmer
C, Dianoux AC, Noel F, Lauquin GJ, Brandolin G &
Vignais PV (1998) The mitochondrial ADP ⁄ ATP
carrier: structural, physiological and pathological
aspects. Biochimie 80, 137–150.
3 Palmieri F (2004) The mitochondrial transporter family
(SLC25): physiological and pathological implications.
Pflugers Arch 447 , 689–709.
4 Stepien G, Torroni A, Chung AB, Hodge JA & Wallace
DC (1992) Differential expression of adenine nucleotide
translocator isoforms in mammalian tissues and during
muscle cell differentiation. J Biol Chem 267, 14592–
14597.
5 Giraud S, Bonod-Bidaud C, Wesolowski-Louvel M &
Stepien G (1998) Expression of human ANT2 gene in
highly proliferative cells: GRBOX, a new transcriptional
element, is involved in the regulation of glycolytic ATP
import into mitochondria. J Mol Biol 281, 409–418.
6 Kim YH, Haidl G, Schaefer M, Egner U, Mandal A &
Herr JC (2007) Compartmentalization of a unique
ADP ⁄ ATP carrier protein SFEC (Sperm Flagellar
Energy Carrier, AAC4) with glycolytic enzymes in the
fibrous sheath of the human sperm flagellar principal
piece. Dev Biol 302, 463–476.
7 Barath P, Luciakova K, Hodny Z, Li R & Nelson BD
(1999) The growth-dependent expression of the adenine
nucleotide translocase-2 (ANT2) gene is regulated at the
level of transcription and is a marker of cell prolifera-
tion. Exp Cell Res 248, 583–588.
8 Dolce V, Scarcia P, Iacopetta D & Palmieri F (2005)
A fourth ADP ⁄ ATP carrier isoform in man: identifica-
tion, bacterial expression, functional characterization
and tissue distribution. FEBS Lett 579, 633–637.
9 Rodic
´
N, Oka M, Hamazaki T, Murawski MR, Jorgen-
sen M, Maatouk DM, Resnick JL, Li E & Terada N
(2005) DNA methylation is required for silencing of
ant4, an adenine nucleotide translocase selectively
expressed in mouse embryonic stem cells and germ cells.
Stem Cells 23, 1314–1323.
10 Torroni A, Stepien G, Hodge JA & Wallace DC (1990)
Neoplastic transformation is associated with coordinate
induction of nuclear and cytoplasmic oxidative phos-
phorylation genes. J Biol Chem 265, 20589–20593.
11 Chevrollier A, Loiseau D, Chabi B, Renier G, Douay
O, Malthie
`
ry Y & Stepien G (2005) ANT2 isoform
required for cancer cell glycolysis. J Bioenerg Biomembr
37, 307–316.
12 Faure Vigny H, Heddi A, Giraud S, Chautard D &
Stepien G (1996) Expression of oxidative phosphoryla-
tion genes in renal tumors and tumoral cell lines. Mol
Carcinog 16, 165–172.
13 Heddi A, Faure-Vigny H, Wallace DC & Stepien G
(1996) Coordinate expression of nuclear and mitochon-
drial genes involved in energy production in carcinoma
and oncocytoma. Biochim Biophys Acta 1316, 203–209.
14 Zoratti M & Szabo
`
I (1995) The mitochondrial perme-
ability transition. Biochim Biophys Acta 1241, 139–176.
15 Klingenberg M (2008) The ADP and ATP transport in
mitochondria and its carrier.
Biochim Biophys Acta
1778, 1978–2021.
16 Azuma M, Kabe Y, Kuramori C, Kondo M, Yamagu-
chi Y & Handa H (2008) Adenine nucleotide transloca-
tor transports haem precursors into mitochondria.
PLoS ONE 3, e3070.
17 Singh P, Suman S, Chandna S & Das TK (2009)
Possible role of amyloid-beta, adenine nucleotide tran-
slocase and cyclophilin-D interaction in mitochondrial
dysfunction of Alzheimer’s disease. Bioinformation 3,
440–445.
18 Martin LJ, Gertz B, Pan Y, Price AC, Molkentin JD &
Chang Q (2009) The mitochondrial permeability transi-
tion pore in motor neurons: involvement in the pathobi-
ology of ALS mice. Exp Neurol 218, 333–346.
19 Bauer MK, Schubert A, Rocks O & Grimm S (1999)
Adenine nucleotide translocase-1, a component of the
permeability transition pore, can dominantly induce
apoptosis. J Cell Biol 147, 1493–1502.
20 Le Bras M, Borgne-Sanchez A, Touat Z, El Dein OS,
Deniaud A, Maillier E, Lecellier G, Rebouillat D,
Lemaire C, Kroemer G et al. (2006) Chemosensitization
by knockdown of adenine nucleotide translocase-2.
Cancer Res 66, 9143–9152.
21 Jang JY, Choi Y, Jeon YK & Kim CW (2008) Suppres-
sion of adenine nucleotide translocase-2 by vector-based
siRNA in human breast cancer cells induces apoptosis
and inhibits tumor growth in vitro and in vivo. Breast
Cancer Res 10, R11.
22 Shabalina IG, Kramarova TV, Nedergaard J & Cannon
B (2006) Carboxyatractyloside effects on brown-fat
mitochondria imply that the adenine nucleotide translo-
cator isoforms ANT1 and ANT2 may be responsible
for basal and fatty-acid-induced uncoupling respec-
tively. Biochem J 399, 405–414.
23 Vyssokikh MY, Katz A, Rueck A, Wuensch C, Do
¨
rner
A, Zorov DB & Brdiczka D (2001) Adenine nucleotide
translocator isoforms 1 and 2 are differently distributed
in the mitochondrial inner membrane and have distinct
affinities to cyclophilin D. Biochem J 358, 349–358.
24 Zamora M, Granell M, Mampel T & Vin
˜
as O (2004)
Adenine nucleotide translocase 3 (ANT3) overexpres-
sion induces apoptosis in cultured cells. FEBS Lett 563,
155–160.
25 Lena A, Rechichi M, Salvetti A, Bartoli B, Vecchio
D, Scarcelli V, Amoroso R, Benvenuti L, Gagliardi
R, Gremigni V et al. (2009) Drugs targeting the
mitochondrial pore act as citotoxic and cytostatic
agents in temozolomide-resistant gliomacells. J Transl
Med 7, 13.
ANT1-silencing induces glioblastoma cell death A. Lena et al.
2866 FEBS Journal 277 (2010) 2853–2867 ª 2010 The Authors Journal compilation ª 2010 FEBS
26 Sperandio S, de Belle I & Bredesen DE (2000) An alter-
native, nonapoptotic form of programmed cell death.
Proc Natl Acad Sci USA 97, 14376–14381.
27 Clerkin JS, Naughton R, Quiney C & Cotter TG (2008)
Mechanisms of ROS modulated cell survival during car-
cinogenesis. Cancer Lett 266, 30–36.
28 Buck CR, Jurynec MJ, Gupta DK, Law AK, Bilger J,
Wallace DC & McKeon RJ (2003) Increased adenine
nucleotide translocator 1 in reactive astrocytes facili-
tates glutamate transport. Exp Neurol 181, 149–158.
29 Yamashita T, Yamauchi A, Miyai A, Taniguchi M,
Yoshimine T & Tohyama M (1999) Differential
regulation of adenine nucleotide translocators by
hypertonicity in the brain. J Neurochem 72, 1259–1265.
30 Chevrollier A, Loiseau D, Gautier F, Malthie
`
ry Y &
Stepien G (2005) ANT2 expression under hypoxic con-
ditions produces opposite cell-cycle behavior in 143B
and HepG2 cancer cells. Mol Carcinog 42, 1–8.
31 Hoa N, Myers MP, Douglass TG, Zhang JG, Delgado
C, Driggers L, Callahan LL, VanDeusen G, Pham JT,
Bhakta N et al. (2009) Molecular mechanisms of parap-
tosis induction: implications for a non-genetically modi-
fied tumor vaccine. PLoS ONE 4, e4631.
32 Nath KA, Ngo EO, Hebbel RP, Croatt AJ, Zhou B &
Nutter LM (1995) alpha-Ketoacids scavenge H2O2 in
vitro and in vivo and reduce menadione-induced DNA
injury and cytotoxicity. Am J Physiol 268, C227–C236.
33 Averill-Bates DA & Przybytkowski E (1994) The role of
glucose in cellular defences against cytotoxicity of
hydrogen peroxide in Chinese hamster ovary cells. Arch
Biochem Biophys 312, 52–58.
34 Brand MD, Pakay JL, Ocloo A, Kokoszka J, Wallace
DC, Brookes PS & Cornwall EJ (2005) The basal pro-
ton conductance of mitochondria depends on adenine
nucleotide translocase content. Biochem J 392, 353–362.
35 Echtay KS (2007) Mitochondrial uncoupling proteins –
what is their physiological role?. Free Radic Biol Med
43, 1351–1371.
36 Korshunov SS, Skulachev VP & Starkov AA (1997)
High protonic potential actuates a mechanism of pro-
duction of reactive oxygen species in mitochondria.
FEBS Lett 416, 15–18.
37 Votyakova TV & Reynolds IJ (2001) DeltaPsi(m)-
dependent and -independent production of reactive
oxygen species by rat brain mitochondria. J Neurochem
79, 266–277.
38 Skulachev VP (1997) Membrane-linked systems
preventing superoxide formation. Biosci Rep 17, 347–
366.
39 Jang JY, Choi Y, Jeon YK, Aung KC & Kim CW
(2008) Over-expression of adenine nucleotide translo-
case 1 (ANT1) induces apoptosis and tumor regression
in vivo. BMC Cancer 8, 160.
40 Zamora M, Meron
˜
o C, Vin
˜
as O & Mampel T (2004)
Recruitment of NF-kappaB into mitochondria is
involved in adenine nucleotide translocase 1 (ANT1)-
induced apoptosis. J Biol Chem 279, 38415–38423.
41 Fabrizi C, Colasanti M, Persichini T, Businaro R,
Starace G & Lauro GM (1994) Interferon gamma
up-regulates alpha 2 macroglobulin expression in
human astrocytoma cells. J Neuroimmunol 53, 31–37.
42 Elbashir SM, Harborth J, Weber K & Tuschl T (2002)
Analysis of gene function in somatic mammalian cells
using small interfering RNAs. Methods 26, 199–213.
43 Poliseno L, Evangelista M, Mercatanti A, Mariani L,
Citti L & Rainaldi G (2004) The energy profiling of
short interfering RNAs is highly predictive of their
activity. Oligonucleotides 14, 227–232.
44 Abramoff MD, Magelhaes PJ & Ram SJ (2004) Image
processing with ImageJ. Biophotonics Int 11, 36–42.
45 Chelli B, Rossi L, Da Pozzo E, Costa B, Spinetti F,
Rechichi M, Salvetti A, Lena A, Simorini F, Vanacore
R et al. (2005) PIGA (N,N-Di-n-butyl-5-chloro-2-(4-
chlorophenyl)indol-3-ylglyoxylamide), a new mitochon-
drial benzodiazepine-receptor ligand, induces apoptosis
in C6 glioma cells. Chembiochem 6, 1082–1088.
A. Lena et al. ANT1-silencing induces glioblastoma cell death
FEBS Journal 277 (2010) 2853–2867 ª 2010 The Authors Journal compilation ª 2010 FEBS 2867

![Tài liệu Báo cáo khoa học: The stereochemistry of benzo[a]pyrene-2¢-deoxyguanosine adducts affects DNA methylation by SssI and HhaI DNA methyltransferases pptx](https://media.store123doc.com/images/document/14/br/gc/medium_Y97X8XlBli.jpg)