Determinants of the interest rate pass-through of banks − evidence from German loan products pptx
Bạn đang xem bản rút gọn của tài liệu. Xem và tải ngay bản đầy đủ của tài liệu tại đây (276.57 KB, 72 trang )
Discussion Paper
Deutsche Bundesbank
No 26/2012
Determinants of the
interest rate pass-through of banks −
evidence from German loan products
Tobias Schlüter Thomas Hartmann-Wendels
(University of Cologne) (University of Cologne)
Ramona Busch Sönke Sievers
(Deutsche Bundesbank) (University of Cologne)
Discussion Papers represent the authors‘ personal opinions and do not
necessarily reflect the views of the Deutsche Bundesbank or its staff.
Editorial Board: Klaus Düllmann
Heinz Herrmann
Christoph Memmel
Deutsche Bundesbank, Wilhelm-Epstein-Straße 14, 60431 Frankfurt am Main,
Postfach 10 06 02, 60006 Frankfurt am Main
Tel +49 69 9566-0
Telex within Germany 41227, telex from abroad 414431
Please address all orders in writing to: Deutsche Bundesbank,
Press and Public Relations Division, at the above address or via fax +49 69 9566-3077
Internet
Reproduction permitted only if source is stated.
ISBN 978–3–86558–8– (Printversion)
ISBN 978–3–86558–8– (Internetversion)
This article examines the loan rate-setting behavior of German banks for a large variety of
retail and corporate loan products. We find that a bank’s operational efficiency is priced in
bank loan rates and alters interest-setting behavior. Specifically, we establish that a higher
degree of operational efficiency leads to lower loan markups, which involve more competitive
prices, and smoothed interest rate-setting. This study contributes to prior literature that has
been suggesting this relationship but has produced mixed findings. For the German market
this relationship is unexplored. By employing stochastic frontier analysis to comprehensively
capture cost efficiency, we take the bank customers’ perspective and demonstrate the extent to
which borrowers benefit from cost efficient banking.
interest rate pass-through models, error correction models, bank effi-
ciency, cost efficiency, stochastic frontier analysis
G21, G28
In bank based economies, such as Germany, households as well as corporations are financed
to a large extent by bank debt. Consequently, economic agents are notably reliant on the
conditions on which banks price their offered credit products. Banks typically adjust their
interest rates with regard to general market developments but research has found that this
interest rate pass-through from market interest rates to bank lending rates is sticky and price
rigidities prevail. In addition, significant heterogeneities among the individual credit
institutions’ product pricing persist. Attributes such as market power or funding structure have
been found to be important determinants explaining how banks set their lending rates and how
they react to changes in market interest rates. Prior international studies have also suggested a
bank’s operating efficiency to affect credit pricing since efficiency gains could be used to set
more competitive prices in the spirit of gaining market share or binding existing borrowers.
However, although suggested and emphasized by theoretical models this link is so far
untested for the German market. Furthermore, international studies have only provided weak
and even mixed results relying on financial accounting ratios to capture a bank’s efficiency.
Thus, we turn our attention to the question, whether banks that operate their business more
cost efficiently than their competitors, provide more competitive prices to borrowers. In
particular, we ask the following research question: Do efficient banks charge lower markups
above the market interest level and do they set loan rates more smoothly? The results suggest
that retail and corporate borrowers benefit in two ways when banks operate more cost
efficiently than their competitors: a) loan rate markups decrease and b) loan rate offers will be
less volatile.
In bankbasierten Volkswirtschaften wie der deutschen finanzieren sich Haushalte und
Unternehmen vorrangig über Bankkredite. Somit sind die einzelnen Wirtschaftssubjekte
besonders auf die Kreditkonditionen der Banken angewiesen. Typischerweise passen Banken
ihre Kreditkonditionen an die allgemeine Marktentwicklung an, wobei empirische Studien
zeigen, dass Marktzinsänderungen nur unvollständig und langsam an die Produktkonditionen
einzelner Banken weitergegeben werden. Zudem ist das Preissetzungsverhalten der Institute
durch eine breite Heterogenität charakterisiert, die zum Teil durch Eigenschaften wie
Marktmacht oder die Refinanzierungsstruktur der Banken erklärt werden kann. Darüber
hinaus besteht in der wissenschaftlichen Literatur die Vermutung, dass die operationelle
Effizienz einer Bank eine entscheidende Rolle bei der Preissetzung spielt. Dabei könnten
Effizienzvorteile bei der Produkterstellung auf der einen Seite genutzt werden, um für die
Eigentümer der Bank eine höhere Rendite zu erwirtschaften. Auf der anderen Seite könnten
diese Vorteile verwendet werden, um kompetitivere Preise zur Marktanteilsgewinnung bzw.
-verteidigung zu setzen. Dies würde sich dann in besseren Produktkonditionen für die Kunden
widerspiegeln. Obwohl gerade der letztgenannte Zusammenhang von mehreren Studien und
theoretischen Modellen vermutet wird, ist er für den deutschen Bankensektor noch nicht
untersucht worden. Darüber hinaus haben internationale Studien, welche meist traditionelle
Finanzkennzahlen zur Effizienzmessung heranziehen, bis heute nur schwache und sich teils
widersprechende Evidenz zu diesem Sachverhalt gefunden. Der Fokus dieser Studie wird
daher auf die Frage gelegt, ob Banken, die kosteneffizienter als ihre Mitbewerber arbeiten,
Effizienzvorteile an ihre Kreditnehmer weitergeben. Konkret wird untersucht, ob
kosteneffizientere Banken Kredite mit einem geringeren Aufschlag auf das Marktzinsniveau
preisen und Zinsanpassungen für die Kunden glätten. Unsere Resultate zeigen, dass
Kreditnehmer in zweifacher Hinsicht von Kosteneffizienz profitieren: a) Preisaufschläge auf
das Marktzinsniveau fallen geringer aus und b) Kreditkonditionen sind weniger volatil.
1.
Introduction 1
2. Related Literature 5
3. Research Question 7
4. Data 10
4.1. Sample description 10
4.2. Sample representativeness 13
5. Estimation Procedure and Econometric Considerations 14
5.1. Loan pricing behavior 14
5.2. Cost efficiency measurement 22
5.3. Further bank characteristics 29
6. Econometric Analysis and Main Results 32
7. Further Empirical Analysis and Robustness 42
7.1. Measurement alternatives for various control variables 42
7.2. Measurement alternatives for the main independent variable 43
7.3. Addressing the errors-in-variables problem 45
7.4. Further specifications: re-estimation on the individual product level 46
7.5. Extending the time span and excluding group central banks and large banks 47
8. Conclusion and Discussion 48
9. References 49
Appendix
Lerner index.………………………………………………………………………… 55
1
Determinants of the interest rate pass-through of banks
Evidence from German loan products
1
1. Introduction
In the German bank-based economy the loan rate-setting behavior of banks is highly relevant
for businesses and individuals. Consequently, a substantial body of research focuses on the
estimation and description of the behavior of banks that pass-through changes in official and
market-wide interest rates to their borrowers (ECB, 2009; De Bondt, 2005; Weth, 2002). Ana-
lyzing the process of financial intermediation between general market conditions and final
customer prices is of key interest for monetary policy and bank regulators. The broad evi-
dence suggests that the pass-through of market interest rates to the prices of bank products is
incomplete and price rigidities prevail. Based on this knowledge recent research examines the
determinants of the interest rate-setting behavior of banks (i.e., in terms of bank characteris-
tics, such as regulatory capital ratios, liquidity, bank risk and funding structure, or market
power). One key suggestion is that the degree to which a bank operates its business in a cost
efficiently manner should affect its loan rate-setting behavior. However, this cost efficiency
channel is currently untested with regard to the loan pricing behavior of German banks. In
addition, although suggested by prior international research, the influence of cost efficient
banking on interest-setting behavior should be more thoroughly examined because evidence
1
Tobias Schlüter (corresponding author), University of Cologne, Department of Banking, Albertus Magnus
Platz, 50923 Cologne, Germany, e-mail: , tel.: +49 221 470 1670; fax: +49 221
470 2305. Ramona Busch () is with the Deutsche Bundesbank, Financial Sta-
bility Department. Thomas Hartmann-Wendels () is with the Universi-
ty of Cologne, Department of Banking. Sönke Sievers () is with the University of
Cologne, Accounting Area.
This paper has benefited from the comments of research seminars at the Deutsche Bundesbank and at the
University of Cologne. We would like to thank Thomas Kick and Christoph Memmel for helpful comments.
The authors gratefully acknowledge funding from the Deutsche Bundesbank and the Department of Banking,
University of Cologne. This paper represents the authors’ personal opinions and not necessarily those of the
Deutsche Bundesbank.
2
on this topic is weak.
2
Consequently, this study tries to fill this gap by examining the loan
rate-setting behavior of German banks for a large variety of retail and corporate loan prod-
ucts.
3
Being precise, we address the question of whether a bank’s degree of operational effi-
ciency alters its interest-setting behavior and find that this effect is clearly verifiable if we rely
on state-of-the-art stochastic frontier models to capture cost efficiency (instead of traditional
accounting ratios). Charged loan markups are reduced if a bank efficiently operates its busi-
ness, and the interest rate adjustment speed is affected towards bank customers’ benefit, (i.e.,
the bank loan rates are set more smoothly, and borrowers are protected from upward changes
in market interest rates for a longer time period).
These findings are established by estimating interest rate-setting behavior consistent with a
large body of research that analyzes the pass-through of market rates to bank loan rates. Spe-
cifically, we employ error-correction interest rate pass-through (IPT) models that result in
bank-specific pricing characteristics which describe how a bank passes market movements on
to product prices. IPT model characteristics include the markup of loan rates above a market
rate, which can best be understood as the margin that a bank locks in between the charged
loan rate and the marginal cost of funding. Furthermore, the adjustment speed of product rates
as well as the short- and long-term pass-through of market movements are IPT characteristics.
Error correction models are commonly used to describe an IPT process and provide the ad-
vantages of a possible disentanglement of short- and long-run dynamics as well as the con-
temporaneous identification of equilibrium interest rate markups.
2
See section 2.
3
Our investigation is related to the area of literature concerning the explanation of a bank’s net interest margin
(NIM; i.e., interest income minus interest expenses over total assets). This part of the literature provides theo-
retical models and empirical findings that the NIM is related to factors that capture the operational costs of a
bank; thus, banks with more cost efficient operations typically have smaller NIMs (e.g., Maudos and De
Guevara, 2004; Maudos and Solis, 2009). A downsizing of NIM of a bank is likely to result in lower loan
rates and/or higher deposit rates for bank customers (Clayes and Vander Vennet, 2008). However, these stud-
ies employ ex-post accounting interest margins at the bank level and cannot observe whether the reduction of
the NIM is caused by a change in the pricing of assets, such as loans, or liabilities, such as deposits. Finally, a
detailed presentation of different products or product and customer classes is not possible for those studies.
3
While the IPT parameters provide the key dependent variables in our later econometric analy-
sis, we extend the literature by employing stochastic frontier analysis (SFA) for measuring
cost efficiency to establish that interest rates are more beneficial for borrowers of cost effi-
cient banks (cost efficiency pass-through effect). While one could expect this to be an obvious
first-order effect prior studies had difficulties to establish this finding by relying on traditional
accounting ratio-based efficiency measures, such as the ‘cost-income ratio’ or the ‘costs to
total assets ratio’. In contrast, the concept of SFA cost efficiency is to evaluate each bank’s
operational efficiency compared to its market competitors by asking the following question:
can the bank more advantageously allocate its resources to produce its output portfolio rela-
tive to other banks? Exemplary a bank could possess a superior degree of operational effi-
ciency (e.g., low screening and monitoring costs, or it is able to obtain funding at a lower rate
than other banks). Then, the bank is said to operate its business more cost efficiently than its
competitors and could pass on at least part of its efficiency gains to set more competitive pric-
es.
4
In recent years, the SFA-based cost efficiency measurement has become the standard to
assess a financial institution’s operating efficiency (Banker et al., 2010; Berger and Mester,
1997).
5
Thus, our research question combines the two streams of literature regarding interest rate
pass-through and bank efficiency measurement via stochastic frontier analysis. Put different-
ly, prior studies that concentrate on bank efficiency measurement primarily analyze how effi-
cient banks are, how to optimally measure cost efficiency or the extent to which efficiency
differs among institutions. To the best of our knowledge, thus far, a SFA-based efficiency
estimate has not been employed to capture variations in interest rate pass-through behavior.
We find that this approach is much more appropriate than the previously used financial ratios.
4
See section 3.
5
See sections 2 and 5 for details.
4
This paper proceeds as follows: the next section broadly integrates this study into the existing
literature. Section 3 develops testable hypotheses. Section 4 describes the employed data
sample, and section 5 describes how interest rate pass-through and cost efficiency are estimat-
ed. Section 6 presents the main results, which are validated in the following robustness sec-
tion. The final section concludes the paper.
5
The estimation of interest rate pass-through models has been extensively discussed in prior
literature (e.g., Kashyap and Stein, 2000; Mojon, 2000; De Bondt, 2005). The purpose of es-
timating how bank prices react to changes in official or market interest rates is motivated by
the aim of analyzing how well banks perform as financial intermediaries between general
market conditions and final customer prices (e.g., Hofman and Mizen, 2004; Kleimeier and
Sander, 2006). Furthermore, the speed and extent to which changes in funding costs are
passed on to bank customers should be known by banking regulation authorities (Wang and
Lee, 2009; Sander and Kleimeier, 2004). Thus, many studies focus on the estimation of cer-
tain pass-through parameters that describe the interest-setting behavior of banks (i.e., the final
results of pass-through models, such as interest rate markups, long-term pass-through coeffi-
cients or the speed of interest rate adjustment) (De Bondt, 2005; ECB, 2009; Kwapil and
Scharler, 2010; Liu et al., 2008; Rosen, 2002; Sander and Kleimeier, 2004). Consistent with
international research, studies of the German context document price rigidities and incomplete
pass-through behavior, such that market interest rate changes are not directly reflected in ad-
justed bank rates (e.g., Von Borstel, 2008; Nehls, 2006; Weth, 2002; Mueller-Spahn, 2008).
Due to commonly observed price stickiness, it is essential to analyze which bank characteris-
tics alter or hinder a complete and rapid product price adjustment following a market interest
rate change (e.g., De Greave et al., 2007; Ehrmann et al., 2003; Fuertes et al., 2010). Attrib-
utes, such as excess regulatory capital or a bank’s liquidity position, are found to hinder a
perfect market-to-customer interest rate pass-through. In the case of Germany, the studies of
Weth (2002) and Mueller-Spahn (2008) group banks successively according to their liquidity,
size, funding and asset diversification and then compare the estimated pass-through parame-
ters. In other words, these studies highlight that, for example, banks with a high fraction of
deposit funding exhibit a slower adjustment speed than their capital market-financed competi-
6
tors. Furthermore, prior research argues that a bank’s (in-)efficiency should be another key
factor impeding direct and complete pass-through (De Greave et al., 2007; Fuertes et al.,
2010, Gambacorta, 2008). For example, these researchers argue that cost efficiency gains
could be used to charge lower lending rates to gain market share. To control for efficiency
effects, studies rely on financial accounting ratios, such as the cost-income ratio (e.g., De
Greave et al., 2007; Focarelli and Panetta, 2003) or the costs-to-total assets ratio (e.g.,
Gambacorta, 2008). However, although this approach is theoretically appealing, the research
does not report significant relationships (Fuertes and Heffernan, 2009; De Greave et al., 2007;
Berger and Hannan, 1997) or just ‘marginally significant relationships (Fuertes et al., 2010;
Gambacorta, 2008). To the best of our knowledge, no study has analyzed the effects of effi-
ciency on pass-through behavior for Germany.
In addition, accounting-based financial ratios insufficiently capture the economic construct of
efficient banking (Banker et al., 2010; Berger and Humphrey, 1997; Goddard et al., 2007).
Research regarding the strand of literature concerning the measurement of bank efficiency
indicates that concepts, such as stochastic frontier models, are much more appropriate for as-
sessing cost or operational efficiency (e.g., Aigner et al., 1977; Fiorentino et al., 2006,
Fiordelisi et al., 2011; Altunbas et al., 2001). The degree of cost efficiency is referred to as a
relative valuation of a bank compared to the best-practice credit institution in terms of a com-
parable input and output portfolio and the lowest operating and financial costs (Fiorentino and
Herrmann, 2009).
Thus, the effects of bank efficiency on price setting have not been thoroughly explored for
German banks. Motivated by rather weak international evidence, we focus on obtaining an
appropriate measurement of bank efficiency and its implications on loan rate setting and on
the pass-through behavior of banks.
7
The relative SFA cost efficiency measure directly relates to the ability of a bank to operate its
business more cost efficiently than its market competitors. The natural question pertains to
whether bank borrowers benefit from the ability of a bank to operate cost efficiently. The lit-
erature concerning the interest rate-setting behavior of banks assumes that at least a portion of
cost efficiency gains or other cost advantages will be used for the benefit of the customers and
thus for the provision of more competitive loan prices (see, e.g., De Greave et al., 2007; Fuer-
tes et al., 2010). However, empirical evidence of the possible effects of efficiency is either
insignificant or weak. In the case of Germany, it is unexplored.
These rather weak findings can naturally be explained by the assumption that all banks max-
imize their profits. For banks with more cost efficient operations, it could be beneficial under
certain circumstances to retain efficiency gains to benefit the shareholders of such banks. This
perception would clearly explain why evidence of a possible cost efficiency pass-through to
more favorable customer loan rates is weak or cannot be detected. Contrary, because the
German banking market is saturated and mature, the organic growth of banks is quiet low.
Thus, under the common assumption that banks intend to maintain or even increase their mar-
ket share, they might find it appealing to set loan prices below those of their competitors.
Therefore, banks working cost efficiently might pass on their efficiency gains while still con-
sidering their long-run business continuance (i.e., they do not set such low loan rates that
would not cover the costs over a long time period).
However, a large body of supportive evidence for the latter consideration relates to the area of
research that is focused on identifying the determinants of the net interest margins (NIM) of
banks: theoretical models indicate the importance of operational and overhead costs and their
influence on NIMs. Specifically, Maudos and De Guevara (2004) introduce a model that ex-
plains a NIM that increases as a result of higher operational costs and these authors refer to
8
the negligence of controlling for operational efficiency as a potential omitted variable bias of
all prior studies explaining the NIM. Broad empirical evidence indicates that NIMs decline
(rise) as operational costs decrease (increase) (Entrop et al., 2012; Maudos and Solis, 2009;
Clayes and Vander Vennet, 2008; Carbo and Fernandez, 2007). This strand of the literature is
highly supportive of our hypothesis, as a change in NIM is likely to cause higher interest paid
on liabilities and/or lower credit rates charged. However, the extent to which the pricing of
liabilities or assets is affected cannot be observed by those studies given an interest margin
that is calculated using ex-post accounting income and expense figures at the bank level (for
this specific topic, see Clayes and Vander Vennet, 2008). Only the recent study by Entrop et
al. (2012) examines the interest income and expense margins separately. However, the degree
to which new business interest rates, the loan rates that are charged to certain customer and
product groups, or even individual loan products are affected by operational efficiency re-
mains unclear in the NIM studies.
To provide insight into this theoretical association between efficiency and interest rate-setting
behavior, we conduct an empirical examination of the effects of cost efficiency on the loan
rate-setting behavior of German banks. Following the previously suggested relationships be-
tween loan rates and the degree of operational efficiency of a bank, we would expect that an
increase in efficiency could lead to benefits for bank borrowers. As noted in the introduction,
a bank is considered to operate beneficially for its customers when it charges lower interest
rate markups and provides more stable interest rate offers compared with its competitors (i.e.,
the bank adjusts its loan rates more slowly). While the benefits of lower markups are obvious,
the literature argues that a delayed, slow pass-through of market movements to loan rates is
beneficial for bank borrowers. Banks shield their customers from sudden market movements
and provide smooth interest rate adjustments (Fuertes and Heffernan, 2009; Von Borstel,
2008; Mueller-Spahn, 2008). Especially in the environment of increasing market interest rates
9
between the fall of 2005 and the fall of 2008, interest rate smoothing will have been valued by
bank borrowers.
In addition, we analyze whether SFA-based cost efficiency is more appropriate than the pre-
viously suggested traditional accounting ratios. Lastly, we turn our attention to the question
whether for some loan products the efficiency effects are more pronounced than for others.
The next section describes the data and presents evidence regarding their representativeness.
10
Our dataset is obtained from the German central bank (‘Deutsche Bundesbank’). The main
sample consists of the regulatory information pertaining to 150 banks that have all of neces-
sary interest rate, balance sheet and profit and loss (P&L) account data for the period from
January 2003 to September 2008.
6
For information on interest rates, we employ the monthly
MFI interest rate (MIR) statistics (‘EWU Zinsstatistik’). We augment the sample with public-
ly available market interest rates, which we obtain from Deutsche Bundesbank.
7
Additionally,
we obtain balance sheet statistics (‘BISTA’) and information on P&L from the schedule pur-
suant to the auditor reports (‘Sonderdatenkatalog’). For interest rates, the monthly MIR statis-
tics present interest rates and new business volumes for 11 standardized retail loan products
and 7 corporate loan products collected for approximately 200 German banks.
8
However, we
request observations with consecutive, non-missing interest rate data for each bank and prod-
uct such that we are able to analyze 150 banks, resulting in a total of 127,891 bank-product-
month observations for the pass-through estimation.
9
Table 1 presents summary statistics for
the employed interest rates.
6
We focus our main analysis on the time period January 2003 to September 2008 for two reasons. First, the
employed interest rate statistics were introduced in January 2003 and second we want exclude any effects at-
tributable to the Lehman collapse and the following financial crisis. However, in the robustness section we
include the time span after the Lehman collapse until September 2011 and our findings remain valid.
7
We use EURIBOR and government bond rates with varying maturities.
8
See Table 1 for a list of products. For more details, see the Deutsche Bundesbank monthly report for January
2004, which is available at
2004/200401mb_e.pdf.
9
This requirement is the major condition that reduces the possible sample size. For more details, see the next
section regarding the estimation of the interest rate pass-through models. Panel A Table 3 of presents the dis-
tribution of available time-series data for the examined loan products.
11
Table 1: MIR statistics – surveyed products and interest rates summary statistics
average interest rates
product
number
all banks
(N = 150)
mean s.d.
overdrafts 12 10.84 2.39
consumer credit with
floating rate or initial rate fixation of up to 1 year 13 6.53 1.76
initial rate fixation of over 1 and up to 5 years 14 6.69 1.45
initial rate fixation of over 5 years 15 6.93 1.61
housing loans with
floating rate or initial rate fixation of up to 1 year 16 5.09 0.89
initial rate fixation of over 1 and up to 5 years 17 4.68 0.59
initial rate fixation of over 5 and up to 10 years 18 4.97 0.45
initial rate fixation of over 10 years 19 4.70 0.57
other loans with
floating rate or initial rate fixation of up to 1 year 20 5.26 1.21
initial rate fixation of over 1 and up to 5 years 21 5.36 0.88
initial rate fixation of over 5 years 22 5.12 0.76
overdrafts 23 7.76 2.08
loans up to euro 1 million with
floating rate or initial rate fixation of up to 1 year 24 5.16 1.15
initial rate fixation over 1 and up to 5 years 25 5.27 0.83
initial rate fixation over 5 years 26 5.06 0.75
loans over euro 1 million with
floating rate or initial rate fixation of up to 1 year 27 4.41 1.15
initial rate fixation over 1 and up to 5 years 28 4.59 0.96
initial rate fixation over 5 years 29 4.82 0.74
Notes:
The MFI interest rate (MIR) statistics requires about 200 German banks to report monthly on
the above stated interest rates. Each product is identified with a ‘product number’ ranging
from 12 to 29. See the Deutsche Bundesbank monthly report of January 2004 for details.
In addition, this table presents loan product summary statistics of MFI interest rates from
January 2003 until September 2008. We present mean interest rates and its standard deviation
for the 150 banks.
Our final sample consists of 24 commercial banks (Comms), of which 4 banks are the major
German Comms (large banks). Furthermore, we are able to analyze 82 savings banks (Savs),
of which 11 banks supra-regional central banks for local Savs (‘Landesbanken’). Finally, our
sample contains information on 44 cooperative banks (Coops), of which 2 banks are central
banks for the other cooperative banks. Panel A of Table 2 presents summary statistics regard-
ing the compiled balance sheet, P&L and risk relevant data. Panel B presents the covariates
motivated by prior literature employed and discussed in the later regression analysis. Finally,
12
Panel C includes summary statistics on key variables to capture the representativeness of our
sample, which is elaborated in detail below.
10
Table 2: Summary statistics of sample banks
mean s.d. mean s.d.
cash 53 123 interest income 1,310 3,544
lending to banks 7,530 24,300 interest expenses 983 2,826
lending to non-banks 13,100 37,000 net interest income 328 785
bonds and other interest bearing sec. 5,920 15,700 non-interest income 150 566
stocks and other non-interest bearing sec. 1,150 5,520 non-interest expenses 37 132
total assets 29,000 86,300 net non-interest income 112 447
deposits of banks 9,600 31,000 trading results 27 175
deposits of non-banks 11,800 34,100 tier 1 capital 965 2,179
saving deposits 1,830 3,640 tier 2 capital 586 1,389
equity 942 2,220 risk weighted assets 11,500 25,630
mean s.d.
‘excess capital’ 5.37 3.25
‘liquidity’ 31.97 16.56
‘deposit funding’ 60.39 17.80
‘market share’ 1.12 0.40
‘credit risk’ 2.66 1.88
‘size’ 22.78 1.36
(relative to German banking system)
average year
2003 2004 2005 2006 2007 2008
total assets
#
0.62 0.62 0.65 0.73 0.74 0.74 0.49
lending to banks (MFIs) 0.66 0.66 0.70 0.81 0.80 0.76 0.50
lending to non-banks (non-MFIs) 0.59 0.59 0.61 0.68 0.70 0.71 0.48
saving deposits 0.41 0.38 0.39 0.44 0.45 0.45 0.38
securitized liabilities 0.68 0.64 0.67 0.81 0.83 0.84 0.54
Notes:
This table presents summary statistics of the MIR statistics reporting banks. We report mean values and the standard devia-
tion of the employed variables. Panel A presents balance sheet summaries and profit and loss account information and
summaries statistics of bank capital and risk weighted assets. Panel B presents summaries on the independent variables
used for the main regressions. Last, Panel C presents sample representativeness: For five balance sheet figures we present
the sum of all 150 MIR statistics reporting banks relative to all German banks (i.e., in 2007 the sample of 150 banks ac-
counts for 74% of total assets in the German banking market and on average for 62% during the sample period).
10
Our sample is adjusted for mergers; thus, we treat a merged bank as two separate banks before the merger
and as one new bank after the merger.
13
Because the complete German banking market consists of approximately 2,000 credit institu-
tions
11
, we have to address the question of whether the analyzed 150 banks are a representa-
tive sample. Because our study is limited to MIR reporting banks, we must acknowledge the
nature of the MIR statistics. In the selection of banks for the reports, the Deutsche
Bundesbank mirrors the German banking market (i.e., banks are selected such that all German
bank groups all over the country are represented).
12
Thus, Deutsche Bundesbank indicates that
the sample of MIR reporting banks is a representative profile of the German banking market.
Furthermore, when we compare our sample to all BISTA reporting banks (i.e., more than
2,000 banks), we show that our sample represents a large portion of the German banking
business. Panel C of Table 2 presents comparisons of the 150 banks analyzed to the complete
market. Regardless of whether total assets, lending to banks or non-banks, or debt are consid-
ered, the 150 banks are largely representative of the market (e.g., our sample banks account
for approximately 62% of the total assets of all banks and are responsible for 66% of all non-
bank lending). Furthermore, the total assets of all German banks account for approximately
25% of the total assets of all European banks at the end of 2008.
13
Thus, we note that our
sample is representative for Germany and even accounts for large parts of the European bank-
ing market.
The next section describes how we estimate the characteristics of the interest rate-setting be-
havior, primarily the markup of loan rates above a market rate and the adjustment speed with
which market movements are passed through to bank customers. Then, the following section
describes how to properly measure bank efficiency.
11
See
itute/Banken/Banken_In_Deutschland/S131ATB10607.pdf?__blob=publicationFile
12
See the Bundesbank monthly report of January 2004 for details. Within one geographical region, the largest
credit institutions of each bank group are selected.
13
We obtain data pertaining to the total assets of all European banks from www.ecb.int.
14
This section describes the estimation of the interest rate pass-through (IPT) parameters that
will be explained by bank factors in the subsequent analysis. The results of IPT models will
be bank- and product-specific loan markups (i.e., the spread above the market interest rate),
the speed of interest rate adjustment (i.e., the length of time that is required to pass on a mar-
ket interest rate change) and the short- and long-run adjustment coefficients that capture
whether a pass-through is one for one. To determine which market interest rates are chosen,
we follow the ‘cost of funds’ approach that is used in many prior studies and that considers
market rates to be a representation of a bank’s marginal funding costs (e.g., Sander and
Kleimeier, 2004). The selection is based on the identification of market interest rates whose
evolution exhibits the highest correlation with the development of new-business bank interest
rates (e.g., De Bondt, 2005; Sander and Kleimeier, 2004). Additionally, we require the market
rate to have a similar maturity as the bank product; for example, if a loan has a maturity range
of one to three years, then the same range must be applied to the market rate (De Greave et
al., 2007; Mueller-Spahn, 2008; Sørensen and Werner, 2006). For short maturities, we employ
public money market rates, and we rely on German government bond rates for maturities of
more than one year.
14
Panel B of Table 3 presents the results of the correlation analysis that is
performed.
The standard approach of estimating the pass-through of market interest rates to bank lending
rates is to represent a bank’s interest rate at time t as a function of its own lagged values and
of the corresponding market interest rate at time t and its lagged values (Sander and
14
Some studies highlight the advantages of bank bond rates compared with government bond rates. Von
Borstel (2008) argues that bank bonds better reflect the actual marginal cost of funding for longer maturities.
Nevertheless, the study finds that the results of pass-through parameters do not differ significantly, regardless
of whether government or bank bond rates are employed.
15
Kleimeier, 2004, Sander and Kleimeier, 2006; Weth, 2002; Kremers et al., 1992; Pesaran and
Shin, 1999; Cottarelli and Kourelis, 1994). Because interest rate time series often exhibit an
ܫ
ሺ
ͳ
ሻ
property (i.e., integrated of order one), the estimation of bank interest rates in first differ-
ences (VAR) is necessary to avoid spurious results (Granger and Newbold, 1974; Philipps,
1986).
15
However, the estimation of differences does not prevent the absolute levels of loan
and market rates from departing from one another to a great extent (i.e., possible long-run
relationships between both time series could be ignored). Further, in the case of cointegration
between the market and bank interest rate time series (i.e., when a stationary equilibrium ex-
ists), the VAR process can be augmented by the inclusion of an error correction term (ECT)
(e.g., Engle and Granger, 1987; Kleimeier and Sander, 2006; Sander and Kleimeier, 2004;
Burgstaller, 2005). To verify the existence of a cointegration relationship between the bank
interest rate and the chosen market rate, we perform two different tests: the first test is a two-
step residual-based test and involves the tests for cointegration that are proposed by Engle and
Granger (1987), whereas the second test is based on Johansen’s (1995, 1991) maximum like-
lihood estimator (Kwapil and Scharler, 2010).
15
The augmented Dickey-Fuller test indicates that nearly all time series are of order one.
16
Table 3: Interest rate pass-through models – preliminary analysis
product number 12 13 14 15 16 17 18 19 20 21 22
statistic
mean 64.23 64.70 64.75 64.70 64.04 63.99 64.08 64.23 64.06 64.05 64.15
median 69 69 69 69 69 69 69 69 69 69 69
p25 69 69 69 69 69 69 69 69 69 69 69
product number 23 24 25 26 27 28 29
statistic
mean 54.94 54.96 54.99 55.00 55.23 54.47 55.39
median 58 58 58 58 58 58 58
p25 58 58 58 58 58 58 58
product number 12 13 14 15 16 17 18 19 20 21 22
maturity (-) <1y 1-5y >5y <1y 1-5y 5-10 y >10y <1y 1-5y >5y
market rate EB EON GB GB EB EB GB GB EB EB GB
maturity 3m (-) 5y 10y 1w 1y 8y 14y 1w 3m 10y
correlation 0.71 0.66 0.47 0.77 0.63 0.76 0.76 0.71 0.57 0.56 0.52
product number 23 24 25 26 27 28 29
maturity (-) < 1y 1-5y >5y <1y 1-5y >5y
market rate EB EB GB GB EB EB GB
maturity 1w 3m 2y 10y 1m 12m 12y
correlation 0.56 0.73 0.64 0.50 0.84 0.63 0.56
product number 12 13 14 15 16 17 18 19 20 21 22
mean 1.05 1.07 1.05 1.05 1.08 1.06 1.17 1.06 1.10 1.06 1.10
min 1 0 0 1 0 1 1 1 0 0 0
max 3 3 6 3 4 3 4 3 4 3 6
product number 23 24 25 26 27 28 29
mean 1.08 1.08 1.08 1.03 1.11 1.00 1.07
min 1 1 1 1 1 1 1
max 4 4 5 2 5 1 4
product 12 13 14 15 16 17 18 19 20 21 22
# 39 16 27 25 12 14 2 2 3 1 4
product 23 24 25 26 27 28 29
# 44 2 4 1 4 0 0
Notes:
This table presents initial summary statistics and necessary tests before the interest rate pass-through model
can be estimated. Panel A presents statistics on interest data availability. Reported statistics are mean and
quantiles of ‘number of months of o
b
servations’ for the banks per product. Panel B shows the results of the
performed correlation analysis. For each loan product its maturity is shown. Below we present the market
interest rate with highest correlation to the bank product. ‘EON’ refers to the EONIA rate, ‘EB’ to
EURIBOR and ‘GB’ to German government bonds. The respective maturity of market interest rates is
presented below. ‘w’ is ‘week’, ‘m’ equals ‘month’ and last ‘y’ is the abbreviation for ‘year’.
Panel C shows the summary statistics of the lag selection statistics
b
y following Engle and Granger (1987)
for the banks and each banking product using minimization of the Schwarz Bayesian information criterion
(‘SBIC’). The maximum lag is set to six months (e.g., De Greave et al., 2007). Results remain qualitatively
unchanged if maximum lag is varied. Last, Panel D presents the frequencies of non-cointegrated time series
per product. The total number of interest time series is 2,146.
17
Panel C of Table 3 presents summary statistics for the two-step test that is performed.
16
We
perform the tests for each bank and each loan product, respectively, and thus account for pric-
ing heterogeneities across the credit institutions and their products. Further analysis is based
on only bank and market interest rate time series that are cointegrated, whereas cointegration
applies to more than 90% of all available time series.
17
Panel D of Table 3 presents the distri-
bution of the non-cointegrated time series. Most of these cases appear to occur with overdraft
products for retail and corporate customers. This result is expected because the pricing of
those products is the most rigid and is not driven by minor market movements. Panel A of
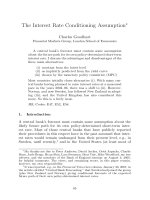
Figure 1 provides hypothetical examples of co-integrated time series while Panel B provides
two generalized examples of time series of loan rates and market rates that lack
cointegration.
18
The estimation of error-correction pass-through models would be disputable
for such time series.
Because our main sample consists only of time series that are cointegrated, the error correc-
tion representation (ECM) is the standard approach to estimate the reaction of bank interest
rates to changes in market interest rates (Fuertes and Heffernan, 2009; Liu et al., 2008;
Mojon, 2000; Weth, 2002). Our study employs two different methods of estimating the inter-
est rate pass-through process suggested by the literature.
19
First, we use two-step estimation
models to determine pass-through (e.g., De Greave et al., 2007; Engle and Granger, 1987).
Second, we run simultaneous error correction estimation advocated by more recent research
(Liu et al., 2008; Hofman and Mizen, 2004; Johansen, 1995). In the following sections, we
present the results for both methodologies (i.e., the simultaneous maximum likelihood error
correction estimations and the two-step Engle and Granger (1987) method).
16
The results for the test proposed by Johansen (1995, 1991) differ only to a minor extent.
17
That is, the null hypothesis of an existing cointegration relationship cannot be rejected at the 10% level.
18
We do not present interest rate time series of individual banks but present generalized time series being aver-
aged data of several banks.
19
This choice was motivated by Lozano-Vivas and Pasiouras (2010), who claim that few studies compare dif-
ferent methodologies.
18
Figure 1: Examples of bank product time series
Notes:
Panels A and B present generalized, hypothetical examples of retail consumer loans with a maturity of one to three years
during January 2003 and September 2008. Being precise, we do not present interest rate time series of individual banks but
present time series being averaged data of several banks due to confidentiality. The red colored time series present the market
rate which would be used for the error correction framework. Panel A shows examples that are cointegrated with the market
rate and thus used for the estimation of an interest rate pass-through models. Panel B presents examples of time series that are
non-cointegrated. These are excluded from the analysis (blue colored). Estimating an ECM would be misleading because the
loan rates are obviously not set according to the market rate development.
2 3 4 5 6
2003m1 2004m1 2005m1 2006m1 2007m1 2008m1
bank loan rate market rate
3 3.5 4 4.5 5 5.5
2003m1 2004m1 2005m1 2006m1 2007m1 2008m1
bank loan rate market rate
2 4 6 8 10
2003m1 2004m1 2005m1 2006m1 2007m1 2008m1
bank loan rate market rate
2 4 6 8 10
2003m1 2004m1 2005m1 2006m1 2007m1 2008m1
bank loan rate market rate
19
The maximum likelihood model estimates the pass-through of market interest rates to bank
rates using the following representation for each loan product:
߂ܾݎ
ǡǡ௧
ൌߙ
ǡ
ڄ൫ܾݎ
ǡǡ௧ିଵ
െߚ
ǡ
ڄ݉ݎ
ǡ௧ିଵ
െߤ
ǡ
൯߉
ǡǡ
ڄ߂݉ݎ
ǡ௧ି
כ
ୀଵ
߁
ǡǡ
ڄ߂ܾݎ
ǡǡ௧ି
ߝ
ǡǡ௧
כ
ୀଵ
where ܾݎ
ǡǡ௧
is the observed bank interest rate at time ݐ (i.e., the bank loan rate for each of the
18 loan products); ݅ൌͳǡǥǡͳͷͲ indexes the banks; ݆ൌͳǡǥǡͳͺ indexes the loan products;
and ݉ݎ
ǡ௧
is the market interest rate. ǻ accounts for the difference operator, and ߙ
ǡ
is the
equilibrium restoring condition that captures the error correction adjustment speed when bank
rates depart from their equilibrium relationship with market rates. For ease of interpretation,
we refer to ͳߙ
ǡ
Τ
as the adjustment duration with that market interest rate changes are passed
through to bank rates.
20
ߤ
ǡ
is the bank- and product-specific markup above the corresponding
market interest rate. The bank and loan product-specific long-term pass-through coefficient is
measured by ߚ
ǡ
, which measures whether a market interest change is completely passed on
to bank rates in the long run. Ȧ
ǡǡଵ
describes the short-run pass-through (i.e., the extent to
which changed market conditions alter loan rates within a one-month period). ߝ
ǡǡ௧
is the error
term, and
כ
and ݍ
כ
are the optimal lag lengths, which are chosen by the minimization of the
Schwarz Bayesian information criterion (see Panel C of Table 3 for summary statistics on the
results of the lag selection). The parameters are obtained simultaneously by applying maxi-
mum likelihood optimization.
In contrast to the simultaneous maximum likelihood estimates the two-step Engle and
Granger model estimates two separate ordinary least squares regressions (OLS): First, the
error correction term ‘ܾݎ
ǡǡ௧
ൌߤ
ǡ
ߚ
ǡ
ڄ݉ݎ
ǡ௧ିଵ
ݑ
ǡǡ௧
’ is estimated, and the obtained
20
Some studies (e.g., De Greave et al., 2007) define the adjustment duration as ൫ߚ
ǡ
െȁ
ǡǡଵ
൯Ȁߙ
ǡ
. If this defi-
nition were employed, our estimation results would resemble those for the adjustment duration as defined
above. However, note that the definition proposed by De Greave et al. (2007) relies on the individual long-
and short-term pass-through behavior of a bank; thus, the comparability across institutions will suffer.