Global Financial Stability Report: Restoring Confidence and Progressing on Reforms doc
Bạn đang xem bản rút gọn của tài liệu. Xem và tải ngay bản đầy đủ của tài liệu tại đây (9.99 MB, 200 trang )
World Economic and Financial Surveys
Global Financial Stability Report
Restoring Condence and
Progressing on Reforms
OCTOBER 2012
International Monetary Fund
©2012 International Monetary Fund
Cataloging-in-Publication Data
Joint Bank-Fund Library
Global financial stability report – Washington, DC :
International Monetary Fund, 2002–
v. ; cm. – (World economic and financial surveys, 0258-7440)
Semiannual
Some issues also have thematic titles.
ISSN 1729-701X
1. Capital market — Development countries — Periodicals.
2. International finance — Periodicals. 3. Economic stabilization —
Periodicals. I. International Monetary Fund. II. Series: World economic and financial surveys.
HG4523.G563
ISBN 978-1-61635-390-2
Please send orders to:
International Monetary Fund, Publications Services
P.O. Box 92780, Washington, DC 20090, U.S.A.
Tel.: (202) 623-7430 Fax: (202) 623-7201
E-mail:
www.imfbookstore.org
www.elibrary.imf.org
CONTENTS
International Monetary Fund | October 2012 iii
Preface ix
Executive Summary xi
Chapter 1 Global Financial Stability Assessment 1
Status of Stability Indicators 1
e Euro Area 4
e United States 15
Japan 16
Emerging Markets and Other Economies 16
Regulatory Reform 17
References 20
Chapter 2 Restoring Condence and Containing Global Spillovers 21
Global Debt Overhang and Stability Challenges 21
Euro Area Crisis—Reversing Financial Fragmentation 25
e United States: Stability or Complacency? 42
Japan: How Safe a Safe Haven? 52
Emerging Market and Other Economies: Navigating Domestic and Global Risks 55
Annex 2.1. Update to the EU Bank Deleveraging Exercise 68
References 73
Chapter 3 The Reform Agenda: An Interim Report on Progress Toward a Safer Financial System 75
Summary 75
Structural Features Associated with the Crisis 77
e Goal of Reforms—Desirable Structures of Financial Intermediation 80
Objectives and Implications of the New Regulatory Initiatives 82
Structural Implications of Crisis Intervention Measures 92
Change over the Past Five Years: Are Financial Systems Structurally Safer? 96
Analyzing the Eect of Reforms on Structures—An Early Look 104
Implications for the Reform Agenda 110
Annex 3.1. Financial Structure Indices 114
Annex 3.2. Regulatory Initiatives: Proposals and Implementation Status 116
Annex 3.3. Exploring the Impact of Regulatory and Crisis Intervention Policies
on Financial Structures 132
Annex 3.4. Indices of Progress on Basel Capital and Liquidity Standards 136
References 137
Chapter 4 Changing Global Financial Structures: Can They Improve Economic Outcomes? 141
Summary 141
e Relationship between Financial Structures and Economic Outcomes 143
Simple Correlations 146
Country Case Studies 149
CONTENTS
iv International Monetary Fund | October 2012
Multivariate Regressions 152
Policy Implications 161
Annex 4.1. What Does the Literature Say About the Relationship between Financial
Structures and Economic Outcomes? 164
Annex 4.2. Econometric Study on Financial Structures and Economic Outcomes:
Data, Methodology, and Detailed Results 166
Annex 4.3. Financial Structure Variables and the Probability of Banking Crises:
Data, Methodology, and Detailed Results 172
References 174
Glossary 177
Annex: Summing Up by the Acting Chair 185
Statistical Appendix
[Available online at www.imf.org/external/pubs/ft/gfsr/2012/02/pdf/statapp.pdf]
Boxes
1.1. Falling Condence, Rising Risks, and Complacency 6
1.2. Recent Policy Initiatives, Developments, and Challenges in the Euro Area 9
1.3. Resilience of the Euro, or Fragile Equilibrium? 14
1.4. Regulatory Reform: From Rulemaking to Implementation 18
2.1. Systemic Risk in International Dollar Credit 25
2.2. Why Are Euro Area Periphery Sovereign Spreads So High? 28
2.3. European Bank Deleveraging: An Update 31
2.4. Corporate Sector Fundamentals, Funding Conditions, and Credit Risks 36
2.5. Key Challenges for the Dealer Operations of U.S. Banks 43
2.6. How Impaired Is Liquidity in the U.S. Corporate Bond Trading Market? 49
2.7. Avoiding the Pitfalls of Financial Liberalization in China—Credit Risk, Liquidity
Mismatches, and Moral Hazard in Nonbank Intermediation 63
3.1. Risks Associated with New Forms of Financial Intermediation 78
3.2. Global Deleveraging Landscape: Economy- and Bank-Level View 87
3.3. TRuPs and the Impact of Basel III on U.S. Banks 89
3.4. Side Eects of Low Policy Interest Rates 94
3.5. Did Some Banking Systems Withstand International Contagion Because ey Are
Less Globally Integrated? 106
4.1. Financial Depth and Economic Outcomes 144
4.2. How Robust Are the Econometric Results? 148
4.3. Australia 153
4.4. e United States 155
4.5. Germany 156
4.6. Japan 157
4.7. China 159
Tables
2.1. Indebtedness and Leverage in Selected Advanced Economies 22
2.2. Banking Financial Stability Indicators 23
2.3. Sovereign Market and Vulnerability Indicators 24
2.4. Key Features of Sovereign Funding and Bank Deleveraging Scenarios 34
2.5. Holdings of Treasury Securities, by Sector 46
CONTENTS
International Monetary Fund | October 2012 v
2.6. Impact on Domestic Bank Balance Sheets from a Hypothetical Reversal of Foreign Inows
into Local Bond Markets 59
2.7. Overview of Recent Macroprudential and Capital Flow Measures in Selected Emerging
Market and Other Economies 66
2.8. Indicators of Vulnerability and Policy Space For Emerging Market and Other Economies 67
2.9. Summary of Updates in the Deleveraging Exercise 69
2.10. Assumptions on Key Macro-Financial Variables 69
2.11. Average Funding Rollover Rates 70
2.12. Amount of Additional Funding Required from Domestic Investors 71
2.13. Progress on the Implementation of Business Plans by Selected EU Banks 72
3.1. Financial Structure before the Crisis and Financial Stress during the Crisis 81
3.2. Snapshot of the New Regulatory Initiatives 84
3.3. Possible Eects of Regulatory Reforms on Financial Structure 85
3.4. Government and Central Bank Crisis Measures, 2007–10 93
3.5. Eect of Progress in Basel Capital Rules on Intermediation Structures 105
3.6. Indices, Subindices, and Data Sources 115
3.7. Snapshot of the New Global Regulatory Initiatives: Resolution of G-SIFIs 118
3.8. Status of Initiatives, by Selected Economy 122
3.9. Eect of Progress in Basel Liquidity Rules on Intermediation Structures 134
3.10. Eect of Financial Policies on Intermediation Structures: Crisis Intervention Policies 135
3.11. Basel Capital and Liquidity Progress Index 136
4.1. Financial Structure Measures in is GFSR 147
4.2. Financial Sector Size, Structure, and Economic Performance in Case Study Countries 154
4.3. Summary of Fixed-Eects Panel Estimation Results on Economic Outcomes, 1998–2010 160
4.4. List of Variables Used in Regression Analysis 167
4.5. Fixed-Eects Panel Estimation with Interaction Term, 1998–2010 168
4.6. Fixed-Eects Panel Estimation with Quadratic Term, 1998–2010 170
4.7. Systemic Banking Crises and Financial Structure Variables: Probit Model 173
Figures
1.1. Global Financial Stability Map 2
1.2. Global Financial Stability Map: Assessment of Risks and Conditions 3
1.3. Asset Price Performance since April 2012 GFSR 4
1.4. Cumulative Flows to Global Mutual Funds 4
1.5. Portfolio and Other Investment Capital Flows in the Euro Area, Excluding Central Banks 5
1.6. Spain and Italy: Changes in Foreign Investor Shares and Yields 5
1.7. Euro Area Exposures to Greece, Ireland, Italy, Portugal, and Spain 5
1.8. Periphery Minus Core Credit Default Swap Spreads 5
1.9. Total Deleveraging by Sample Banks 12
1.10. Reduction in Euro Area Supply of Credit under Alternative Policy Scenarios 12
1.11. Impact on Investment from EU Bank Deleveraging 12
1.12. Impact on Employment from EU Bank Deleveraging 12
1.13. Impact on GDP from EU Bank Deleveraging 13
1.14. Reduction in Bank Assets: Sensitivity to Periphery Sovereign Spreads 13
2.1. Government Bond Yields and Volatility 27
2.2. Bank Holdings of Government Bonds in Spain and Italy 27
2.3. Sovereign–Bank Nexus for Italy and Spain 27
2.4. Portfolio Outows from Italy and Spain 27
2.5. Periphery Minus Core Bank Credit Default Swap Spreads 29
CONTENTS
vi International Monetary Fund | October 2012
2.6. Euro Area Bank Debt Issuance 29
2.7. Bank Deposit Flows in the Euro Area 29
2.8. Bank Customer Deposit Trends 30
2.9. Changes in the Sovereign Investor Base 30
2.10. Bank Credit to Domestic Governments and the Private Sector,
Selected Euro Area Countries 30
2.11. Change in Euro Area Bank Cross-Border Exposures 33
2.12. Change in Interest Rate on New Bank Loans 33
2.13. Pressure on Euro Area Banks 33
2.14. Total Deleveraging by Sample Banks 35
2.15. Total Deleveraging Due to Selected Stand-Alone Factors 35
2.16. Reduction in Supply of Credit to Euro Area: Core versus Periphery 35
2.17. Reduction in Credit Supply: Global Spillovers 37
2.18. Impact of EU Bank Deleveraging on GDP, 2013 Projection 37
2.19. Reduction in Credit Supply to Euro Area: Sensitivity to Periphery Sovereign
Spreads under Alternative Policy Scenarios 38
2.20. Bank Credit to Nonnancial Firms in Italy and Spain 38
2.21. Corporate Bond Issuance Needs through End-2013 under Alternative
Deleveraging Scenarios 38
2.22. Projected Average Interest Rates on Outstanding Sovereign Debt 39
2.23. Projected Sovereign Interest Expense as a Proportion of Revenue 39
2.24. Sovereign and Corporate Credit Ratings in the Euro Area Periphery 39
2.25. TARGET2 Projections 41
2.26. Borrowing from Central Banks 41
2.27. U.S. Five-Year Swap Rate and Implied Probability Distribution 42
2.28. Contributions to Change in Fitted 10-Year Nominal Treasury Yield 46
2.29. Private Sector Financial Balance Relative to Year before Outbreak of Financial Crisis,
Selected Advanced Economies 46
2.30. Change in 10-Year U.S. Treasury Yield in Recent Business Cycles 46
2.31. Bank Credit in Past and Current Credit Cycles 47
2.32. Market Reaction: Heightened Uncertainty and Policy 47
2.33. U.S. Government Debt and Interest Payments 47
2.34. Foreign Investors’ Share of Outstanding Sovereign Debt, as of End-2011 48
2.35. Rollover Risk: Weighted Average Maturity of Sovereign Bonds 48
2.36. Primary Dealers’ Positioning in U.S. Treasury Securities 48
2.37. Bank Holdings of Government Debt in Selected Advanced Economies 52
2.38. Sensitivity of Japanese Banks to a 100 Basis Point Interest Rate Shock 53
2.39. Cumulative Purchases of Japanese Government Bonds since 2007 53
2.40. Japanese Bank Holdings of Government Debt to 2017 under Current Trend 53
2.41. Foreign Claims of Japanese Banks 54
2.42. Foreign Holdings of Japanese Government Securities 54
2.43. Emerging Market Bond Fund Assets under Management, by Geographic Location 55
2.44. Resilience of Inows into Emerging Market Local-Currency Bond Funds
Despite Euro Area Stress 55
2.45. Performance of Emerging Market Equities and Bonds vs. Economic Surprise Index 56
2.46. Sensitivity of Selected Sovereign CDS to CDS of Euro Area Periphery, 2011–12 56
2.47. Net International Investment Position versus Gross External Debt, Selected
Economies, 2011 57
2.48. Share of Foreign-Currency-Denominated Bank Loans in Total Loans 57
2.49. Ratio of Nonperforming Loans to Total Loans 57
CONTENTS
International Monetary Fund | October 2012 vii
2.50. Change in Volatility of Local Bond Returns Relative to Foreign Participation
and Domestic Investor Base 58
2.51. Nonresident Holdings of Government Debt and Market Liquidity 58
2.52. Bank Holdings of Local Currency Government Debt and Additional Purchases
under Outow Scenario 60
2.53. Credit Cycle Position of Selected Economies: 2006 and 2011 61
2.54. Change in Private Sector Credit, 2006–11 61
2.55. Change in Real House Prices, 2006–11 62
2.56. Nonperforming Loans in Selected Economies, 2008, 2010, and 2011 62
2.57. Ratio of Price to Book Value of Banks in Selected Economies, 2010–12 62
3.1. Size of the Global Financial System 82
3.2. Market-Based Intermediation 98
3.3. Market-Based Intermediation: New Financial Products 99
3.4. Scope and Scale: Interconnectedness, Funding, Concentration 100
3.5. Globalization 102
3.6. Illustration of Dierence-in-Dierences Method 132
4.1. Time Varying Correlations: Financial Globalization Index 150
4.2. Time Varying Correlations: Financial Buers 151
4.3. Financial Structure and Economic Growth, 1998–2010 152
e Global Financial Stability Report (GFSR) assesses key risks facing the global nancial system. In normal
times, the report seeks to play a role in preventing crises by highlighting policies that may mitigate systemic
risks, thereby contributing to global nancial stability and the sustained economic growth of the IMF’s
member countries. Risks to nancial stability have increased since the April 2012 GFSR, as condence in the
global nancial system has become very fragile. Despite signicant and continuing eorts by European policy-
makers, the principal risk remains the euro area crisis. e current report highlights how risks have changed
over the past six months, traces the sources and channels of nancial distress with a focus on bank deleverag-
ing and euro area market fragmentation, examines progress on the reform agenda and whether the reforms are
contributing to a safer nancial system, and analyzes the relationship between nancial structures and eco-
nomic outcomes to determine if certain nancial systems are associated with higher or more stable growth.
e analysis in this report was coordinated by the Monetary and Capital Markets (MCM) Department
under the general direction of José Viñals, Financial Counsellor and Director. e project was directed by Jan
Brockmeijer and Robert Sheehy, both Deputy Directors; Peter Dattels and Laura Kodres, Assistant Directors;
and Matthew Jones, Advisor. It has beneted from comments and suggestions from the senior sta in the
MCM department.
Individual contributors to the report were Sergei Antoshin, Nicholas Arregui, Serkan Arslanalp, Sophia
Avramova, Adolfo Barajas, Ana Carvajal, Eugenio Cerutti, Su Hoong Chang, Ken Chikada, Nehad
Chowdhury, Kay Chung, Sean Craig, Era Dabla-Norris, Reinout De Bock, Martin Edmonds, Jennifer Elliott,
Michaela Erbenova, Ellen Gaston, Jeanne Gobat, Tom Gole, Kristian Hartelius, Sanjay Hazarika, Changchun
Hua, Anna Ilyina, Patrick Imam, Marcel Kasumovich, William Kerry, John Ki, Oksana Khadarina, Michael
Kleeman, Alexandre Kohlhas, Peter Lindner, Rebecca McCaughrin, Tommaso Mancini Grioli, André
Meier, Fabiana Melo, Paul Mills, Srobona Mitra, Gianni de Nicolò, S. Erik Oppers, Nada Oulidi, Evan
Papageorgiou, Jaume Puig, Lev Ratnovski, André Santos, Jochen Schmittmann, Katharine Seal, Stephen
Smith, Tao Sun, Jay Surti, Narayan Suryakumar, Takahiro Tsuda, Nico Valckx, Constant Verkoren, Chris
Walker, Rodolfo Wehrhahn, Christopher Wilson, Xiaoyong Wu, Mamoru Yanase, Lei Ye, Luisa Zanforlin, and
Jianping Zhou.
Ivailo Arsov, Martin Edmonds, Mehmet Gorpe, Mustafa Jamal, Oksana Khadarina, and Yoon Sook Kim
provided analytical support. Gerald Gloria, Nirmaleen Jayawardane, Juan Rigat, and Ramanjeet Singh were
responsible for word processing. Joanne Johnson of the External Relations Department edited the manuscript
and coordinated production of the publication, with assistance from Gregg Forte.
is issue of the GFSR draws, in part, on a series of discussions with banks, clearing organizations, securi-
ties rms, asset management companies, hedge funds, standards setters, nancial consultants, pension funds,
central banks, national treasuries, and academic researchers. e report reects information available up to
September 14, 2012.
e report beneted from comments and suggestions from sta in other IMF departments, as well as from
Executive Directors following their discussion of the GFSR on September 14, 2012. However, the analysis and
policy considerations are those of the contributing sta and should not be attributed to the Executive Direc-
tors, their national authorities, or the IMF.
PREFACE
International Monetary Fund | October 2012 ix
Conventions
x International Monetary Fund | October 2012
The following symbols have been used throughout this volume:
. . . to indicate that data are not available;
— to indicate that the figure is zero or less than half the final digit shown, or that the
item does not exist;
– between years or months (for example, 2008–09 or January–June) to indicate the
years or months covered, including the beginning and ending years or months;
/ between years (for example, 2008/09) to indicate a fiscal or financial year.
“Billion” means a thousand million; “trillion” means a thousand billion.
“Basis points” refer to hundredths of 1 percentage point (for example, 25 basis points is
equivalent to 1/4 of 1 percentage point).
“n.a.” means not applicable.
Minor discrepancies between constituent figures and totals are due to rounding.
As used in this volume the term “country” does not in all cases refer to a territorial entity
that is a state as understood by international law and practice. As used here, the term
also covers some territorial entities that are not states but for which statistical data are
maintained on a separate and independent basis.
The boundaries, colors, denominations, and other information shown on the maps do
not imply, on the part of the International Monetary Fund, any judgment on the legal
status of any territory or any endorsement or acceptance of such boundaries.
International Monetary Fund | October 2012 xi
EXECUTIVE SUMMARY
T
he analysis in this Global Financial
Stability Report (GFSR) shows that,
despite recent favorable developments in
nancial markets, risks to nancial stabil-
ity have increased since the April 2012 GFSR, as
condence in the global nancial system has become
very fragile. Although signicant new eorts by
European policymakers have allayed investors’ big-
gest fears, the euro area crisis remains the principal
source of concern. Tail-risk perceptions surrounding
currency redenomination have fueled a retrench-
ment of private nancial exposures to the euro area
periphery. e resulting capital ight and market
fragmentation undermine the very foundations of
the union: integrated markets and an eective com-
mon monetary policy.
e European Central Bank’s (ECB’s) exceptional
liquidity operations around the beginning of 2012
eased the pressure on banks to shed assets, but that
pressure rose again, accompanied by increasing mar-
ket fragmentation. Subsequently, the statement by
the president of the ECB in July, and measures pro-
posed by the ECB in September to increase liquid-
ity support and safeguard an appropriate monetary
policy transmission, have been essential in addressing
investors’ biggest fears and prompted another market
recovery. is GFSR updates work presented in
the April 2012 report to assess the impact of bank
deleveraging under three scenarios—baseline, weak,
and complete policies. We nd that delays in resolv-
ing the crisis have increased the expected amount
of asset shrinkage at banks. e largest burden of
projected credit supply contractions falls on the euro
area periphery, where the combined forces of bank
deleveraging and sovereign stress are generating very
strong headwinds for the corporate sector.
Where the April 2012 GFSR found the need for
euro area policymakers to build on improvements
and avoid fresh setbacks, this GFSR nds that
more speed is needed now. As detailed in Chapter
1, a leap to the complete policies scenario is neces-
sary to restore condence, reverse capital ight,
and reintegrate the euro zone. Key elements at the
national level include implementation of well-timed
and growth-friendly scal consolidation, structural
reforms to reduce external imbalances and promote
growth, and completion of the banking sector clean-
up, including further steps to recapitalize or restruc-
ture viable banks where necessary and to resolve
nonviable banks.
ese national eorts need to be supported at
the euro area level by sucient funding to banks
through the ECB’s liquidity framework. More
fundamentally, concrete progress toward establishing
a banking union in the euro area will help to break
the pernicious link between sovereigns and domes-
tic banks and help improve supervision. Over the
longer term, a successful banking union will require
sucient resource pooling to provide a credible scal
backstop to both the bank resolution authority and a
joint deposit insurance fund.
e unfolding euro area crisis has generated
safe-haven ows to other jurisdictions, notably the
United States and Japan. Although these ows have
pushed government funding costs to historic lows,
both countries continue to face signicant scal
challenges, as assessed in Chapter 2. In the United
States, the looming scal cli, the debt ceiling dead-
line, and the related uncertainty are the main imme-
diate risks. Unsustainable debt dynamics remain
the central medium-term concern. Japan faces high
decits and record debt levels, and interdependence
between banks and the sovereign is growing. In both
countries, necessary steps toward medium-term s-
cal adjustment need to be laid out without further
delay. e key lesson of the past few years is that
imbalances need to be addressed well before markets
start agging credit concerns.
Emerging market economies have adeptly navi-
gated through global shocks so far, but need to guard
against potential further shockwaves while manag-
ing a slowdown in growth that could raise domestic
EXECUTIVE SUMMARY
xii International Monetary Fund | October 2012
nancial stability risks. Local bond markets have
continued to attract inows even as the euro area
crisis intensied. Overall, many countries in central
and eastern Europe are the most vulnerable because
of their direct exposures to the euro area and certain
similarities they bear to countries in the euro area
periphery. Asia and Latin America generally appear
more resilient, but several key regional economies are
prone to the risks associated with being in the late
phase of a credit cycle that has featured an extended
period of rising property prices and debt. Mean-
while, the scope to provide fresh policy stimulus is
somewhat constrained in several economies, which
underscores the need to deftly manage country-
specic challenges.
e crisis has spurred a host of regulatory
reforms to make the nancial system safer. Chap-
ter 3 contains an interim report on whether these
reforms are moving the nancial sector in the right
direction against a benchmark set of desirable
features—nancial institutions and markets that are
more transparent, less complex, and less leveraged.
e analysis suggests that, although there has been
some progress over the past ve years, nancial sys-
tems have not come much closer to those desirable
features. ey are still overly complex, with strong
domestic interbank linkages, and concentrated,
with the too-important-to-fail issues unresolved.
While there has not yet been any serious setback to
nancial globalization, in the absence of appropriate
policies economies are still susceptible to harmful
cross-border spillovers. Progress has been limited
partly because many regulatory reforms are still
in the early stages of implementation and partly
because crisis intervention measures are still in use
by a number of economies, delaying the “reboot-
ing” of the nancial system onto a safer path.
Although the reforms currently under way are likely
to produce a safer banking system over time, the
chapter points to some areas that still require atten-
tion: (1)a global discussion of the pros and cons of
direct restrictions on business activities to address
the too-important-to-fail issue, (2) more attention
to segments of the nonbank system that may be
posing systemic risks, and (3) further progress on
recovery and resolution plans for large institutions,
especially those that operate across borders.
Chapter 4 tackles the fundamental question
of whether certain aspects of nancial structure
enhance economic outcomes. Are the forces cur-
rently changing nancial structures, including
regulatory reforms, likely to result in structures
that will support higher, less volatile growth and a
more stable nancial system? e chapter nds that
some structural features are indeed associated with
better outcomes and others with less growth and
more volatility. In particular, nancial buers (both
for capital and liquidity) tend to be associated with
better economic performance, whereas some types
of nontraditional bank intermediation are linked
to less favorable results. e analysis also indicates
that certain positive characteristics may sometimes
turn negative. For instance, some measures of
cross-border connections are benecial most of the
time, but if not managed properly they can act as
conduits to transmit destabilizing shocks during a
crisis. Overall, the analysis needs to be interpreted
carefully, since it is constrained by important gaps
in data and a relatively short sample period that
included the global nancial crisis. As a result, the
policy conclusions can only be viewed as tenta-
tive. Nonetheless, two of those that emerge are that
(1)nancial buers made up of high-quality capital
and truly liquid assets generally help economic per-
formance; and (2) banks’ global interconnectivity
needs to be managed well so as to reap the benets
of cross-border activities, while limiting adverse
spillovers during a crisis.
Both Chapters 3 and 4 also stress that the success
of steps aimed at producing a safer nancial system
hinges on eective implementation and strong
supervision. Without those elements, regulatory
reform may fail to secure greater nancial stability.
1
chapter
International Monetary Fund | October 2012 1
Risks to financial stability have increased since
the April 2012 Global Financial Stability Report
(GFSR), as confidence in the global financial
system has become very fragile (Figures 1.1 and
1.2). Despite significant and continuing efforts by
European policymakers, which have been essential in
addressing investors’ biggest fears, the principal risk
remains the euro area crisis. Incremental policy-
making has been insufficient to fully allay market
tensions, despite the recent market rally since end-
July. Imbalances in the United States and Japan are
amenable to medium-term adjustment, but clari-
fication now of necessary policy actions to be taken
over the medium term would sustain confidence and
preempt potential future market pressures. Emerg-
ing market economies have navigated well through
increased global risks, but if spillovers were to
intensify, rising domestic vulnerabilities and a reduc-
tion in policy space could pose increased challenges.
Status of Stability Indicators
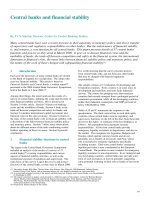
Since the April 2012 GFSR, markets have been
volatile, gyrating between extremes of disappoint-
ment and optimism (Figure 1.3). Condence in
policymaking has faltered, despite signicant and
continuing eorts by European policymakers. In
addition, rising political risks elsewhere have post-
poned medium-term adjustment. ese risks have
spilled over to broader global economic conditions.
Notwithstanding recent market improvements in
response to policy actions described below, condi-
tions remain fragile after a prolonged deterioration
in underlying trends. Flows into global bond funds
have jumped since the April 2012 GFSR, with
investors favoring safe-haven sovereign bonds and
investment-grade corporate bonds amid concerns
about tail risk outcomes (Figure 1.4).
e combination of lower risk appetite, a weak-
ened outlook for growth (see the October 2012
World Economic Outlook), and persistently volatile
and wide spreads in the euro area periphery has
led to an increase in macroeconomic risks. Emerging
market risks have also risen, as the prospects for these
economies appear increasingly linked to the global
cycle. In recent years, the resilience of emerging
market economies amid the high-risk global environ-
ment has been evident in persistent investor ows
seeking the relative safety of the sector’s xed-income
assets. However, a further escalation of euro area
stresses poses risks, especially for the countries in
central and eastern Europe. A slowdown in eco-
nomic activity heightens these risks, as some emerg-
ing market economies have only limited policy space
to provide countercyclical stimulus and safeguard
against external shocks.
Credit risks remain largely unchanged, albeit at
high levels, as the renewed deterioration in the
banking sector and growing deleveraging and credit
pressures in the euro area periphery have been oset
by some improvements in corporate and household
balance sheets in advanced economies. Within the
euro area, capital has continued to move out of the
periphery, both to the core and to countries out-
side of the euro area altogether, as ocial measures
to safeguard integration have so far proved insuf-
cient to oset strong private sector forces for
fragmentation.
A further deterioration in the euro area crisis is
the biggest risk to global nancial stability, but rising
imbalances elsewhere are also a cause for concern.
Safe-haven inows to Japan have compressed govern-
GLOBAL FINANCIAL STABILITY ASSESSMENT
Note: is chapter was written by Peter Dattels and Matthew
Jones (team leaders), Sergei Antoshin, Serkan Arslanalp, Eugenio
Cerutti, Julian Chow, Nehad Chowdhury, Kay Chung, Sean
Craig, Reinout De Bock, Martin Edmonds, Michaela Erbenova,
Jeanne Gobat, Mehmet Gorpe, Kristian Hartelius, Sanjay
Hazarika, Changchun Hua, Anna Ilyina, Patrick Imam, Marcel
Kasumovich, William Kerry, Alexandre Kohlhas, Rebecca
McCaughrin, Tommaso Mancini Grioli, Peter Lindner, André
Meier, Paul Mills, Nada Oulidi, Evan Papageorgiou, Jaume Puig,
Jochen Schmittmann, Katharine Seal, Stephen Smith, Narayan
Suryakumar, Takahiro Tsuda, Constant Verkoren, Chris Walker,
Christopher Wilson, Lei Ye, and Jianping Zhou.
GLOBAL FINANCIAL STABILITY REPORT
2 International Monetary Fund | October 2012
ment bond yields to near-record lows despite a more
challenging sovereign debt load and a strengthening
sovereign-bank nexus. While these imbalances are
mostly a medium-term issue of scal adjustment,
derivatives markets are pricing in risks of rising
interest rates and currency volatility (Box 1.1).
For the United States, safe-haven ows, central
bank purchases, and balance sheet de-risking have
also contributed to an unprecedented compression
of credit risk premiums and yields. e looming
debt ceiling, scal cli, and related uncertainty are
the main immediate risks, while unsustainable debt
dynamics remain the key medium-term concern.
If compressed credit spreads rise in a disorderly or
rapid manner, longer-term scal risks could pose
increasing stability challenges for the United States
and the global nancial system. Markets are not
pricing in such an outcome (see Box 1.1), suggest-
ing a degree of complacency, as reected in extended
long positions in Treasury bills across broad investor
classes, in which interest rate risk, given near-zero
policy levels, is essentially all one way. Meanwhile,
U.S. banks face structural challenges related to
changes in their business models.
Monetary authorities have reacted to the elevated
risks of nancial instability and tighter credit condi-
tions by maintaining a supportive policy stance,
thus keeping overall monetary and nancial condi-
tions broadly accommodative. e European Central
Bank’s (ECB’s) three-year LTROs (longer-term
renancing operations) eased bank funding strains
and slowed the pace of deleveraging in the euro area
in the rst quarter. Lending conditions stabilized
but then began to deteriorate again toward the end
of the second quarter as the divergence between the
euro area core and periphery continued to grow.
However, a broad-based commitment from the
ECB, beginning with a statement by ECB President
Mario Draghi at the end of July to do “whatever
it takes” to preserve the euro, and followed by the
introduction in September of a program of Outright
Monetary Transactions (OMT) to provide liquidity
to sovereign debt markets in the euro area periphery,
helped to reduce tensions and boost market recovery.
October2012GFSR
April2012GFSR
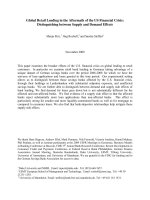
Figure 1.1. Global Financial Stability Map
Credit
risks
Market and
liquidity risks
Risk
appetite
Monetary and
nancial
Macroeconomic
risks
Emerging market
risks
Conditions
Risks
Source: IMF staff estimates.
Note: Away from center signifies higher risks, easier monetary and financial conditions, or higher risk appetite.
CHAPTER 1 GLOBAL FINANCIAL STABILITY ASSESSMENT
International Monetary Fund | October 2012 3
Source: IMF staff estimates.
Note: Changes in risk and conditions are based on a range of indicators, complemented with IMF staff judgment; see Annex 1.1. in the April 2010 GFSR and Dattels and others (2010)
for a description of the methodology underlying the Global Financial Stability Map. Numbers in parentheses denote the number of individual indicators within each subcategory of risks
and conditions. The “overall” notch change in each panel is the simple average of notch changes in individual indicators in that panel. In the panel on monetary and financial conditions,
a positive value for lending conditions represents slower pace of tightening or faster easing, and QE = quantitative easing.
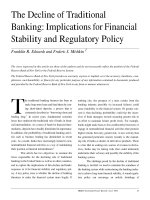
Figure1.2.GlobalFinancialStabilityMap:AssessmentofRisksandConditions
(InnotchchangessincetheApril 2012 GFSR)
Riskappetitecontracted across all measures, reversing the improvement in the beginning
of the year.
Easing liquidity strains helpedmarketandliquidityrisks remain steady despite bearish
market positioning.
Macroeconomicrisksincreased due to deterioration in economic activity indicators.
Lending conditions stabilized and nancial conditions deteriorated, leaving overall
monetaryandnancialconditionsunchanged.
Credit risks remained at elevated levels, as improvements in nonnancial sectors were
oset by banking strains.
Emerging market risks increased as leading markets were increasingly aected by the global
cycle.
–4
–3
–2
–1
0
1
2
3
4
Overall (6) Sovereign credit
(1)
Ination
variability(1)
Economic
activity(4)
Morerisk
Lessrisk
–4
–3
–2
–1
0
1
2
3
4
Overall (7) Liquidity&
funding(1)
Volatility (2) Market
positioning
(3)
Equity
valuations
(1)
Morerisk
Lessrisk
Unchanged
–4
–3
–2
–1
0
1
2
3
4
Overall(5) Sovereign(2)Ination(1) Corporate
sector(1)
Liquidity(1)
Lessrisk
Morerisk
–4
–3
–2
–1
0
1
2
3
4
Overall(8) Bankingsector
(3)
Household
sector(2)
Corporatesector
(3)
Morerisk
Lessrisk
Unchanged
–4
–3
–2
–1
0
1
2
3
4
Overall(4) Institutional
allocations
(1)
Investor
surveys(1)
Relative
assetreturns
(1)
Emerging
markets(1)
Lowerriskappetite
Higherriskappetite
–4
–3
–2
–1
0
1
2
3
4
Overall(6) Monetary
conditions(3)
Financial
conditions(1)
Lending
conditions(1)
QE¢ral
bankbalance
sheet
expansion (1)
Tighter
Easier
Unchanged
GLOBAL FINANCIAL STABILITY REPORT
4 International Monetary Fund | October 2012
In response to the weakening outlook in the United
States and persistent high unemployment, the Fed-
eral Reserve launched a new round of quantitative
easing (“QE3”) in September. Also in September,
the Bank of Japan, responding to weakened external
growth prospects and persistent domestic dea-
tion, enhanced monetary easing by increasing the
size of its Asset Purchase Program. Together, these
central bank actions boosted prices of risk assets and
bank equities, while narrowing sovereign peripheral
spreads in the recent period.
is GFSR welcomes the important steps taken
by the European authorities and encourages strong
implementation of announced policies along with
further steps outlined in the complete policies scenario
below that could act as a turning point in the crisis
toward durable stability (see Box 1.2).
e rest of this chapter focuses on critical global
stability risks and policy challenges. Chapter 2
assesses these nancial risks in the sovereign, bank-
ing, and corporate sectors across regions of the
world.
The Euro Area
The deepening euro area crisis has driven a
wedge between the periphery and the core.
e euro area crisis has moved from a sudden stop
into a capital-ight phase despite substantial policy
interventions, as cross-border private capital is being
repatriated from the periphery back to the core of
the currency union (Figure 1.5). Since domestic cur-
rency depreciation is impossible within the mon-
etary union, higher risks have translated into rising
credit spreads on the periphery’s sovereign and bank
borrowers, particularly in Spain and Italy (Figure
1.6). As nancial integration unwinds rapidly in
this internal capital account crisis, the private capital
leaving the periphery has been mostly replaced by
large public sector ows, principally across central
bank balance sheets (Figure 1.7).
Yet despite the signicant public resources being
deployed to the periphery, private sector condence
has remained low. Concerns over a possible euro area
breakup have led to extreme fragmentation between
funding markets in the core and the periphery (Figure
1.8). e announcement of the OMT program in
early September has helped address such concerns
and reduce sovereign spreads between the periphery
and the core. However, periphery bank and corporate
spreads have narrowed less, which may act as a brake
on recovery. Banks, insurers, and nonnancial corpo-
rations are trying to match assets, liabilities, and col-
lateral in each country of the periphery as protection
against redenomination risk. In turn, liquidity in core
economy banks is not being recycled to the periphery
but is instead being deposited at core central banks or
in relatively safe government bonds.
Following a brief pause aorded by the ECB’s
LTROs, deleveraging pressures on periphery banks
–80
–60
–40
80
60
40
–20
20
0
Sources: Bank of America Merrill Lynch; Bloomberg L.P.; and IMF staff estimates.
1
Spreads are over bunds, inverted.
Figure 1.3. Asset Price Performance since April 2012 GFSR
(Percentchange)
Europe
Treasuries
Irishsovereignspread
Spanishbankequities
High-gradebonds
High-yield bonds
Equities
Governmentbonds
Sovereignlocalbonds
Corporatedollarbonds
Sovereigndollarbonds
High-gradebonds
Equities
Italiansovereignspread
Italianbankequities
Spanishsovereignspread
Italianequities
High-gradebonds
Eurorst300
Irishbankequities
Germanbunds
High-yield bonds
Portuguesesovereignspread
Spanishequities
S&P500
Europeanbanks
Periphery
Europe
1
Japan Emerging
markets
United
States
Change since April 2012 GFSR
April GFSR to July 25
July 25 to October 2012 GFSR
–800
–600
–400
–200
200
0
400
600
800
1,000
2007 1211100908
Globalbonds
Advancedeconomyequities
Emergingmarketequities
Lehman
LTROs
announcement
Japan
earthquake
Greece
bailout
Source: EPFR Global.
Note: LTROs = longer-term refinancing operations.
Figure1.4.CumulativeFlowsto GlobalMutualFunds
(InbillionsofU.S.dollars)
CHAPTER 1 GLOBAL FINANCIAL STABILITY ASSESSMENT
International Monetary Fund | October 2012 5
–12
–10
–8
–6
–4
–2
0
2
4
6
8
Jan-10 Apr-10 Jul-10 Oct-10 Jan-11 Apr-11 Jul-11 Oct-11 Jan-12
Core
Periphery
Sources: Haver Analytics; and IMF staff estimates.
Note: To estimate the autonomous, private-sector-driven component of total flows,
flows are calculated as the sum of net portfolio and other investment flows, excluding
changes in TARGET2 balances at the central bank. Core = Belgium, France, Germany, and
the Netherlands; periphery = Greece, Ireland, Italy, Portugal, and Spain.
Figure1.5.PortfolioandOtherInvestmentCapitalFlowsin
theEuroArea,ExcludingCentralBanks
(CumulativefromDecember2009,inpercentofGDPin
precedingyear)
Capital ight from the periphery to the core…
3
4
5
6
7
Spain(foreignshare)
Italy(foreignshare)
Spainyield(rightscale)
Italyyield(rightscale)
0
10
1997
1998
1999
2000
2001
2002
2003
2004
2005
2006
2007
2008
2009
Jan-10
Apr-10
Jul-10
Oct-10
Jan-11
Apr-11
Jul-11
Oct-11
Jan-12
Apr-12
Jul-12
20
30
40
50
60
Introduction
ofeuro
Source: Bloomberg L.P.
Note: Share of nonresident investors in total debt stock, and generic yield of 10‐year
government bond. Yields are 3-month moving averages.
Figure1.6.SpainandItaly:ChangesinForeignInvestor
SharesandYields
(Inpercent)
…is widening sovereign spreads as foreign holdings of
periphery debt fall…
Banking
sector
Public
sector
0
500
1,000
1,500
2,000
2,500
ECBborrowing
Borrowing
from
privatebanks
EFSF/EFSM
SMP
ECBborrowing
Borrowing
from
privatebanks
Sources: Bank for International Settlements (BIS); Bloomberg L.P.; European Financial
Stability Fund; Haver Analytics; national central banks; and IMF staff estimates.
Note: Current exposures of the rest of the euro area to the periphery (Greece, Ireland,
Italy, Portugal, and Spain) amount to €2.2 trillion; including cross‐border lending by euro
area banks reporting to the BIS on an ultimate risk basis (end‐March 2012); periphery
banks' borrowing from the Eurosystem, excluding emergency liquidity assistance; ECB
purchases of periphery government bonds through its SMP; and EFSF and EFSM
contributions to programs with Greece, Ireland, Portugal, and Spain. ECB = European
Central Bank; EFSF = European Financial Stability Facility; EFSM = European Financial
Stabilisation Mechanism; SMP = Securities Market Programme.
Figure1.7.EuroAreaExposurestoGreece,Ireland,Italy,
Portugal,andSpain
(Inbillionsofeuros)
Dec-09 Current
…and private borrowing is being replaced by public sector
ows…
0
100
200
300
400
500
Jan-11 Apr-11 Jul-11 Oct-11 Jan-12 Apr-12 Jul-12
Sovereigns
Banks
Nonnancial rms
Growingdivergence
betweenperiphery
andcore
Sources: Bloomberg L.P.; Thomson Reuters Datastream; and IMF staff estimates.
Note: Data for sovereigns are weighted by GDP; for banks, by assets; and for
nonfinancial firms, by outstanding bonds. Corporate spreads are calculated via
option-adjusted bond spreads. Core = Austria, Belgium, Finland, Germany, and the
Netherlands; periphery = Greece, Ireland, Italy, Portugal, and Spain.
Figure1.8.PeripheryMinusCore CreditDefaultSwap
Spreads
(Inbasispoints)
…resulting in a growing divergence in periphery-core
funding costs and spreads…
GLOBAL FINANCIAL STABILITY REPORT
6 International Monetary Fund | October 2012
have increased amid a sharp economic downturn,
worsening funding conditions for both banks and
sovereigns, and nancial fragmentation within the
euro area (see Box 2.3). e corporate sector could
quickly become an additional force in this perni-
cious feedback loop, as downgrades of sovereign
ratings threaten to drag investment-grade corporate
debt down to the subinvestment-grade level. It is too
early to tell whether the ECB’s OMT program will
relieve deleveraging pressures, as further measures at
the national level are likely to be needed, as dis-
cussed below.
Restoring stability to reverse financial frag-
mentation within the monetary union
remains the key policy challenge.
Restoring condence among private investors is
paramount for the stabilization of the euro area.
Euro area policymakers are laying foundations to
support that condence, but numerous technical,
legal, and political challenges remain. e urgency
of the task is also increasing, as the fragmentation of
funding markets remains intense despite the recent
market rally, posing a risk of further damage to the
Investors are increasingly buying protection against
extreme risks, even if investing in the instruments
designed to provide the protection can be costly and may
prove ineective. Evaluating extreme risks can inform
policymakers on threats to nancial stability, by region,
timing, and the structure of the protection. In Europe,
markets point to some risk of currency redenomination.
Reecting medium-term scal challenges, markets are
pricing in some upside risk to Japan’s low interest rates.
In contrast, U.S. markets are sanguine over both near-
and medium-term risks from macro imbalances.
Rising Demand for Insurance against Global Tail
Risks
e realization of extreme risk in 2008 led to a
material alteration in investment strategies: strong
demand for insurance against tail outcomes (the risk
of low-probability but high-impact events). is
demand has been relatively price insensitive in the
recent past, indicative of a lasting structural shift in
investment strategies. New instruments have emerged
to satisfy investor demand, the most notable aimed
at exploiting the inverse correlation between equity
prices and the expected volatility of equity markets.
e S&P Volatility Index is an indicator of market
expectations of future volatility and is widely used as
a measure of global risk aversion. In January 2009,
in the midst of the steep decline in global equity
values, an instrument that tracks market expectations
of volatility was introduced—the VXX. e demand
for such products has surged, and they now account
for a signicant share of the equity options market.
1
Demand is also strong despite poor performance (the
VXX is down 60 percent on an average annualized
basis), indicative of investor focus on extreme risks.
Global tail risks may emanate from one or more
sources, such as the euro area crisis or U.S. and
Japanese scal imbalances. Evaluating the source of
specic risks provides policymakers with a guide to
areas of potential instability discussed below.
Euro Area Risks: Currency Redenomination Risk
Risks in the euro area are dominated by balance of
payments imbalances across member states. Creditor
countries are repatriating capital from debtor nations
even when the cost of doing so is high, as demon-
strated by negative nominal shorter-term interest
rates in various countries (Figure 1.1.1). Investors are
willing to accept negative interest rates as the cost of
guarding against a euro breakup and the introduc-
tion of national or subregional currencies (currency
redenomination risk). Creditor countries expect to see
their currencies appreciate substantially, more than
osetting the negative interest rate.
Redenomination risks can be evaluated against
Denmark, a country with a long-standing currency peg
to the German mark and now the euro. Figure 1.1.2
estimates the probability of the Danish kroner breaking
the strong side of the European Exchange Rate Mecha-
nism (ERM-II) peg to the euro in one year’s time
1
Instruments such as the VXX and other volatility-based
products are roughly 40 percent of listed S&P 500 options.
Box 1.1. Falling Condence, Rising Risks, and Complacency
Note: Prepared by Marcel Kasumovich and Narayan
Suryakumar.
CHAPTER 1 GLOBAL FINANCIAL STABILITY ASSESSMENT
International Monetary Fund | October 2012 7
from market prices, which has been rising and falling
alongside strains in the euro area. is can be viewed
as a proxy for the expectation that a stronger, northern
euro bloc will emerge from the crisis where the Danish
kroner peg is reset to the stronger-currency countries
and appreciates against the weak-currency ones.
Longer-Term Risks Emerging in Japan
Japan’s imbalances are unique in the context of
history: very high government debt yet a very large
external creditor position. e resolution of these
imbalances could have signicant implications for
both interest rates and exchange rates. e natural
expectation leans to a signicant increase in bond
yields. Interest rate markets do indeed reect the
potential for higher yields in the medium term.
e implications for foreign exchange markets are
more complex. As seen during the March 2011 nat-
ural disaster in Japan, rapid currency appreciation
may occur given the potential for the repatriation of
foreign assets. Alternatively, the threat of an erosion
of condence in domestic policy, or, over the longer
run, of a deterioration in the current account, might
cause substantial depreciation. e market has
resolved these two competing forces by anticipating
a very high level of medium-term volatility in the
dollar-yen exchange rate (as shown in Figures 1.1.3
and1.1.4), well above realized volatility and high
relative to past crises.
U.S. Risks: Complacency or Confidence?
e United States has a blend of the imbalances
seen in the other major countries. U.S. government
debt is high, though not as high as in Japan. e
United States is an international net debtor, though
not to the same extent as Spain and other countries
in the euro area periphery. Nevertheless, markets have
a benign expectation for the resolution of U.S. imbal-
ances. Evidence of extreme risks in interest rate and
currency markets is absent at virtually all horizons.
While the capacity of the U.S. government to
repay its debt is not in doubt, continued growth
in macro imbalances would raise the likelihood of
a misalignment of policy incentives across inter-
nal and external creditors. If the expansion of the
Federal Reserve balance sheet is the last-resort policy
that prevents a large rise in bond yields, the clearest
transmission mechanism is currency depreciation.
Medium-term expectations have been, instead, lean-
ing toward a U.S. dollar appreciation (Figure 1.1.5).
In the near term, the U.S. sovereign credit default
swap curve suggests that the debt ceiling, as well as
the scal cli, will be resolved without issue (Figure
1.1.6). Uncertainty about a potential technical
default as a result of the debt ceiling led to credit
risk in short-term default swaps rising above those
over longer horizons in July 2011. No such pattern
has emerged this time around. In the longer term,
Box 1.1 (continued)
–0.5
0.5
1.5
2.5
3.5
4.5
5.5
6.5
7.5
8.5
Creditorcountries
Debtorcountries
Figure1.1.1.Two‐YearYieldsofCreditorandDebtor
CountriesinEurope
(Percent)
Safe-haven ows have driven rates for creditor countries into
negative territory…
Source: Bloomberg L.P.
Note: Yields are weighted by nominal GDP. Creditor countries = Austria, Denmark,
Finland, Germany, the Netherlands, and Switzerland. Debtor countries = Ireland, Italy,
Portugal, and Spain.
Jan‐2010 Jan‐2011 Jan‐2012
0
5
10
15
20
25
30
Jan-10 Jul-10 Jan-11 Jul-11 Jan-12 Jul-12
Probability(percent,leftscale)
Spot rate
(invertedERM‐II ±2.25%range,rightscale)
Figure1.1.2.ProbabilityoftheDanishKronerBreaking
theERM‐II
…while currency markets reect euro redenomination risks.
Sources: Bloomberg L.P.; and IMF staff estimates.
Note: ERM-II = European Exchange Rate Mechanism. The probability of
breaking the strong side of the ERM-II boundary is estimated from the one-year
euro-Danish kroner forward and volatility from option markets.
7.28
7.32
7.36
7.40
7.44
7.48
7.52
7.56
7.60
Draghi and OMTstatement
Greece
program
GLOBAL FINANCIAL STABILITY REPORT
8 International Monetary Fund | October 2012
option markets are pricing far less fear of a rise in
longer-term interest rates compared with Japan (as
shown in Figure 1.1.4).
Financial Stability Implications
Evaluating extreme risks supports nancial stabil-
ity in three important ways. First, policymakers can
disagree with the market assessment and provide
targeted, logical foundations to the contrary both
when there is too much and, importantly, too little
concern about future imbalances. Second, under-
standing strategies that attempt to insure against
extreme risks can reveal potential vulnerabilities in
the nancial system. Seemingly eective hedges, such
as long-term euro interest rate swaps, could further
concentrate counterparty exposures, exacerbating risks
when extreme events occur. ird, changes in invest-
ment strategies lead to nancial innovation. New
products, particularly fast-growing ones where risk
diversication is likely to lag innovation, could lead
to risks simply being transferred and concentrated,
and therefore should be closely monitored.
Box 1.1 (continued)
0.0
0.5
1.0
1.5
2.0
2.5
3.0
3.5
4.0
4.5
5.0
1.000.800.600.400.200.00–0.20–0.40–0.60–0.80–1.00
Increaseddownside
forU.S.dollar
Increasedupside
forU.S.dollar
2012
2008
Figure1.1.5.Index Measure of U.S.Dollar
Appreciation‐DepreciationBias
(Trade‐weighteddollarriskreversalindex)
Medium-term expectations have been biased toward further
U.S. dollar appreciation despite macroeconomic imbalances…
Sources: Bloomberg L.P.; and IMF staff estimates.
Note: Trade-weighted dollar risk reversal index is constructed using 5-year option
risk reversals on the euro, yen, and British pound, indexed to a medium-term mean,
reflecting investors' bias toward appreciation or depreciation. Data for 2012 are
through August 31.
–40
–20
0
20
40
60
80
100
May-11 Jan-12Nov-11Sep-11Jul-11 May-12Mar-12 Sep-12Jul-12
Figure1.1.6.U.S. CreditDefaultSwapSpreadsandSlope
(Basispoints)
Sources: Bloomberg L.P.; and IMF staff estimates.
10-year minus 1-yearslope
10-year
1-year
…while markets are sanguine about the near-term U.S. scal
cli and debt ceiling risks.
–20
0
20
40
60
80
100
Jan-2009 Jan-2010 Jan-2011 Jan-2012
Figure1.1.4.RelativeOption Premiumson Long‐Term
Interest Rates
(Inbasispoints,notionalswaptionvalue)
…and risk of higher interest rates in the medium-term in
Japan but not in the United States.
Sources: Bloomberg L.P.; and IMF staff estimates.
Note: A 10-year by 10-year swaption is a 10-year call or put option on a 10-year
interest rate swap agreement. The option premium differential depicted here indicates
the relative demand for insurance against the possibility that future interest rates will
be higher than expected.
Japan: 10-year x
10-year swaption
United States:
10-year x 10-year swaption
Risinginterest
rateexpectations
2008 2009 2010 2011 2012
Figure1.1.3.Short‐andMedium‐TermExpectationsof
theYen Exchange Rate Volatility
(Annualizedpercent)
Markets are pricing in higher yen exchange rate volatility in
the medium term…
Source: Bloomberg L.P.
Note: The medium term is derived from the difference between the 5‐year and
10‐year implied volatility in the yen versus the U.S. dollar and the euro. The short
term is the historical 3‐month volatility.
0
5
10
15
20
25
30
Mediumterm
Shortterm
CHAPTER 1 GLOBAL FINANCIAL STABILITY ASSESSMENT
International Monetary Fund | October 2012 9
Since the April 2012 GFSR, European policy-
makers have announced further important policy
measures aimed at reversing the fragmentation of
euro area nancial markets and strengthening the
architecture underpinning the Economic and Mon-
etary Union (EMU). To ensure maximum eective-
ness, these measures will need to be followed by
implementation at the national level, with further
steps taken toward more complete integration.
June 29 European Union Summit
In addition to agreeing on up to €120 billion in
European Union (EU) growth-enhancing initiatives,
euro area leaders promoted measures to address the
sovereign-banking nexus. ese included removing
the seniority of the European Stability Mechanism
(ESM) loan to recapitalize Spanish banks once the
European Financial Stability Facility (EFSF) loan
rolls over; opening the possibility for the ESM to
directly recapitalize Spanish banks once the single
supervisory mechanism is in place; and restating the
commitment to use EFSF/ESM interventions to
stabilize secondary sovereign bond markets. Bond
spreads in the euro area periphery narrowed sharply
in the aftermath of the summit in the belief that
these steps constituted a signicant step toward
spreading the liability for future bank rescues across
the euro area.
German Constitutional Court
In a preliminary ruling on September 12, 2012,
the German Constitutional Court stated that the
ESM and the Fiscal Pact were consistent with the
German Constitution, paving the way for Ger-
many to ratify the ESM Treaty. e Court attached
the condition that Germany’s commitment to the
ESM is capped at the currently planned €190 bil-
lion unless the lower house of parliament decides
to approve additional funds. e court also ruled
that both houses of parliament must be informed
about ESM decisions and that granting it a banking
license would be incompatible with primary EU
law.
ECB’s Outright Monetary Transactions
Following its policy meeting on September 6,
the European Central Bank (ECB) announced its
Outright Monetary Transactions (OMTs) program
as a replacement for the Securities Market Pro-
gramme (SMP).
1
e ECB will consider OMTs for
countries under a macroeconomic adjustment or
precautionary program with the EFSF/ESM, which
should help to ensure that low policy rates transmit
to borrowing costs in countries in the periphery
with a program. In addition, it relaxed its collateral
framework for sovereigns in an OMT program and
for foreign currency collateral. OMTs are likely to
be more eective than the SMP in slowing and
reversing capital ight from the periphery due to:
• Greater credibility. By explicitly targeting interven-
tion to address convertibility risk and the broken
transmission mechanism, and by tying inter-
vention to conditionality and shorter maturity
bonds, the ECB gained near-universal acceptance
that it is acting well within its mandate.
• Operational lessons learned. OMTs will not dilute
existing bondholders by taking a senior position
in the sovereign’s capital structure, thereby lessen-
ing investors’ incentive to sell as the ECB buys.
Additional transparency will enable investors to
assess the ECB’s position in, and commitment to,
OMT country bonds.
• Easing of periphery bank liquidity and capital
concerns. An OMT program is likely to encourage
domestic banks to continue to participate in sov-
ereign primary bond markets as the ECB will act
as a backstop buyer of one- to three-year bonds.
The OMT announcement reopened the primary
market for unsecured debt of periphery banks—if
sustained, this will reduce liquidity concerns for
banks.
1
OMT features include (1) conditionality: the assisted sov-
ereign signs up for an ESM/EFSF program or precautionary
credit line; (2) mode of intervention: unlimited, fully steril-
ized, short-dated (one to three years) ECB bond purchases in
the secondary market with no formal yield target; (3) ranking
of claim: pari passu ranking with other bondholders for
OMT purchases of sovereign bonds; (4) transparency: OMT
holdings and their market values to be published weekly and
the average duration and country breakdown to be published
monthly; and (5) collateral policy: minimum credit rating
requirements for sovereign-issued collateral used for ECB
liquidity operations are to be suspended for sovereigns eligible
for the OMT program.
Box 1.2. Recent Policy Initiatives, Developments, and Challenges in the Euro Area
GLOBAL FINANCIAL STABILITY REPORT
10 International Monetary Fund | October 2012
nancial system and the real economy. is report
explores these policy challenges by updating and
extending the euro area scenarios for baseline policies,
weak policies, and complete policies introduced in the
April 2012 GFSR.
1
Developed in detail in Chapter
2, these updated scenarios are briey summarized
below. Owing to mounting pressures on periphery
banks since the April 2012 GFSR, the degree of
1
In the April 2012 GFSR, the baseline policies scenario was
called the current policies scenario.
deleveraging stress under all three scenarios is now
higher than it was in that report, rising to $2.8tril-
lion under the baseline policies scenario, or as high
as $4.5trillion under the weak policies scenario
(Figure1.9).
• The WEO/GFSR baseline policies scenario
assumes a gradual restoration of confidence
based on additional policy actions that demon-
strate political commitment to closer integra-
tion. Specifically, it assumes that policymakers
establish a single supervisory mechanism on
• Potential reduction in sovereign bond volatility. A
credible OMT program, with potential backup
support from the ESM in the primary market,
should help anchor sovereign yields at the short
end, encourage domestic banks to participate at
longer maturities, and reduce volatility, thereby
attracting external investors back.
e ECB’s actions have eliminated a number
of the potential “bad equilibria” arising from fears
that a periphery sovereign and its banks will face
an extreme liquidity crisis. By addressing many
of the operational defects of the SMP and being
more clearly within the ECB’s mandate, the OMT
program has greater credibility and is likely to be
deployed with less hesitancy. However, the OMT
program still faces signicant political and imple-
mentation risks. Governments now need to ask for
support under the EFSF/ESM, agree on condi-
tionality, and implement reforms. Furthermore,
steps need to be taken to put in place the other
elements of the complete policies scenario—notably,
moves toward greater scal integration, credible
bank recapitalization and resolution, and a banking
union. e OMT program does not give categorical
assurance that debt sustainability will be restored
given the uncertain impact of conditionality.
Banking Union
On September 12, the European Commission
published its proposals for banking union within
the euro area. ese envisage rapid implementation
of a Single Supervisory Mechanism (SSM) by Janu-
ary 2013, with the ECB empowered to act from
that point on, taking over supervision for systemi-
cally important nancial institutions in July 2013
and all banks from January 2014. EU countries
outside the euro area can opt into “close coopera-
tion” with the ECB, which will then issue guidelines
and requests to these authorities and their banks.
e European Commission envisaged adoption, by
end-2012, of EU legislation harmonizing national
prudential regulations, bank resolution, and deposit
insurance, and steps toward a single bank recovery
and resolution framework. It also proposed that the
European Banking Authority’s powers of “binding
mediation” over national authorities be extended to
the ECB.
Numerous issues with this ambitious plan now
need to be resolved and agreed upon. ese include
the boundary of responsibility and delegation
between the ECB and national supervisors, the
balance between euro area and other EU regulators,
the future of macroprudential policymaking across
the EU, and the optimum timetable for implemen-
tation. Furthermore, these proposals, while impor-
tant, are only preliminary steps in the creation of
a full “banking union” with the aim of weakening
the nexus between a sovereign and its banks. is
will require, in particular, adequate pan-euro area
backstops for deposit insurance and bank resolution,
and a bank resolution mechanism. Without these,
the cost of banks’ capital will still be linked to their
home country, while a sovereign’s creditworthiness
will remain tied to that of its banks.
Box 1.2 (continued)
CHAPTER 1 GLOBAL FINANCIAL STABILITY ASSESSMENT
International Monetary Fund | October 2012 11
the current timetable and contain pressures on
spreads, including potentially through the ECB’s
OMT program, and policymakers in periphery
economies follow through with their adjustment
programs. Under this scenario, policy credibility
and confidence improves gradually, while capital
flight from the periphery to the core slows. Activ-
ity would continue to contract in the periphery
from still-elevated funding costs, while the core
would see only very sluggish growth.
• Unless the policy actions under the baseline
are taken, the euro area is likely to slide into
a weak policies scenario. This scenario envis-
ages current commitments remaining unful-
filled as the periphery’s political resistance to
reform grows, or support from the core wanes,
or both. Strains in the euro area deepen as the
forces of fragmentation increase and become
entrenched (Box1.3). Potential financing gaps
widen, the degree of fragmentation and financial
repression increases, capital holes in banking
systems expand, and the increasing intra-euro
area capital account crisis spills outward. These
developments pose a far-reaching threat to the
global financial system and the global economic
outlook.
• To avoid rising economic and financial costs seen
under the baseline scenario, the complete policies
scenario envisages that euro area policymak-
ers advance timetables for actions assumed in
the baseline scenario. In addition, they present
a clear roadmap to a banking union and fiscal
integration and deliver a major down payment
toward those goals. Examples might include
putting in place a euro area deposit guarantee
scheme and bank resolution mechanism with
common backstops, or concrete measures toward
fiscal integration, as anticipated in the “Four
Presidents” report submitted to the euro area
summit (European Council, 2012). Under this
scenario, the euro area begins to reintegrate
financially as policy credibility is restored and
capital flight reverses. Funding costs in the
periphery and core normalize by the end of
2013, credit channels reopen as banking strains
dissipate, and economic growth returns to the
periphery and picks up in the core.
Chapter 2 uses these scenarios to demonstrate
that unless additional policy measures are taken
swiftly to achieve the complete policies scenario,
condence will not be sustainably restored, and
the result will be higher levels of deleveraging
(Figure 1.9), a greater reduction in credit supply
(Figure 1.10), leading to a sharp contraction in
investment (Figure1.11), a cut back in employ-
ment (Figure 1.12), and a steeper drop in output
(Figure1.13). e longer the crisis continues, the
greater will be the public sector costs of its ultimate
resolution—because of the transfer of rising credit
exposures from the private sector to monetary and
scal authorities—and the more dicult it will be
to reintegrate the periphery with the core. Merely
muddling through also imposes increasingly higher
costs, as the unchecked forces of fragmentation
continue to gather speed and undermine the very
foundations of the union—a common monetary
policy, and economic and nancial integration
within the single market. e existing strains in
the markets require a leap to better policies if the
euro area is to stabilize funding markets and reduce
spreads, arrest capital ight, and begin to reinte-
grate nancially (Figure1.14).
What is needed to achieve the complete
policies scenario?
e complete policies scenario requires, rst, regain-
ing credibility through an uninching commitment
to implement already adopted measures. at credi-
bility supplies the platform on which further actions,
taken at both the national and euro area levels, can
stabilize the current situation and facilitate a rapid
move toward a more integrated union.
At the national level, the rst priority is to stabi-
lize fragile balance sheets and address high burdens
of legacy debt. Policymakers also need to build
political support for the necessary pooling of sover-
eignty that a more complete currency union entails.
Sovereigns and banks need to be made safer:
• For sovereigns, the top priority remains the con-
tinued implementation of well-timed medium-
term fiscal consolidation strategies. Countries
must continue the process of adjusting high debt
burdens. To navigate short-term fluctuations,
GLOBAL FINANCIAL STABILITY REPORT
12 International Monetary Fund | October 2012
Completepolicies Baselinepolicies Weakpolicies
April2012GFSR
October2012GFSR
Source: IMF staff estimates.
Figure1.9.TotalDeleveragingbySampleBanks
(2011:Q3–2013:Q4;intrillionsofU.S.dollars)
2.2
2.6
3.8
2.3
2.8
4.5
0.0
0.5
1.0
1.5
2.0
2.5
3.0
3.5
4.0
4.5
5.0
. . . increasing pressure on banks to reduce assets and credit.
0 5 10 15 20
Periphery
Core
Source: IMF staff estimates.
Note: Core = Austria, Belgium, Finland, France, Germany, and the Netherlands;
periphery = Greece, Ireland, Italy, Portugal, and Spain. Total credit includes domestic and
direct cross-border credit supplied by banks.
Figure1.10.ReductioninEuroAreaSupplyofCreditunder
AlternativePolicyScenarios
(Cumulativefor2011:Q3–2013:Q4,inpercentoftotalcredit)
Completepolicies
Baselinepolicies
Weakpolicies
Periphery economies could face a deepening credit crunch . . .
–20
–15
–10
–5
0
5
10
2012 20172016201520142013
Source: IMF staff estimates.
Note: Core = Austria, Belgium, Finland, Germany, and the Netherlands; periphery =
Greece, Ireland, Italy, Portugal, and Spain.
Figure1.11.ImpactonInvestmentfromEUBank
Deleveraging
(PercentagepointdeviationfromWEObaseline)
Euroareaperiphery,
completepolicies
Euroareaperiphery,
weakpolicies
Euroareacore,
completepolicies
Euroareacore,
weakpolicies
. . . resulting in diverging investment . . .
2012 20172016201520142013
–7
–6
–5
–4
–2
–3
–1
0
2
4
1
3
Source: IMF staff estimates.
Note: Core = Austria, Belgium, Finland, Germany, and the Netherlands; periphery =
Greece, Ireland, Italy, Portugal, and Spain.
Figure1.12.ImpactonEmployment from EUBank
Deleveraging
(PercentagepointdeviationfromWEObaseline)
Euroareaperiphery,
completepolicies
Euroareaperiphery,
weakpolicies
Euroareacore,
completepolicies
Euroareacore,
weakpolicies
. . . and employment . . .
CHAPTER 1 GLOBAL FINANCIAL STABILITY ASSESSMENT
International Monetary Fund | October 2012 13
however, countries with fiscal space should let
automatic stabilizers operate around a path of
sustained fiscal adjustment (see the October 2012
Fiscal Monitor for further details).
• For the banking system, important steps must be
taken to recapitalize or restructure viable banks
where necessary and resolve nonviable banks.
Conservation of public resources should require
burden sharing by shareholders and by subordi-
nated debt holders in banks that receive signifi-
cant injections of public capital. Full protection
of bank liabilities by impaired sovereigns is likely
to do more systemic harm than good by raising
the credit risk premium for the whole economy
through higher sovereign funding costs. In the
case of resolution, other creditors may be sub-
jected to bail-in, respecting the creditor hierarchy.
• Individual countries must address the issues that
caused them to lose access to long-term market
financing within the currency area. Wide-ranging,
growth-enhancing structural and institutional
reforms are needed to strengthen competitiveness
and economic governance and to narrow external
imbalances.
Steps taken at the euro area level to help dis-
solve the destructive sovereign-banking nexus are
also urgently needed to support national eorts at
stabilization:
• For the banking system, this should include
continuing adequate funding for banks through
the ECB’s liquidity framework—supplemented
with relaxed standards for collateral, as already
announced in September. For countries facing a
severe feedback loop between banks and sover-
eigns, banks need direct support from the existing
crisis management facilities, namely the European
Financial Stability Facility (EFSF) and its succes-
sor, the European Stability Mechanism (ESM),
following the establishment of a single supervisory
mechanism.
• Separating the sovereign debt issue from sover-
eign liabilities toward domestic banks will require
decisive moves toward a banking union. Progress
is needed on common regulations and supervi-
sion, as well as bank resolution and common
safety nets, along with adequate backstops to both
a joint deposit insurance fund and a single bank
resolution authority. While current plans envis-
age the creation of the single supervisor, it is also
essential to provide a clear timeline and detailed
concrete steps toward creation of the resolution
authority and joint deposit insurance, which will
happen at a later stage. This is essential to guide
market expectations and regain confidence.
2012 20172016201520142013
–6
–5
–4
–3
–2
–1
0
1
3
2
Source: IMF staff estimates.
Note: Core = Austria, Belgium, Finland, Germany, and the Netherlands; periphery =
Greece, Ireland, Italy, Portugal, and Spain.
Figure1.13.ImpactonGDPfromEUBankDeleveraging
(PercentagepointdeviationfromWEObaseline)
Euroareaperiphery,
completepolicies
Euroareaperiphery,
weakpolicies
Euroareacore,
completepolicies
Euroareacore,
weakpolicies
. . . and growth under the downside scenario.
2.0
2.5
3.0
3.5
4.0
4.5
5.0
200 300 400 500 600 700 800
Sovereignspreads(basispoints)
Reduction in bank assets
(trillions of U.S. dollars)
Source: IMF staff estimates.
Note: Periphery sovereign spreads are GDP‐weighted average spreads of Greece,
Ireland, Italy, Portugal, and Spain.
Figure1.14.ReductioninBankAssets:Sensitivityto
PeripherySovereignSpreads
(2011:Q3–2013:Q4)
Complete
Policies
Baseline
Policies
Weak
Policies
Forward
Curve
2.3
2.8
4.5
2.9
Reducing sovereign spreads would help relieve deleveraging
stress.