REPORT ON AIR QUALITY AND AIR POLLUTION CONTROL POLICIES OF THE COMMONWEALTH OF VIRGINIA ppt
Bạn đang xem bản rút gọn của tài liệu. Xem và tải ngay bản đầy đủ của tài liệu tại đây (2.41 MB, 30 trang )
AIR QUALITY AND AIR POLLUTION CONTROL
POLICIES OF THE COMMONWEALTH OF VIRGINIA
A Report to the Honorable Robert F. McDonnell, Governor
and the General Assembly of Virginia
Virginia Department of Environmental Quality
October 2011
i
Table of Contents
1 Executive Summary 1
1.1 Air Quality in the Commonwealth 1
1.2 Air Quality Policies in the Commonwealth 1
1.3 Summary of Annual Air Division Activities 1
2 Status of Air Quality in the Commonwealth of Virginia 2
2.1 Monitoring Network 2
2.1.1 Hopewell Air Toxics Study 3
2.1.2 NATTS/NCore Site 3
2.1.3 Lead NAAQS and Lead Monitoring 5
2.2 Data Trends for PM
2.5
and Ozone 5
3 Air Pollution Control Overview 8
3.1 Air Quality Planning Initiatives 8
3.1.1 Control Technique Guidelines 8
3.1.2 1997 Ozone NAAQS Maintenance Areas 9
3.1.3 2006 NAAQS for PM
2.5
9
3.1.4 2008 NAAQS for Ozone and 2011 Reconsideration 10
3.1.5 2010 NO
2
NAAQS 10
3.1.6 2010 SO
2
NAAQS 11
3.1.7 Regional Haze 13
3.2 Air Permitting 14
3.2.1 Revision of Minor NSR Regulation 16
3.2.2 Development of General Permits 16
3.2.3 Greenhouse Gas Permitting 16
3.2.4 Dominion Warren County 17
3.2.5 Fumigation 17
3.2.6 Outer Continental Shelf Permitting 17
3.3 Air Compliance Activities 17
3.3.1 Inspection Planning 18
3.3.2 Sources Evaluated for Compliance 18
3.3.3 Small Business Assistance 19
3.4 Air Enforcement Activities 19
3.5 Motor Vehicle Inspection and Maintenance Program 20
3.5.1 MSOS 21
3.5.2 On-Road Emissions Monitoring Program 21
3.6 Title V Fees 21
4 Control Programs 22
4.1 Cross State Air Pollution Rule 23
4.2 Mobile Source Programs 24
4.3 Product Based Programs 24
4.4 Non-Road Control Programs 25
ii
Table of Figures and Tables
Figure 2-1: Virginia Ozone Monitoring Network 2
Figure 2-2: View of the Henrico County NATTS/NCore Site Looking South 4
Figure 2-3: Interior View of the Henrico County NATTS/NCore Site 4
Figure 2-4: Richmond Area PM
2.5
Air Quality, Annual Basis 5
Figure 2-5: Northern Virginia 24-Hour PM
2.5
Air Quality 6
Figure 2-6: Henrico PM
2.5
Speciation Data, 2004-2010 7
Table 2-1: Ozone Air Quality Values for All Virginia Monitors, 2008-2010 Data 7
Figure 3-1: Virginia NO
2
Data, 2008-2010 11
Figure 3-2: Virginia SO
2
Data, 2008-2010 12
Figure 3-3: Virginia SO
2
Air Quality Trends 2002-2010 12
Figure 3-4: Virginia SO
2
Emission Trends 1999-2009 13
Figure 3-5: Expected Visibility Improvement Between 2004 (left) and 2018 (right) in
Shenandoah 14
Figure 3-6: 2010 Initial Failures by Vehicle Model Year (Number x 10) 20
Figure 3-7: Comparison of Regulated and Billable Emissions in Virginia 22
Figure 4-1: Anthropogenic Emission Estimates for the Commonwealth 23
Figure 4-2: CSAPR Assurance Levels and Actual 2010 Emissions 23
Figure 4-3: PM
2.5
and SO
2
Emissions from Mobile Sources in Virginia 24
Figure 4-4: VOC and NO
X
Emissions from Mobile Sources in Virginia 24
iii
Commonly Used Abbreviations
AQI Air Quality Index
AQM Office of Air Quality Monitoring
APA Administrative Process Act
ASM Acceleration Simulation Mode
BAC Best Available Controls
BACT Best Available Control Technology
BART Best Available Retrofit Technology
CAA Clean Air Act
CAIR Clean Air Interstate Rule
CAMR Clean Air Mercury Rule
CASAC Clean Air Scientists Advisory Committee
CH
4
Methane
CMS Compliance Monitoring Strategy
CO Carbon Monoxide
CO
2
Carbon Dioxide
CO
2
e Carbon Dioxide Equivalent Emissions
CPI Consumer Price Index
CTG Control Technique Guideline
DMV Department of Motor Vehicles
ECHO Enforcement and Compliance History
Online
EGU Electric Generating Unit
ELRP Emergency Load Response Program
EPA Environmental Protection Agency
FCE Full Compliance Evaluation
FOIA Freedom of Information Act
FRM Federal Reference Monitor
GHG Greenhouse Gas
GVWR Gross Vehicle Weight Rating
GWAQC George Washington Air Quality Committee
HAP Hazardous Air Pollutant
HPV High Priority Violation
HRAQC Hampton Roads Air Quality Committee
I/M Motor Vehicle Inspection and Maintenance
Program
ISO Independent Systems Operator
LAER Lowest Achievable Emissions Rate
LPO Lead Planning Organization
MACT Maximum Achievable Control Technology
MANE-VU Mid Atlantic/Northeast Visibility Union
MARAMA Mid Atlantic Regional Air Management
Association
MJO Mult i-jurisdictional planning organization
MMte Million Metric Tons of CO
2
equivalent
MSOS Mobile Source Operations Section
MRAQC Metropolitan Richmond Air Quality
Committee
MW Megawatt
MWAQC Metropolitan Washington Air Quality
Committee
NAAQS National Ambient Air Quality Standard
NATA National Air Toxic Assessments
NATTS National Air Toxics Trend Site
NCore National Core Monitoring Site
NH
3
Ammonia
NLEV National Low Emission Vehicle Program
NO
2
Nitrogen Dioxide
NOIRA Notice of Intended Regulatory Action
NOV Notice of Violation
NOX Nitrogen Oxides
NSR New Source Review
OCS Outer Continental Shelf
ORE On-Road Emissions Program
OTC Ozone Transport Commission
OTR Ozone Transport Region
PM Particulate Matter
PM
2.5
Particulate Matter not more than 2.5
Angstroms in Diameter
PM
10
Particulate Matter no more than 10
Angstroms in Diameter
PM
10-2.5
Particulate matter with a diameter between
2.5 and 10 Angstroms
ppb Parts per Billion
ppm Parts per Million
PSD Prevention of Significant Deterioration
RACM Reasonably Available Control Measures
RACT Reasonably Available Control Technology
RAP Regulatory Advisory Process
RBIS Risk Based Inspection System
RFG Reformulated Gasoline
RFP Reasonable Further Progress
RIA Regulatory Impact Analysis
ROP Rate of Progress
RPO Regional Planning Organization
SACC Significant Ambient Air Concentrations
SAPCB State Air Pollution Control Board
SBA Small Business Assistance
SHEN-AIR Shenandoah Valley Air Quality Initiative
SIP State Implementation Plan
SO
2
Sulfur Dioxide
SOP State Operating Permit
STN Speciated Trends Network
T&A Timely and Appropriate
TPY tons per year
TR Transport Rule
UATM Urban Air Toxics Monitoring network
ug/m
3
Micrograms per Cubic Meter
VDH Virginia Department of Health
VINTAG Virginia Inhalation Toxicology Advisory
Group
VISTAS Visibility Improvement State and Tribal
Association of the Southeast
VPM Virginia Productivity Measurements
1
1 Executive Summary
This report was prepared by the Virginia Department of Environmental Quality (VDEQ)
on behalf of the State Air Pollution Control Board (SAPCB) for the Governor and General
Assembly pursuant to § 10.1-1307 G of the Code of Virginia. This report details the status of
Virginia's air quality, provides an overview of the air division programs, and briefly summarizes
the federal and state air quality programs being implemented.
1.1 Air Quality in the Commonwealth
Air quality in Virginia continues to improve. However, the air quality standards that the
Commonwealth must attain are becoming more stringent. In 2010, the Environmental Protection
Agency (EPA) published lower National Ambient Air Quality Standards (NAAQS) for sulfur
dioxide (SO
2
) and for nitrogen dioxide (NO
2
). Both of these standards reflect new
implementation and monitoring strategies as well as more stringent numerical ambient air quality
standards. The Obama Administration requested, on September 2, 2011, that EPA withdraw a
proposed reconsideration of the 2008 ozone NAAQS. That proposed reconsideration
contemplated reducing the ozone standard to between 0.060 parts per million (ppm) and 0.070
ppm on an 8-hour average. Federal implementation strategies for the 2008 ozone NAAQS,
which was set at 0.075 ppm on an 8-hour average, are currently unknown. The 2008 ozone
NAAQS will be challenging for some areas of the Commonwealth to meet.
1.2 Air Quality Policies in the Commonwealth
In response to the decisions of the U.S. Court of Appeals for the D.C. Circuit regarding
the Clean Air Interstate Rule (CAIR), EPA finalized the Cross State Air Pollution Rule
(CSAPR). This rule requires 27 states to reduce power plant emissions that contribute to ozone
and fine particulate pollution in other states. EPA also proposed air toxics standards for coal-
and oil-fired electric generating units (EGUs) on March 16, 2011 and expects to finalize this
proposal by the end of 2011. These regulations will impact air quality policies in the
Commonwealth.
1.3 Summary of Annual Air Division Activities
Monitoring Locations: 43 On Site Inspections : 1,555
Monitoring Instruments: 112 Enforcement Actions: 347
Minor Source Permits Issued: 244 Vehicles Inspected: 821,000
State Major Permits Issued: 1 Vehicles Failed: 40,000
General Permits Issued: 24 Inspection Station Audits: 1,200
State Operating Permits Issued: 31 Covert Audits: 169
Federal Operating Permits Issued: 31 Consent Orders Issued: 28
General Permits Developed: 3 Civil Charges Collected: $1,203,204
Compliance Inspection Reports: 7,781
2
2 Status of Air Quality in the Commonwealth of Virginia
Ambient concentrations of fine particulate matter (PM
2.5
), carbon monoxide (CO), NO
2
,
and SO
2
in Virginia met EPA’s NAAQS in 2010. Virginia’s air quality in some regions of the
Commonwealth during the summer of 2011 did not comply with the 2008 ozone NAAQS.
2.1 Monitoring Network
National Park Service
Bland
Buchanan
Dickenson
Grayson
Lee
Russell
Scott
Smyth
Tazewell
Washington
Wise
Wythe
BristolCity
Albemarle
Alleghany
Amelia
Amherst
Appomattox
Arlington
Augusta
Bath
Bedford
Botetourt
Brunswick
Buckingham
Campbell
Caroline
Carroll
CharlesCity
Charlotte
Chesterfield
Clarke
Craig
Culpeper
Dinwiddie
Essex
FairfaxFauquier
Floyd
Fluvanna
Franklin
Frederick
Giles
Goochland
Greene
Greensville
Halifax
Hanover
Henrico
Henry
Highland
King George
Loudoun
Louisa
Lunenburg
Madison
Mecklenburg
Montgomery
Nelson
New Kent
Nottoway
Orange
Page
Patrick
Pittsylvania
Powhatan
Prince Edward
Prince William
Pulaski
Rappahannock
Roanoke
Rockbridge
Rockingham
Shenandoah
Southampton
Spotsylvania
Stafford
Surry
Sussex
Warren
Alexandria City
Charlottesville City
Chesapeake City
Danville City
Fairfax City
HamptonCity
LynchburgCity
NewportNews City
Norfolk
Portsmouth City
Richmond City
Roanoke City
Salem City
Suffolk City
Virginia Beach City
VA Department of Environmental Quality
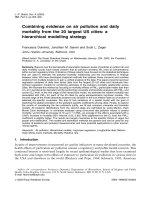
Figure 2-1: Virginia Ozone Monitoring Network
VDEQ’s Office of Air Quality Monitoring (AQM) maintains an extensive air quality
monitoring network throughout the Commonwealth. Ambient air quality was measured by
approximately 112 instruments at 43 sites during 2010 - 2011. Figure 2-1 shows the various
ozone monitoring sites in Virginia. All monitoring sites were established in accordance with
EPA's siting criteria (40 CFR Part 58, Appendices D and E), and all sites conform to EPA
guidance documents and generally accepted air quality monitoring practices. Data reported from
the Virginia air quality monitoring network were quality assured in accordance with federal
requirements (40 CFR Part 58, Appendix A). The data are published annually in the Virginia
Ambient Air Monitoring Data Report and are available from the VDEQ website at
3
2.1.1 Hopewell Air Toxics Study
Pursuant to a federal grant, AQM completed a study of air toxics in Hopewell. This
study commenced in 2006, and the study was completed on November 1, 2008. Additional
monitoring was conducted from November 2008 through June 2009 for data validation purposes.
Two of the three sites for the study have been dismantled and removed. One site, located at
Carter Woodson Middle School, has been retained as a permanent air toxics monitoring site and
will be part of Virginia’s Urban Air Toxics Monitoring (UATM) network. The study indicates
that most airborne chemicals in the city of Hopewell are safely below Virginia’s long-term air
quality standards. A preliminary report of the Hopewell air quality study was published in
February 2009 and is available at: The results of the
study have been released to the public, and a public meeting was held to review the results with
residents of Hopewell and other interested citizens.
Using this data, VDEQ’s Risk Assessment Program developed a risk assessment report
that characterizes the level of public health risk due to the concentrations of air toxic pollutants
measured during the monitoring phase of the study. The risk assessment was presented to the
public in February of 2011 and is available at:
VDEQ’s air division is continuing to evaluate means to reduce risk from air pollutants in
Hopewell.
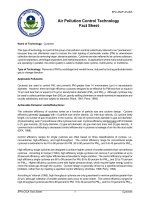
2.1.2 NATTS/NCore Site
VDEQ installed a new National Air Toxics Trend Site (NATTS) at the Math and Science
Innovation Center monitoring station in eastern Henrico County using funds received from a
federal grant. This addition expands the site’s toxic monitoring capabilities, and data from this
site are now included in the National Trends report issued annually by EPA. The site has been
significantly upgraded with a new state-of-the-art shelter and improved instrumentation. EPA
performed an audit of this site during the summer of 2011 and determined that the site is
constructed and operated in a manner consistent with all NATTS program requirements.
This site will also house the new National Core (NCore) monitoring equipment. NCore
monitoring is a federally required program intended to ensure that every state has a research-
level facility that monitors a large suite of pollutants and gathers accompanying meteorological
data so that the data generated can be used for trend analysis and long term air quality studies.
The NCore site additions were completed November 1, 2010.
4
Figure 2-2: View of the Henrico County NATTS/NCore Site Looking South
Figure 2-3: Interior View of the Henrico County NATTS/NCore Site
5
2.1.3 Lead NAAQS and Lead Monitoring
In October 2008, EPA established a new NAAQS for lead. This NAAQS reduced the
standard for lead from 1.5 ug/m
3
to 0.15 ug/m
3
. The revised lead NAAQS requires additional
ambient air quality monitoring, including source-oriented monitors at facilities in Buchanan
County, the city of Lynchburg, and the city of Roanoke. The new monitoring requirements also
include an additional lead monitor at Virginia’s NCore site in Henrico County. EPA initially
indicated that other sites within the Commonwealth may need to have lead monitors installed,
but VDEQ’s analysis showed that EPA’s emissions numbers were outdated. VDEQ provided the
appropriate analysis, and EPA has agreed to remove these facilities from the list of required lead
monitoring sites.
2.2 Data Trends for PM
2.5
and Ozone
For PM
2.5
, the general trend for the annual average across the Commonwealth shows
marked improvement in air quality. Figure 2-4 provides annual PM
2.5
averages for monitors in
the Richmond-Petersburg area. Other areas of the Commonwealth follow a similar trend.
Figure 2-4: Richmond Area PM
2.5
Air Quality, Annual Basis
6
For the 24-hour PM
2.5
data, the monitors across the Commonwealth have registered a
pattern of decreasing values, and all monitors are in compliance with the 35 ug/m
3
standard.
Figure 2-5 provides data for Northern Virginia air quality PM
2.5
monitors and shows the values
on a 24-hour basis. As denoted by the red line in the chart below, all monitors in Northern
Virginia are showing levels below the 2006 NAAQS for PM
2.5
, indicating good air quality for
PM
2.5
. Other areas of the Commonwealth follow a similar trend.
Regulations requiring reduced sulfur content in fuels as well as regulations requiring SO
2
reductions from EGUs have contributed to the improvement in PM
2.5
air quality over the last few
years. Figure 2-6 presents PM
2.5
speciation data, which provide information concerning the
various components of PM
2.5
. These data show that the sulfate portion of PM
2.5
, which is
associated with SO
2
emissions, has decreased between 2004 and 2010, indicating the efficacy of
SO
2
control programs.
Figure 2-5: Northern Virginia 24-Hour PM
2.5
Air Quality
7
Figure 2-6: Henrico PM
2.5
Speciation Data, 2004-2010
Like PM
2.5
, ozone trends continue to show improvement in air quality. In 2008, EPA
finalized an ozone standard of 0.075 ppm. Certain areas of the Commonwealth have air quality
monitoring data that are above this standard. Table 2-1 shows the monitoring data for the 2008
through 2010 ozone seasons for each of the monitors in Virginia. Data are provided in parts per
billion. More information regarding this ozone standard may be found in Section 3.1.4.
Table 2-1: Ozone Air Quality Values for All Virginia Monitors, 2008-2010 Data
County
Value,
ppb
County
Value,
ppb
County Value, ppb
Loudoun 75 Shenandoah 73 Wythe 66
Prince William 70 Stafford 70 Rockbridge 65
Arlington 79 Caroline 73 Page 66
Alexandria 74 Frederick 68 Fauquier 66
Fairfax-Lee Park 81 Roanoke 69 Rockingham 66
Hanover 75 Chesterfield 75 Albemarle 69
Charles City 75 Henrico 76 Suffolk-TCC 71
Suffolk-Holland 72
8
3 Air Pollution Control Overview
This overview is broadly categorized into planning, permitting, compliance, enforcement,
and other initiatives. Descriptions of significant current policy issues under each broad category
are provided.
3.1 Air Quality Planning Initiatives
Air quality planning strategies now focus on preparations for compliance with the 2010
NO
2
NAAQS, the 2010 SO
2
NAAQS, and the 2008 ozone NAAQS. However, other initiatives
continue to require attention and resources. These initiatives include the development and
submittal of various Clean Air Act (CAA) infrastructure requirements; the mid course review
requirements of the Regional Haze program; and the development of a redesignation request and
maintenance plan for the Northern Virginia 1997 NAAQS PM
2.5
nonattainment area. Many of
these strategies and initiatives will be heavily influenced by the requirements in the CSAPR,
which was finalized on July 6, 2011.
3.1.1 Control Technique Guidelines
As required by §183(e) of the CAA, EPA conducted a study of volatile organic
compound (VOC) emissions from the use of consumer and commercial products to assess their
potential to contribute to levels of ozone that violate the NAAQS for ozone and to establish
criteria for regulating VOC emissions from these products. Any regulations issued under
§183(e) must be based on “best available controls” (BAC).
Section 183(e)(3)(C) provides that EPA may issue a control technique guideline (CTG) in
lieu of a national regulation for a product category where EPA determines that the CTG will be
substantially as effective as national regulations in reducing emissions of VOC in ozone
nonattainment areas. A state with ozone nonattainment areas is required to evaluate the
recommendations provided in the CTGs and determine if modification of existing regulations or
creation of new regulations is needed to be consistent with the requirements of the CTG. A state
with areas included in the Ozone Transport Region (OTR), like Northern Virginia, must apply
the requirements in the OTR for all sources covered by the CTG. After VDEQ promulgates a
regulation implementing the requirements of the CTG for a product or source category, VDEQ
must submit the regulation to the EPA for approval as part of the State Implementation Plan
(SIP) within one year from signature of the CTG. EPA has issued four groups of standards under
§183(e) of the CAA:
• Group I: These standards apply to categories such as consumer products, architectural
coatings, and auto body refinishing coatings. Unlike Groups II, III, and IV, these standards
are national requirements and are codified in 40 CFR Part 59.
• Group II: Issued September 29, 2006, these CTGs regulate VOC emissions from flexible
packaging printing operations, lithographic and letterpress printing materials, industrial
cleaning solvents, and flat wood paneling coatings.
9
• Group III: Issued October 9, 2007, these CTGs regulate VOC emissions from paper, film,
and foil coatings; metal furniture coatings; and large appliance coatings.
• Group IV: Issued July 14, 2008, these CTGs regulate VOC emissions from miscellaneous
metal products coatings; plastic parts coatings; auto and light-duty truck assembly coatings;
fiberglass boat manufacturing materials; and miscellaneous industrial adhesives.
VDEQ has surveyed the Northern Virginia area and submitted declarations to EPA for
several of the CTG categories demonstrating that no potentially regulated facilities operate in the
Northern Virginia area. However, the survey results indicate that, for some categories,
potentially affected facilities may be operating in the Northern Virginia area and that regulations
must be developed for offset lithographic printing and letterpress printing; industrial cleaning
solvents; miscellaneous metal and plastic parts coatings; and miscellaneous industrial adhesives.
These regulations are continuing through the Commonwealth’s regulatory process.
3.1.2 1997 Ozone NAAQS Maintenance Areas
Improvements in air quality allowed the following areas to demonstrate compliance with
the 1997 ozone NAAQS standard after these areas were originally designated as nonattainment:
Richmond-Petersburg, Fredericksburg, the Shenandoah National Park, and Hampton Roads.
When an area is redesignated from nonattainment to attainment, Virginia must prepare a SIP that
meets the requirements for 8-hour ozone maintenance areas and that demonstrates how good air
quality will be maintained into the future. Using EPA guidance, the Commonwealth submitted
redesignation requests, inventories, and maintenance plans for these areas to EPA, which were
approved after review and public comment.
During the 2007 and 2008 ozone seasons, ozone violations were registered at a monitor
in Henrico County, part of the Richmond-Petersburg maintenance area. The maintenance plan
for the area includes contingency measures to be implemented in such an event. A regulatory
action was initiated in order to implement control strategies specified in the contingency
measures for the Richmond-Petersburg area. These contingency measures include control
strategies for mobile equipment repair and refinishing, architectural and industrial maintenance
coatings, consumer products, and portable fuel containers. As a proactive measure towards
meeting the new ozone NAAQS in this area, the SAPCB also directed VDEQ to take comment
on the implementation of an additional regulation, the adhesives and sealants regulation. These
regulations are continuing through the Commonwealth’s regulatory process.
3.1.3 2006 NAAQS for PM
2.5
On September 22, 2006, EPA promulgated a revised PM
2.5
NAAQS. The new standard
revised the daily PM
2.5
standard from 65 ug/m
3
to 35 ug/m
3
and retained the PM
2.5
annual
standard of 15.0 ug/m
3
. On October 8, 2009, EPA published the final designations for the 2006
daily PM
2.5
standard in the Federal Register, and all areas of the Commonwealth were designated
as attainment or unclassifiable.
10
3.1.4 2008 NAAQS for Ozone and 2011 Reconsideration
On March 12, 2008, EPA revised both the primary and the secondary NAAQS for ozone
to 0.075 ppm. However, on September 16, 2009, EPA announced that it was reconsidering the
2008 ozone standard, and on January 6, 2010, EPA proposed a new ozone standard of between
0.060 ppm and 0.070 ppm on an 8-hour average. EPA noted that the ozone standards set in 2008
were not as protective as recommended by EPA’s panel of science advisors, the Clean Air
Scientific Advisory Committee (CASAC). EPA stated that the proposed standards are consistent
with CASAC’s recommendations and place more weight on key scientific and technical
information. On September 2, 2011, the Obama Administration requested that EPA withdraw its
proposed reconsideration of the 2008 standard. As demonstrated in Table 2-1, the 2008 ozone
NAAQS of 0.075 ppm will be challenging for certain areas of Virginia to meet. At this time
federal implementation strategies for the 2008 ozone NAAQS are not known. The next review
of the ozone NAAQS will be in 2013.
3.1.5 2010 NO
2
NAAQS
NO
2
is a gaseous air pollutant that forms when fossil fuels such as coal, oil, gasoline, or
diesel are burned at high temperatures. NO
2
contributes to the formation of particle pollution by
converting in the atmosphere to nitrate aerosols, a component of PM
2.5
. NO
2
also is a building
block of ozone.
On January 22, 2010, EPA finalized a new primary NO
2
NAAQS and set the standard at
100 ppb over a one-hour average, which is significantly more stringent than the previous primary
standard of 53 ppb on an annual average. In this standard EPA also established new monitoring
and reporting requirements that will require the location of NO
2
monitors near major road ways.
EPA noted that NO
2
concentrations near major roads are expected to be appreciably higher than
the levels measured in the current network.
VDEQ is working towards modifying the existing monitoring network to meet the
requirements of the NO
2
NAAQS, including the installation of a near-road monitor. VDEQ
expects that one roadside monitoring site will be required for Virginia, and the location of this
monitoring site is tentatively planned for the I-95/I-395 interchange in Fairfax County.
Data from the existing air quality monitoring network demonstrates compliance with the
new NAAQS, as shown in Figure 3-1. Based on federal guidance, the data shown in Figure 3-1,
and other information, VDEQ submitted in January 2011 a recommendation to the EPA
Administrator that all areas in Virginia be designated as “unclassifiable.” Once near road NO
2
data is available, additional recommendations may be made.
11
Figure 3-1: Virginia NO
2
Data, 2008-2010
3.1.6 2010 SO
2
NAAQS
SO
2
is one of a group of highly reactive compounds known as “oxides of sulfur.” The
largest sources of SO
2
emissions are fossil fuel combustion at power plants and other industrial
facilities. Smaller sources of SO
2
emissions include industrial processes such as extracting metal
from ore and the burning of sulfur-laden fuels by locomotives, large ships, and non-road
equipment. Emissions of SO
2
also contribute to the formation of particle pollution by converting
in the atmosphere to sulfate aerosols, a major component of PM
2.5
.
On June 2, 2010, EPA finalized a new primary NAAQS for SO
2
. This regulation
significantly strengthened the short term requirements by lowering the standard to 75 ppb on a 1-
hour basis. The new federal regulation revokes the previous primary standards of 140 ppb over a
24-hour period and 30 ppb over an annual period. Monitoring data from AQM’s monitoring
network show compliance with this standard, as demonstrated in Figure 3-2.
Air quality data from the existing network show significant air quality improvement in
recent years due to many control programs being implemented. These air quality trends may be
seen in Figure 3-3, and these trends mirror the SO
2
emission reduction trends in recent years
within the Commonwealth. Figure 3-4 shows the significant reductions in SO
2
emissions
realized by a variety of federal programs such as regulations on the interstate transport of SO
2
by
power plants and the requirements for greatly reduced sulfur content in on-road and off-road
fuels.
12
Figure 3-2: Virginia SO
2
Data, 2008-2010
Figure 3-3: Virginia SO
2
Air Quality Trends 2002-2010
13
Figure 3-4: Virginia SO
2
Emission Trends 1999-2009
Based on this air quality monitoring data, federal guidance, and the lack of source-
specific modeling results, VDEQ made recommendations to the EPA Administrator on June 2,
2011, that all areas in Virginia be classified as “unclassifiable” for this standard.
The SO
2
NAAQS regulation takes a new approach to the implementation of the NAAQS
through the inclusion of additional requirements for CAA Section 110(a) SIPs. These
“infrastructure” SIPs have in the past been used to show that states have the authority to
adequately fund, monitor, enforce, and otherwise implement the NAAQS. This regulation
indicates that future 110(a) SIP submittals for this NAAQS must contain demonstrations by
major SO
2
facilities that their emissions do not cause or contribute to a NAAQS violation or that
such situations will be remedied as soon as practicable but no later than 2017, the NAAQS
compliance year. These 110(a) SIP submittals are due to EPA in 2013. Requirements for air
dispersion modeling and for permitting designed to ensure NAAQS compliance would
significantly increase the modeling staff and permitting staff work load. Implementation
guidance for this rule is expected to be published by the end of 2011.
3.1.7 Regional Haze
Section 169 A of the CAA mandates the protection of visibility in national parks, forests,
and wilderness areas, referred to as Class I federal areas. Visibility impairment or haze is caused
by absorption and scattering of light by fine particles. Sources and activities that emit fine
14
particles and their precursors, such as NO
X
, SO
2
, VOC, and ammonia (NH
3
), contribute to this
problem. In 1999, EPA finalized the Regional Haze Rule, calling for state, tribal, and federal
agencies to work together to improve visibility in 156 national parks and wilderness areas.
VDEQ developed a SIP to address visibility impairment in the Commonwealth’s two
Class I areas, the Shenandoah National Park and the James River Face. This plan established
goals and emission reduction strategies to reduce visibility impairment such that the visibility in
the Shenandoah National Park and the James River Face will be returned to natural conditions by
2064. With the help of the Visibility Improvement State and Tribal Association of the Southeast
(VISTAS) multi-jurisdictional planning organization (MJO), VDEQ developed and submitted a
SIP to address visibility impairment in these two Class I areas. The SIP, which was finalized on
October 4, 2010, addressed reasonable progress requirements of the CAA, long term strategies,
and Best Available Retrofit Technology (BART) requirements for certain industrial facilities.
VDEQ is currently working on the development of a mid course review, as required by federal
regulations, for analyzing progress toward the visibility goals in the SIP submittal. The mid
course review is expected to be ready for submittal to EPA in early 2013.
Figure 3-5: Expected Visibility Improvement Between 2004 (left) and 2018 (right) in Shenandoah
3.2 Air Permitting
VDEQ issues two basic types of air permits: construction permits and operating permits.
Construction permits, termed New Source Review (NSR) permits, apply to new facilities as well
15
as existing facilities that are undergoing an expansion or modification. Operating permits apply
to sources that are already in operation.
VDEQ has three construction permit programs for criteria pollutants. The Prevention of
Significant Deterioration major new source review (PSD) program applies to major sources that
are located in an area that is in attainment with the NAAQS. Sources are required to apply Best
Available Control Technology (BACT) as well as undergo a thorough air quality analysis
demonstration (i.e. air modeling) to assure the new facility or major modification will not cause
or contribute to a violation of the NAAQS or have an adverse impact on any Class I area. The
second program is the non-attainment major NSR program that applies to major sources located
in an area that is not in compliance with one or more NAAQS. A facility in a non-attainment
area must apply the Lowest Achievable Emission Rate (LAER), which is often more rigorous
than BACT, and must obtain offsets for the pollutant for which the area is not in attainment. The
third program is the minor NSR program. This program applies to new sources or existing
sources that are undergoing a modification and that are below major source emissions thresholds.
This program is used more than any other in Virginia. During the 2011 fiscal year, 244 minor
NSR permits were issued. Additionally, the minor NSR program is used to issue state major
source permits, which apply to those sources that have emissions greater than 100 tons per year
of a criteria pollutant but that do not fit the criteria to be classified as PSD or nonattainment
major NSR. One state major permit was issued in Virginia in fiscal year 2011. Virginia also has
a general permit (or permit by regulation) for non-metallic mineral processors. If the facility
meets the necessary requirements, the facility may use the general permit process instead of the
normal minor NSR permitting process. Twenty-four general permits were issued in Virginia
during fiscal year 2011.
VDEQ issues two types of operating permits: state operating permits (SOPs) and federal
operating permits that include Title V permits. SOPs are used primarily to cap a source’s
emissions to keep it below major source emissions thresholds and out of a major source
permitting program. SOPs are often used to place federally and state enforceable limits on
hazardous air pollutants (HAPs) to keep a source out of the federal HAP program. The federal
HAP program generally requires the use of maximum achievable control technology (MACT)
standards. A source may request a SOP at any time, and the SAPCB may issue a SOP as
necessary (due to a modeled or actual exceedance of a NAAQS or to meet a CAA requirement).
Thirty-one SOPs were issued during fiscal year 2011.
The Title V permit program applies to sources that meet the criteria for being “major”
under Title V of the CAA. The purpose of a Title V permit is to compile all requirements from a
source’s multiple air permits (construction and operating) into one permit document. A newly
constructed source that is large enough to qualify as a Title V source must apply for a Title V
permit within one year of starting operation. Title V permits must be renewed every five years.
Acid Rain permits also are considered federal operating permits. These permits are
issued to sources that are subject to the federal acid rain program (CAA Title IV). One federal
operating permit and 30 operating permit renewals were issued during fiscal year 2011.
16
3.2.1 Revision of Minor NSR Regulation
In fiscal year 2011, the SAPCB took final action on the amendments to the minor NSR
regulation. The amended rule makes clarifications and incorporates the most recent federal and
state policies and guidance into the minor NSR program. The final rule is going through the
Commonwealth’s regulatory review process.
3.2.2 Development of General Permits
Section 10.1-1308.1 requires the development of a general permit for qualified energy
generators that use biomass and produce up to five megawatts (MW) of energy. The biomass
general permit was finalized in fiscal year 2011 and may now be used by facilities.
Pursuant to legislation adopted during the 2009 General Assembly Session, the SAPCB
was directed to develop two additional general permits. One general permit is for specific
sources that generate electricity during emergencies, including Independent Systems Operator
(ISO) declared emergencies. This general permit applies to sources above the minor source
permitting exemption levels but below the major source permitting exemption levels. The
second general permit applies to generators that are used for load curtailment, demand response,
or peak shaving. Sources have the option of getting a general permit or a minor NSR permit.
Both of these general permits were finalized in fiscal year 2011 and will become effective in
fiscal year 2012.
3.2.3 Greenhouse Gas Permitting
On January 2, 2011, greenhouse gases (GHGs) became regulated pollutants that must be
considered during the major source air permitting process. On May 13, 2011, EPA approved
Virginia’s program for GHGs. As a result of this approval, VDEQ, not EPA, became the official
permitting authority for major sources emitting GHGs. A source is only required to address their
GHG emissions if they emit more than 100,000 tons per year (tpy) of carbon dioxide equivalent
pollution (CO
2
e) or modify their source such that there is at least a 75,000 tpy increase in CO
2
e.
Minor sources of air pollution are excluded from the GHG requirements. Additionally, on
March 21, 2011, EPA proposed a deferral for sources that emit CO
2
from biomass processes
such as wood combustion. The EPA deferral will be finalized in fiscal year 2012 and is
scheduled to be submitted to the SAPCB for approval. The deferral is for three years and gives
EPA time to evaluate the net result of emitting CO
2
by combusting biomass versus the
absorption of CO
2
by biomass. Sources that would have been major only because of their CO
2
emissions from biomass will not have to go through the major NSR permitting process until the
deferral expires.
17
3.2.4 Dominion Warren County
On December 21, 2010, VDEQ issued a PSD permit to Dominion for a new 1,280 MW
combined-cycle combustion turbine facility in Warren County. The facility will be located
within five miles of the Shenandoah National Park. Part of the permit process included a
negotiation between Dominion and the Federal Land Manager to assure any negative impacts to
the Park would be mitigated by Dominion by obtaining emission offsets.
3.2.5 Fumigation
The 2010 General Assembly added §10.1-1308.01, Qualification Fumigation Facilities,
which exempts from minor source air permitting requirements small fumigation operations that
fumigate commodities. These facilities usually use methyl bromide or phosphine, both of which
are HAPs under the CAA. Facilities using less than 10 tpy of any HAP avoid permitting as long
as certain conditions are met such as reporting specific operational information to VDEQ and
maintaining a buffer zone to limit public exposure outside the fence line of the property. The
law became effective on July 1, 2011.
3.2.6 Outer Continental Shelf Permitting
Section 328 of the CAA requires the regulation of air pollution sources located on the
Outer Continental Shelf (OCS). States may request the permitting authority for those sources
located within 25 miles of the coast, and Senate Bill 659 (2010) directed VDEQ to do so. This is
accomplished in two phases. First, EPA conducts a consistency evaluation and adopts the state
regulations into 40 CFR Part 55. Once that has been accomplished, a state may request EPA to
delegate those requirements back to the state. The first part of the requirement has been met, and
it is anticipated the second part will occur in fiscal year 2012. At that point, VDEQ, not EPA,
will become the permitting authority for any source of air pollution locating off the Virginia
coast.
3.3 Air Compliance Activities
The purpose of the compliance program is to enforce all applicable state and federal air
regulations and laws. The goal is for facilities operating within the Commonwealth to be
compliant with those regulations and laws, and the focus is to provide the necessary compliance
and/or enforcement assistance to correct detected violations as expeditiously as possible. This
concept supports VDEQ’s mission to protect the environment and human health.
To ensure that industry constructs and operates within the boundary of applicable
regulations and permit conditions, VDEQ’s air compliance program operates consistent with
EPA’s 2001 National Compliance Monitoring Strategy (CMS). This strategy targets the largest
potential emitters of air pollution for a full compliance evaluation (FCE) at a minimum
18
recommended frequency of once every two years. An FCE consists of a comprehensive
evaluation of the facility records and equipment associated with pollutant emissions, to include
the examination of documents detailing throughputs, emissions, testing, and reporting, in order to
determine the facility’s overall compliance status. The compliance status of Virginia’s regulated
facilities is reported to EPA weekly and is publicly available on EPA’s Environmental
Compliance and History Online (ECHO) external website.
3.3.1 Inspection Planning
VDEQ advocates the use of a risk based concept when identifying facilities for an FCE.
Using a number of qualifiers, VDEQ identifies facilities with a higher potential adverse impact
to the environment and targets those facilities for an FCE based on one or more risk factors.
This concept was developed by VDEQ and is being used in collaboration with the CMS to
develop annual inspection plans; it also has a multimedia component. Referred to as VDEQ’s
Risked Based Inspection Strategy or RBIS, it provides flexibility to use resources where they are
most needed. EPA granted VDEQ approval to exercise the risk based concept on a three year
trial basis with EPA Region 3 oversight.
Virginia is the only EPA Region 3 state with a formal risk based strategy. The RBIS may
identify facilities that are not a focus of the CMS strategy, and the RBIS may be used to justify
increases or decreases in the frequency of inspections. Determinations of increased or decreased
inspection frequencies are based on risk qualifiers such as participation in the environmental
enhancement program, compliance history, facility type, environmental sensitivity, multi-media
applicability, environmental justice (concerns and complaints), and agency initiatives.
3.3.2 Sources Evaluated for Compliance
Virginia has approximately 5,000 registered facilities, not including approximately 1,192
gasoline dispensing Stage II vapor recovery facilities (gas service stations in the Richmond area
and Northern Virginia). In June 2009, VDEQ signed a Memorandum of Understanding (MOU)
with EPA Region 3 accepting delegation to enforce 23 of 26 federal area source MACT
regulations and since then has accepted delegation of another seven. These regulations apply to
a substantial universe of facilities emitting toxic pollutants below major source and minor source
NSR permitting thresholds. As part of the MOU, VDEQ agreed to support EPA through
outreach efforts for the three area source MACT regulations not accepted while EPA retained
sole implementation and enforcement authority. The three area source MACT regulations for
which VDEQ has not taken delegation are the reciprocating internal combustion engine
standards, the gasoline dispensing standards, and the auto body refinishing standards. These
three area source MACT regulations are estimated to constitute a source population of more than
20,000 in Virginia.
For the 2010 federal fiscal year, the air compliance program completed a total of 7,781
partial and full compliance inspection reports; conducted a total of 1,555 on-site inspections,
including complaint investigations and Stage II inspections; observed 55 stack tests; and issued a
combination of 347 formal and informal enforcement actions.
19
3.3.3 Small Business Assistance
The Small Business Assistance (SBA) program is required by Virginia law and mandated
under the CAA. The air compliance program provides various forms of compliance assistance to
potentially thousands of small businesses throughout the Commonwealth. These services are
provided at no cost in order to inform, educate, and assist small businesses in complying with
environmental regulations. Examples are the Dry Cleaner and Stage II calendars made available
to small businesses to improve understanding of those regulations.
Most of these small business owners do not have experience interpreting or complying
with environmental regulations. Therefore, the SBA services provided are beneficial to the
facility’s operation, the environment, and the local economy. In addition, VDEQ actively works
with other states and EPA to share ideas in an effort to best support the Virginia small business
community.
3.4 Air Enforcement Activities
The goal of enforcement is to take appropriate actions to address violations of
environmental laws and return facilities to compliance with Virginia’s statutory and regulatory
requirements. The mechanism used by VDEQ to achieve compliance must be proportional to the
violation, responsive to the facility's compliance history, and protective of human health and the
environment. In addition, an appropriate enforcement action, which may include a civil charge
and recovery of economic benefit, sends a message of deterrence to the regulated community.
EPA’s guidance on timely and appropriate enforcement response to high priority
violations (HPVs) articulates the mutual expectations of the respective parties of the federal -
state partnership in the enforcement of air pollution control requirements for stationary sources.
VDEQ’s enforcement staff is responsible for implementing this policy. This policy applies to all
major (as defined by the CAA) stationary sources of air pollution that are in violation of a
federally enforceable regulation and helps prioritize federal and state agency enforcement efforts
with respect to sources of air pollution in their jurisdictions.
Agency HPV activities are designed to identify and to expeditiously return to compliance
those violating sources that the agency believes are environmentally most important, namely the
HPVs. The policy also promotes a more complete and accurate compliance picture and enhances
the responsibility of the agency, as well as EPA, to track and address all violations. An essential
part of this tracking process is assuring that all HPVs are promptly entered into the shared EPA-
state database.
In fiscal year 2010, 28 consent orders were issued (ten of which were HPVs) and resulted
in the collection of $1,203,204 in civil charges.
20
3.5 Motor Vehicle Inspection and Maintenance Program
Vehicle inspection and maintenance programs (I/M) help improve air quality by
identifying high-emitting vehicles in need of repair and causing them to be fixed as a prerequisite
to vehicle registration within a given non-attainment area. The CAA made I/M mandatory for
several areas across the country, based upon criteria such as air quality classification, population,
and/or geographic location. VDEQ created a decentralized I/M program that retains the
convenience of having emissions inspections and repairs performed in the same stations but uses
the latest accepted technology to determine which vehicles emit excessive pollutants.
In 2005, VDEQ updated the program to allow for testing of the on-board diagnostic
(OBD) systems on model year 1996 and newer vehicles. The OBD system monitors key
components of the vehicle’s emission control system, records any diagnostic trouble codes, and
warns the driver if there is a condition that could cause excess emissions. Beginning with model
year 2009, all vehicles up to 14,000 pounds are required by federal mandate to be OBD-
compliant.
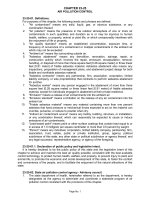
Figure 3-6: 2010 Initial Failures by Vehicle Model Year (Number x 10)
The Northern Virginia I/M program provides significant air pollution reduction benefits
in the Northern Virginia area. Vehicles up to 10,000 pounds gross vehicle weight rating
(GVWR) and newer than 25 model years are required to pass an emissions test or receive a
waiver every two years in order to be registered. As noted in Figure 3-6, just over 40,000
vehicles failed the initial test and received repairs in 2010.