FINANCIAL PRIVACY FOR FREE? US CONSUMERS’ RESPONSE TO FACTA pot
Bạn đang xem bản rút gọn của tài liệu. Xem và tải ngay bản đầy đủ của tài liệu tại đây (914.53 KB, 35 trang )
FINANCIAL PRIVACY FOR FREE?
US
CONSUMERS’ RESPONSE TO FACTA
DRAFT – VERY PRELIMINARY
Alessandro Acquisti
Carnegie Mellon University
Bin Zhang
Carnegie Mellon University
Abstract
In December 2004 the three US credit reporting agencies - Equifax, Experian, and TransUnion -
complied with the Fair and Accurate Credit Transaction Act (FACTA) and started providing free
copies of their credit reports to any consumers who requested it. The FACTA initiative was
overseen by the Federal Trade Commission (FTC) and was significant in many respects: it was
one of the first and largest initiatives by the federal government aiming at alleviating the rising
concerns with identity theft; it forced – an unusual move in the laissez faire panorama of US
privacy legislation - private sector companies to offer some of their products and services for free
to the general public; and it required an uncommon concerted effort by the three credit agencies
to provide reports to an estimated potential pool of 220 million US adults. However, to date, no
data about the public response to the initiative has been provided by the FTC or the reporting
agencies themselves. We present the results of a [institution name’s removed] and Harris
Interactive survey-based study of US consumers’ response to FACTA. The survey was based on a
nationally representative sample of US adults and provides the first look at the success of the
initiative as well as the likely motivations for requesting one’s credit report. Such information can
help us understand consumers’ interest in their financial information and, indirectly, their
sensitivity towards the privacy of their financial data.
Keywords: Privacy, Information Security, Economics, Identity Theft, FACTA, Consumer studies
DRAFT – VERY PRELIMINARY 1
DRAFT – VERY PRELIMINARY
Introduction
Advances in information technology have made it possible to conduct banking, credit, and shopping activities
online. However, they have also exacerbated privacy risks. Imposters online and offline can use consumers’
personal information (such as names, social security numbers, and credit card numbers) to commit a number of
frauds: putting fraudulent charges on a consumer’s credit card, stealing money from his bank account, or even
impersonating him to open a new line of credit. These delinquent accounts will be reported on the victims’ credit
reports and will affect their ability to get credit, insurance, or even jobs.
The Fair and Accurate Credit Transaction Act (FACTA) of 2003 (United States Congress 2003) aimed, among other
things, at helping consumers fight the growing crime of identity theft. Under one of FACTA provisions, consumers
can request and obtain a free copy of their credit report every 12 months, from each of the three nationwide
consumer credit reporting companies: Equifax, Experian, and TransUnion. By inspecting a credit report, consumers
can confirm the accuracy and completeness of their personal information and identify errors or fraud, therefore
guarding themselves against (or lessening the costs and risks of) identity theft. The Act started being enforced in
December 2004, with a regional roll-out strategy that progressively covered the reports of US consumers across the
fifty states by September 1st 2005.
Significant efforts and resources have been spent by legislators and the credit agencies to offer free credit reports to
US consumers. Did they take advantage of this opportunity? Answering this question is important for several
reasons: to evaluate the performance of a large-scale regulatory intervention in the area of financial information and
financial privacy; to address possible shortcomings in its implementation; and to understand consumers’ interest in
information collected about them, and sensitivity towards the protection of that data.
To date, however, almost no information about the public response to the initiative has been provided by the FTC or
the reporting agencies themselves. Since the annual free credit report initiative has been coordinated by the Federal
Trade Commission (FTC) but actually managed by the three credit report agencies, no public information is
available about the response of US consumers, and a FOIA request (Freedom of Information Act) is not applicable.
The credit reporting agencies have been so far mute about the success and consequences of this initiatives, and have
not provided to external parties (including the authors of this paper) access to even aggregate information about it. A
survey instrument therefore is currently the only means for evaluating the FACTA initiative.
In this paper, we present the results of a [institution name’s removed] and Harris Interactive survey-based study of
US consumers’ response to FACTA. Our survey method is not just the only information currently publicly available
about FACTA performance; it also offers two additional advantages over agencies’ data: since consumers who
request their reports under FACTA may not request it from all agencies, a survey instrument may provide less
biased information than data coming from a single agency. Furthermore, it may also cast a light on the motivations
and behavior of those who did not take advantage of the FACTA initiative.
The goals of our research are to understand the response to the FACTA initiative, the demographics of those who
took advantage of it, and their motivations. Consumers’ reaction to FACTA can tell us about consumers’ incentives
to monitor their credit report and protect their financial data. Since protection against identity theft is often linked to
financial privacy, studying FACTA also tells us something about consumers’ sensitivity to the confidentiality of
their private financial information.
As often noted in the literature, privacy is a complex concept, with varied, vague, and at times confusing
interpretations (for an exhaustive taxonomy, see Solove 2006). Clearly, we do not refer in this paper to privacy as
Warren and Brandeis’s (1890) right to be left alone. Rather, the privacy relevance of FACTA is to be related to the
individual’s ability to access, verify, and if needed challenge data about himself (the “Individual participation
principle”, under the OECD’s Fair Information Practices guidelines – see OECD 1980); as well as the individual’s
ability to prevent, stop, or impair others’ ability to gain access to or misuse his personal data. In this regard, the
response to the availability of a free resource to access and control one’s personal credit information can help better
understand US consumers’ privacy sensitivity and actual behavior.
2 DRAFT – VERY PRELIMINARY
DRAFT – VERY PRELIMINARY
Our data was gathered in March 2006, when all consumers across the US had had the possibility of accessing their
report for (at least) seven months. The survey was administered to a representative sample of 2,435 US adults in
concert with Harris Interactive. Our empirical strategy starts with simple analyses that attempt to discern how many
US consumers knew about credit reports and, specifically, about the possibility of obtaining a free one through
FACTA, and how many took advantage of this opportunity (rather than falling for the many scam or look-alike
offers that flourished since FACTA was enacted). Our approach thereafter includes multivariate analysis and
grouped logistic regression models of sign-up frequencies on various combinations of demographic variables and
other factors.
The rest of the paper is organized as follows. We discuss credit reports, credit frauds, and FACTA in Section 2. We
present a literature review in Section 3. In Section 4, we discuss a model of consumer’s credit report request. In
Section 5 we present our empirical approach and in Section 6 we highlight its results. Discussions and ongoing work
complete the paper in Section 7.
Credit reports, credit frauds, and FACTA
Online retailing has boomed in recent years, and so have electronic payments. Because of these developments,
however, the risk of being subject to online frauds, credit frauds, and identity frauds has also increased. Of particular
concern to US consumers is the risk of identity theft - the illegal use of an individual’s personal identifying
information (such as name, address, Social Security number [SSN], and date of birth) to impersonate that person and
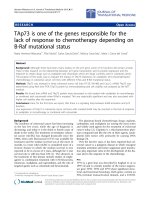
commit financial fraud. Studies completed by Gartner Research and Harris Interactive indicate that from July 2002
to July 2003 alone approximately seven million people were victims of identity theft (Fetterman 2005). The Identity
Theft Resource Center (2003, 2004) sent surveys to victims of this crime. The results indicate that the average
fraudulent charge on victim’s account in 2003 was $92,893, an increase of 416% from 2002’s $18,000. Victims
incur additional costs when attempting to resolve their cases: the average amount spent is $1,495. These fees include
certified return receipt mail, notarizing, telephone calls, court documents, travel expenses, photocopying, court
transcript purchases, police reports, and may not include additional attorney and legal fees, or the opportunity costs
associated with the time lost in the resolution of the fraud.
Consumers’ credit reports
A tool consumers can use to discover and limit the consequences of credit and identity frauds is the periodical
review of their credit reports. A consumer’s credit report (also known as a consumer’s credit history, or credit file
disclosure) is an ongoing report on consumers personal information and how they manage their finances.
Relevant data is typically submitted to a credit reporting agency by creditors, debt collection agencies, court system,
and other public records. There are four categories of information on the report: personal information, public records
DRAFT – VERY PRELIMINARY 3
DRAFT – VERY PRELIMINARY
and collection accounts, credit history and current obligations, and credit inquiries. The personal information
includes full name, social security number, birth date, current and previous addresses, current and past places of
employment, driver’s license number and state where issued. Public records and collection (collected from the court
system and from debt collection agencies) include liens and judgments, bankruptcies, foreclosures, wage
attachments, and accounts in collection. Credit history and current obligations include the dates when accounts were
opened, the types of accounts (revolving, installment loan, mortgage), account balances and credit limits, payment
history for each account, including late payments, unpaid child support and overdrawn checking accounts. Finally,
credit inquiries report the inquiries made when seeking new credit and inquiries made for promotional mailings.
Checking one’s credit report may ensure an early alert about errors and possible fraudulent accounts or activities.
When a consumer discovers fraudulent or inaccurate information on his report, he can take further remedy. The Fair
Credit Reporting Act (FCRA) established procedures for correcting fraudulent information on consumers’ reports.
Under the FCRA, consumers can request both the consumer reporting company and the information provider (such
as a bank or credit card company) to correct fraudulent information. Consumers need to provide evidence of fraud
and companies will block fraudulent information from appearing on the credit report.
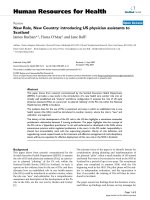
Figure 1. Request form for free credit report through the Internet: A screenshot from the interface of
www.annualcreditreport.com
The Fair and Accurate Credit Transaction Act (FACTA)
A consumer can get a copy of his credit report in several ways (see Table 1). The Fair and Accurate Credit
Transaction Act (FACTA) of 2003 (Public Law 108-159, 117 Stat. 1952) has added a new, no-strings attached, and
widely publicized way to get a free copy of one’s credit.
FACTA was signed into law on December 4th, 2003. It imposes new requirements on consumer reporting services,
including the “obligation to provide, upon request, one free file disclosure - commonly called a credit report - to the
consumer once in a 12-month period” (Federal Trade Commission 2004). It was intended, among other things, to
help consumers fight the growing crime of identity theft. Under FACTA, consumers can request and obtain a free
credit report once every 12 months from each of the three nationwide consumer credit reporting companies, Equifax,
Experian, and TransUnion.
4 DRAFT – VERY PRELIMINARY
DRAFT – VERY PRELIMINARY
Figure 2: Request form for free credit report through mail
How to get FACTA reports
There are three ways of getting one’s credit report under FACTA: via Internet, by mail, or by phone (see Figures 1
and 2).
The three credit agencies have set up a centralized system for all three access channels. When using the Internet,
consumers need to go to a centralized website, www.annualcreditreport.com, and select the State in which
they currently live. After entering their personal information (such as name, birth date, SSN and address), consumers
can choose the agency from which they want to request their report. Only after answering a number of security
questions about their accounts, consumers can actually access their reports.
Consumers can only make Internet requests from one agency each time. Telephone and mail requests instead have
the benefit that consumers can apply for reports from multiple agencies at the same time.
DRAFT – VERY PRELIMINARY 5
DRAFT – VERY PRELIMINARY
Unfortunately, after FACTA was enacted, a number of Internet sites started appearing, offering “free” credit reports
but actually luring consumers into paid services. Some of these sites have been established by the very credit
reporting agencies that were forced by FACTA to offer their reports for free.
1
The sites owned or related to the
credit reporting agencies often provide non conspicuous and sometimes hardly visible links to the FACTA site, with
little or no reference to the free nature of the service that can be obtained from it. These sites cause additional
potential costs to consumers willing to inspect their reports, as well as present them with a dilemma: requesting the
report by phone or mail (with fewer security questions, a centralized request for all agencies, but delayed results –
the report will only be received days later by mail); or requesting the report on the Internet (with more security
questions to answer and time to spend in the process, with increased risk of exposure to scam or paid sites, but with
the immediate gratification of inspecting one’s report immediately, upon completion of the screening phase)?
Literature review
The study which is closest to ours in goals and scope was conducted by Varian, Wallenberg, and Woroch (2004).
Varian et al. studied who signed up for the do-not-call marketing list. After the FTC created a national registry
“DNC” list, on June 27, 2003, 60 million phone numbers had registered by May 2004. Assuming that all the
registered numbers came from different households and that each household included 2.62 people (according to the
Census 2000 – see U.S. Census Bureau 2005), then more than 157 million US residents took advantage of this
opportunity, proving a strong interest in the protection of the privacy of personal phone numbers. Varian et al. find
some relation between demographics variables (such as race, household size, income, and education) and the
propensity to sign up for the DNC list.
Since there exists no comparable study on the response to FACTA, the question about US consumer’s sensitivity to
their financial information and financial privacy remains open.
A random utility model of FACTA credit report request
Financial privacy has become a concern often quoted in surveys of Internet users (see, for instance, Westin 1998,
Ackerman et al. 1999, and Hann et al. 2002). By inspecting their credit report, consumers can confirm the accuracy
and completeness of their personal information, and identify errors or ongoing frauds. Accessing one’s credit report,
therefore, can help guard against identity theft and provides consumers some (limited) form of access and control on
their personal financial information – and other parties’ access to it.
However, even requesting a report under FACTA is not really free. First, a consumer needs to consider the time
spent requesting the report: it will depend on the interface used (mail, phone, or the Internet, with the Internet
possibly being the lengthiest process to complete – because of additional security questions – but the fastest to
produce the report). Second, a consumer needs to consider the (limited, but non-zero) transaction costs (such as
phone calls or stamps to request the report). In addition, consumers face the risk that, by the very act of requesting
their report, they may end up damaging the privacy of their financial information (for example, if their requests –
with the accompanying personal data – were intercepted; or if they fell for scam offers and sites, thus providing
personal information to criminals).
We use standard consumer theory to describe a consumer’s decision to protect her financial privacy and diminish the
potential adverse effects of various credit and identity frauds by requesting a credit report through FACTA. We
describe the individual’s decision process in Figure 3.
First, an individual must know about the existence of credit reports, believe that there exists one about himself,
and know about FACTA. Then, the individual must actually be interested in getting such free copy of his report. We
1
It is telling that the domain for the truly free credit report is www.annualcreditreport.com, while the
domain for one of its paid look-alike is www.freecreditreport.com
6 DRAFT – VERY PRELIMINARY
DRAFT – VERY PRELIMINARY
assume that consumers who know about the availability of free reports will trade-off the expected benefits from
receiving it against the costs of requesting it.
If a consumer doesn’t request a report, with some probability his losses due to undetected credit or identity fraud
will be higher than under the scenario in which the consumer could detect and react to them. Such probability
depends on the likelihood that, in fact, his identity and/or financial information has been targeted by criminals.
Figure 3: Consumer decision tree for credit report request
Other economic models of privacy decision making (such as Taylor 2004 and Acquisti and Varian 2005) have
focused on rational or myopic agents with complete information. Our model, however, needs to deal with the
inherent information asymmetry that characterizes the risk of identity and credit fraud. Therefore we base our
approach on Varian et al.’s (2004) random utility model of do-not-call list registration. In a random utility model,
utility of agent n, u
n
, consists of two parts: a deterministic part v
n
and a stochastic part ε
n
. The stochastic part is due
to the uncertainty associated with the consumer’s incomplete information:
Taking a simplified view of the individual decision process, if a consumer equests his credit report through FACTA,
his utility u
1
n
will be:
DRAFT – VERY PRELIMINARY 7
DRAFT – VERY PRELIMINARY
where:
And p
n
is the probability that the consumer’s identity and/or financial information will be breached.
Checking one’s credit report may ensure an early alert on possible frauds on the consumer’s accounts, and therefore
will help him reduce the expected costs of identity or credit fraud. In other words,
.
This implies that we focus on benefits as reductions of expected losses. Further specification of this model will also
attempt to consider the additional value that consumers may derive from inspecting their report – such as piece of
mind, satisfaction of personal curiosity, and so on.
When the individual does not request, his utility u
0
n
will be:
Individual n will register when u
1
n
> u
0
n
.
Let F(•) be the c.d.f. of the difference between the two distributions. Then the probability of registration is:
If we were to assume that the deterministic part of utility is linear in the variables y
n
and z
n
, i.e.,
then the probability of request is:
8 DRAFT – VERY PRELIMINARY
DRAFT – VERY PRELIMINARY
If we differentiate probability with regard to cost, benefit and loss, we obviously find that the request probability is
decreasing in the cost of request (that is affected by the means chosen to request a FACTA report) and increasing in
the magnitude of the benefit (which may in turn be affected by factors such as the individual’s income). In following
Sections we concentrate our analysis on the role of costs, expected benefits, and various demographic factors
through logistic regressions.
Hypotheses
A number of hypothesis drive our survey design and are tested with the data we present in the rest of this paper.
H1: The probability of FACTA request is positively affected by income
This hypothesis is based on the observation that higher income demographics may have more to lose from credit and
identity frauds, and therefore would have higher incentives to inspect their credit report. However, these higher
incentives should be discounted by the higher probability that those demographics may, in fact, already had access
to their credit reports (something we investigate in our survey).
H2: The probability of FACTA request is positively affected by education
Protection of one’s personal financial information is a more rarefied concept than protection of one’s phone number
and defense of one’s homely piece from marketers and solicitors. In addition, the cognitive costs associated with
properly requesting a FACTA report are higher (see previous Sections). Hence we expect that higher education
demographics will be correlated with higher rates of FACTA requests. However, it may be that higher education
impacts more the probability of knowing about FACTA rather than actually requesting – this would be shown in the
data after controlling for the share of subjects who claim to be familiar with the FACTA initiative.
H3: A share of consumers who believe they have requested a FACTA report may, in fact, have fallen for scam sites
or look-alike paid services
Because of the cognitive costs associated with requesting a FACTA credit report online, and because of the creation
of paid look-alike sites by the same credit agencies that were asked to provide their reports for free (see previous
Section), we expected that a non marginal number of US consumers may have been tricked into paying for what
otherwise would have been a free service.
DRAFT – VERY PRELIMINARY 9
DRAFT – VERY PRELIMINARY
H4: The overall request rate of FACTA report will be lower than the registration rates to the do-not-call list.
This hypothesis is based on a combination of observations: the FACTA initiative 1) affects a smaller number of
individuals (fewer consumers have credit lines than they have phone numbers); 2) focuses on a form of protection
which may be valued by consumers less than protection of their personal phone number; 3) is more costly (in terms
of transaction and cognitive costs) to adopt; 4) may have been less publicized.
In particular, our current dataset allows to contrast FACTA requests by demographics and contrast them to the
results report in Varian et al. (2004).
An empirical study of US consumers’ response to FACTA
Since no credit reporting agency has so far provided data about the impact of the FACTA initiative, and since no
FOIA request is possible in this context (the FTC supervised FACTA implementation but did not gather any data
itself), a survey instrument is the only tool currently available to the public to evaluate US consumers’ response to
the Act.
Survey instrument
Our survey instrument is informed by the FACTA request decision tree reported in Figure 3, and the model reported
in the previous Section: in order to request a free copy of his credit report, an individual must know about the
existence of credit reports, believe to have one, and know about FACTA. He must also be interested in getting a
copy of this report and believe that the costs of doing so will be compensated by the benefits.
2
Accordingly, Figure 4 offers an overview of the logical flow of the survey, and the Appendix reports the complete
list of questions. Respondents were asked questions about their knowledge of credit reports, free reports, and
FACTA, and about their credit requesting behavior - related and unrelated to FACTA. In addition, we obtained a
number of demographic variables, including gender, age, education, income, race, and so on.
Our survey was administered online to a sample of 2,435 US adults in concern with Harris Interactive in March
2006. The size and nature of the sample makes it representative of the US adult population.
3
Harris Poll Online
surveys are based on panels of online respondents consisting of several million individuals, recruited through several
channels. Several sample selection and propensity score matching methodologies were adopted to make sure that the
2
As mentioned above, we are currently focusing on benefits as reductions of expected losses from credit and
identity frauds. Further specifications of our model will also investigate the additional value that consumers may
derive from inspecting their report (piece of mind, satisfaction of personal curiosity, etc.).
3
Because of delays in the reception of the survey results, the rest of our empirical analysis should not be considered
as final, but rather as subject to further study, specification, and expansion.
10 DRAFT – VERY PRELIMINARY
DRAFT – VERY PRELIMINARY
results were as representative as possible of both online and offline US populations.
4
Our survey intentionally over-
sampled richer demographics, as one of our hypotheses was that those demographics would be more likely to
request FACTA reports, but also numerically so small as to not provide us with enough power of analysis in
multivariate regressions. Of course, our results below are presented after the appropriate weighting was used to
return our sample to a nationally representative composition of respondents.
The first goal of our research is to describe the response of US consumers to the FACTA act. This is discussed
immediately below. Following that, we will present an analysis of the relationships between demographic categories
and the observed frequency of credit report requests. Finally, we will present regression analysis (and, specifically,
grouped logistical models) of request frequencies on various combinations of demographic variables and other
factors, based on the model presented earlier.
Descriptive Statistics
The majority of our sample claimed to know what a credit report is (Table 2) and what a credit score is (Table 3),
although fewer Americans are confident with the latter concept.
5
Most of the individuals who know about the existence of credit reports also believe that there is one about them (this
number includes both people who, in other questions, responded that they had obtained at least once their report, as
well as people who have never done so - see Table 4).
4
A representative of one of the three credit agencies reported to us in private, confidential discussion, that “around
80 to 85%” of their FACTA requests were submitted on the Internet. This fact, together with the sampling and
propensity score methods applied to our sample, make us quite confident that the results of our online survey are
actually representative of the US population.
5
Note that the titles of the Tables report shortened versions of the actual questions that our subjects were asked. See
the Appendix for the actual text.
DRAFT – VERY PRELIMINARY 11
DRAFT – VERY PRELIMINARY
Figure 4: Survey logical flow
12 DRAFT – VERY PRELIMINARY
DRAFT – VERY PRELIMINARY
Before asking about FACTA, we investigated how many of our respondents believed that there were ways to obtain
their credit report for free (Table 5). Interestingly, almost 74% of our subjects know that it is possible to get a free
credit report.
Next, we asked specifically whether the respondent had heard about the opportunity of getting one free credit report
a year from the three credit agencies, and we specified that this was the so-called “FACTA” initiative (for the exact
text of the question, please see the Appendix).
Our results are reported in Table 6. The total number of people who claim they have heard about the FACTA
initiative is almost identical (in fact, the people who answered “yes” to the previous question are also the people
who answered “yes” to the second one; the correlation is very high: Pearson chi2(4) is 786.6209).
However, we can also find a larger number of people who have actually never heard about the program, rather than
just being unsure about it (compare Table 5 and Table 6).
DRAFT – VERY PRELIMINARY 13
DRAFT – VERY PRELIMINARY
The fact that so many people have heard of FACTA may be considered surprising, considered the relatively high
sophistication of the domain of interest. However, an obvious concern is how well people actually know about this
initiative.
To ascertain this we asked a number of follow-up questions.
First, we asked individuals who had claimed to know about FACTA (or not being sure about it) whether they
thought that the credit report one can obtain under this legislation contained or not also their credit score (it does
not). As reported in Table 7, a large fraction of our respondents thought (incorrectly) that the free credit report they
can order every year from the three agencies also contain their credit score (note that these results do not change
when controlling only for people who answered to know FACTA. The only difference between the group unsure
about FACTA and the group that claims to know about it is that the former is also more likely to be uncertain about
whether FACTA report include credit scores; the latter tend to be less uncertain, and more often wrong).
To people who did not know (or were not sure to know) FACTA, we asked whether they would have some interest
in receiving a free copy of their report (Table 8). Almost 58% of the respondents claimed to be interested -
conditional to the answer described in Table 6, this means that around 386 respondents in our sample (almost 17%)
14 DRAFT – VERY PRELIMINARY
DRAFT – VERY PRELIMINARY
may be in fact want to receive a free copy of their report, but do not because they do not know about this
opportunity (we present below in Section a number of cross-tabulations and regressions that cast some light about
who these individuals may be). Since our sample of 2435 is quite representative of US adults, the number of people
falling in this category is, in absolute terms, quite significant
How many used FACTA to obtain a free report?
How many people actually took advantage of FACTA to get a free copy of their report? Answering this question is
not trivial, because getting a report under FACTA is not, in itself, a trivial task.
First, the subject must know what a credit report is and care to have a recent copy of it. Second, the subject must
know about FACTA. Third, and perhaps even more importantly, the subject must be able to find out how, exactly,
she can get her FACTA report and must be willing to go over the process of actually ordering a report.
Such process can be: confusing, because of the large number of copy-cat sites or scam sites described above, that
lure consumers into providing their information or pay a fee to get what in reality should be a completely free
product; risky, because of the risk of revealing personal information to malicious entities; time consuming, especially
for requests completed by Internet, because the consumer needs to complete three separate processes (one with each
credit agency), and answer various sets of questions (including trick questions, designed to avoid providing one’s
credit score to the wrong individual).
For similar reasons, it is not always possible to determine with certainty through a survey instrument whether a
subject really requested a free report under FACTA or not. She could have fallen victim of a scam site and never
have received her report, for instance. Or she could have fallen for one of the many FACTA look alike sites that
advertise “free credit reports” only for luring consumers into buying additional services or products.
DRAFT – VERY PRELIMINARY 15
DRAFT – VERY PRELIMINARY
Our survey was designed with this uncertainties and intrinsic ambiguities in mind, and a number of follow up
questions were asked to try to ascertain a level of confidence on whether the individual had indeed requested a
FACTA report or not.
Let us start from Table 9. A staggering 42% of our sample answered ‘yes’ or ‘yes, but I am not sure it was under
FACTA’ to the question: “Did you ever ask a copy of your credit report under FACTA?” Actually, only 27.3% of
the sample are sure it was FACTA - the rest could not be sure.
The vast majority of respondents who claimed to have requested a credit report under FACTA did so by Internet
(Table 10). The fraction found in the sample (78%) is very close to the actual fraction that a representative of one of
the three credit agencies reported to us (80-85%). This is a result that we plan to investigate more, since it shows the
preference towards a medium that offers immediate satisfaction of the consumer’s desire to see his report, at the
price of (possibly) higher transactions and cognitive costs (see previous Sections).
Next, we asked our respondents whether they were offered additional services or products when they requested their
free report. In particular, we asked whether additional services or products were offered as a condition to actually
receive their report, or not. FACTA reports are completely free. When requested by phone or on the Internet, no
other offer is made by the agencies. When requested on the Internet, some of the agencies propose additional
packages, but not as conditions to get one’s report.
Of the subjects who answered unconditional ‘yes’ to the question described in Table 9, almost 13% were offered
services as conditions to get their report. With some margin of error due to the survey nature of the data, we can
infer that most of these individuals, in fact, did (not) really ask a report under FACTA. They represent around 8% of
subjects who had answered with confidence that they requested a report under FACTA, and around 22% of those
who were not sure whether they had requested a report under FACTA or not.
This, alone, brings down the percentage of respondents who may have requested FACTA reports down to 36%.
Controlling also for the way subjects chose to request their report, and knowing that FACTA reports could only be
asked via Internet, phone, or mail, and that phone or mail requesters could not be offered additional services, we can
make similar inferences and bring down the above number to around 35% (24% confident they requested their free
report under FACTA, 11% not sure). In other words, we can estimate a lower bound of US adults that requested a
free credit report under FACTA as 24%, and an higher bound at 35%.
16 DRAFT – VERY PRELIMINARY
DRAFT – VERY PRELIMINARY
It is important to add that not everybody who asked for their free report under FACTA (or thought she did) actually
received it: Table 13 shows that almost 18% of our sample either did not receive the report from the only single
agency they requested it from, or did not receive it at least from one of them. We found a significant correlation
(Pearson chi_2(3) = 28.2858) between being use or not of having requested a free credit report under FACTA and
having actually received it: respondents who were not sure were also more likely to report not having received all
requested reports (a Wilcoxon-Mann-Whitney ranksum test for the equality of the distributions strongly reject the
null hypothesis: z = -4.465, Prob > |z| = 0.0000).
Nevertheless, FACTA seems to have played a role in connecting individuals to their credit reports for the first time:
Table 12 shows that 12% of our respondents received their report only and for the first time under FACTA - this is a
relatively high number, equivalent to more than a quarter of individuals that, before FACTA, had never seen their
credit report.
Why did people ask or did not ask their report? We provide some charts and figures.
DRAFT – VERY PRELIMINARY 17
DRAFT – VERY PRELIMINARY
Figures 5 and 6 are based on the answers to Likert-scale questions about respondents’ motivations to request (or not
to request) a free credit report under FACTA. The 7-point Likert-scales range from “Strongly disagree” (with a
certain explanation of motivation) to “Strongly agree” (with a certain explanation or motivation).
Curiosity about one’s credit report information and interest in checking any error are the most agreed upon reasons
listed by our respondents for taking advantage of the FACTA credit report opportunity (Figure 5).
18 DRAFT – VERY PRELIMINARY
DRAFT – VERY PRELIMINARY
Among the reasons not to request one’s report, respondents mostly reported not being interested - although also not
knowing about the opportunity or how to take advantage of it played an important role (Figure 6).
DRAFT – VERY PRELIMINARY 19
DRAFT – VERY PRELIMINARY
Multivariate analysis and logistic regressions
We discuss here some relations between knowledge of FACTA, credit reports, or FACTA request, and demographic
variables. Tables 14, 15, 16, and 17 offer examples of such analyses. Knowledge of FACTA and FACTA request
rates seem to be correlated with age and income. The relation with age is follows and inverted U-shape: the
youngest and oldest demographics are less likely to know and to have requested FACTA reports. The relation
between knowledge and request on one side and education and income on the other is more monotonic, and
increasing. These relations are statistically significant under chi_2 tests. However, we specify below a series of
20 DRAFT – VERY PRELIMINARY
DRAFT – VERY PRELIMINARY
logistic model (inspired by the request model presented in the Section “A random utility model of credit report
request”) to disentangle the effects of these various variables on the probability of knowing FACTA and requesting
a free report through FACTA.
We consider as predictor variables gender, age, region of resident, marital status, employment status, education
level, income level and race.
First, we study the probability of knowing about the FACTA initiative – without which it would not be possible to
make a FACTA request:
EmploymentMaritalgionAgeGenderKnowFACTA
543210
Re)(logit
ββββββ
+++++=
RaceIncomeEducation
876
βββ
+++
In general, this model is significant (Wald F (41) = 156.8718, p < 0.0001; Likelihood Ratio (41) = 192.3814, p
<.0001).
T
T
a
a
b
b
l
l
e
e
1
1
5
5
:
:
T
T
y
y
p
p
e
e
3
3
A
A
n
n
a
a
l
l
y
y
s
s
i
i
s
s
o
o
f
f
E
E
f
f
f
f
e
e
c
c
t
t
s
s
W
W
a
a
l
l
d
d
E
E
f
f
f
f
e
e
c
c
t
t
D
D
F
F
C
C
h
h
i
i
-
-
S
S
q
q
u
u
a
a
r
r
e
e
P
P
r
r
>
>
C
C
h
h
i
i
S
S
q
q
M
M
a
a
l
l
e
e
1
1
0
0
.
.
0
0
7
7
1
1
8
8
0
0
.
.
7
7
8
8
8
8
7
7
A
A
g
g
e
e
1
1
3
3
.
.
8
8
2
2
6
6
8
8
0
0
.
.
0
0
5
5
0
0
4
4
R
R
e
e
g
g
i
i
o
o
n
n
3
3
5
5
.
.
9
9
1
1
3
3
4
4
0
0
.
.
1
1
1
1
5
5
9
9
M
M
a
a
r
r
i
i
t
t
a
a
l
l
s
s
t
t
a
a
t
t
u
u
s
s
5
5
9
9
.
.
6
6
5
5
5
5
2
2
0
0
.
.
0
0
8
8
5
5
6
6
E
E
m
m
p
p
s
s
t
t
a
a
t
t
u
u
s
s
7
7
8
8
.
.
1
1
0
0
6
6
6
6
0
0
.
.
3
3
2
2
3
3
3
3
E
E
d
d
u
u
c
c
a
a
t
t
i
i
o
o
n
n
7
7
5
5
1
1
.
.
2
2
6
6
7
7
4
4
<
<
.
.
0
0
0
0
0
0
1
1
I
I
n
n
c
c
o
o
m
m
e
e
1
1
0
0
4
4
3
3
.
.
7
7
8
8
3
3
8
8
<
<
.
.
0
0
0
0
0
0
1
1
R
R
a
a
c
c
e
e
7
7
1
1
6
6
.
.
3
3
9
9
0
0
8
8
0
0
.
.
0
0
2
2
1
1
8
8
Predictor variables age (χ
2
= 3.8268, p = 0.0504), education ( χ
2
= 51.2674, p < 0.0001), income ( χ
2
= 48.7838, p <
0.0001), and race ( χ
2
= 16.3908, p = 0.0218) are significant at the 0.05 level. Marital status ( χ
2
= 9.6552, p =
0.0856) is significant at 0.10 level (see Table 15).
DRAFT – VERY PRELIMINARY 21
DRAFT – VERY PRELIMINARY
22 DRAFT – VERY PRELIMINARY
Specifically, when running odds-ratio estimates, we can find out that
holding other variables constant, for each year
increase in the respondents age, the odds of knowing FACTA increases by 1.011 times.
T
T
a
a
b
b
l
l
e
e
1
1
6
6
:
:
O
O
d
d
d
d
s
s
R
R
a
a
t
t
i
i
o
o
E
E
s
s
t
t
i
i
m
m
a
a
t
t
e
e
s
s
P
P
o
o
i
i
n
n
t
t
9
9
5
5
%
%
W
W
a
a
l
l
d
d
E
E
f
f
f
f
e
e
c
c
t
t
E
E
s
s
t
t
i
i
m
m
a
a
t
t
e
e
C
C
o
o
n
n
f
f
i
i
d
d
e
e
n
n
c
c
e
e
L
L
i
i
m
m
i
i
t
t
s
s
R
R
e
e
g
g
i
i
o
o
n
n
4
4
v
v
s
s
1
1
0
0
.
.
9
9
0
0
7
7
0
0
.
.
6
6
5
5
2
2
1
1
.
.
2
2
6
6
1
1
R
R
e
e
g
g
i
i
o
o
n
n
3
3
v
v
s
s
1
1
1
1
.
.
0
0
9
9
0
0
0
0
.
.
8
8
0
0
4
4
1
1
.
.
4
4
7
7
8
8
R
R
e
e
g
g
i
i
o
o
n
n
2
2
v
v
s
s
1
1
0
0
.
.
7
7
6
6
6
6
0
0
.
.
5
5
5
5
5
5
1
1
.
.
0
0
5
5
8
8
(
(
R
R
e
e
g
g
i
i
o
o
n
n
1
1
=
=
E
E
a
a
s
s
t
t
,
,
R
R
e
e
g
g
i
i
o
o
n
n
2
2
=
=
M
M
i
i
d
d
w
w
e
e
s
s
t
t
,
,
R
R
e
e
g
g
i
i
o
o
n
n
3
3
=
=
S
S
o
o
u
u
t
t
h
h
,
,
R
R
e
e
g
g
i
i
o
o
n
n
4
4
=
=
W
W
e
e
s
s
t
t
)
)
Although Region is not a significant factor, we still can see some difference about knowledge of FACTA in different
regions. South has the highest rate of knowing FACTA, while midwest has the lowest odds.
T
T
a
a
b
b
l
l
e
e
1
1
7
7
:
:
O
O
d
d
d
d
s
s
R
R
a
a
t
t
i
i
o
o
E
E
s
s
t
t
i
i
m
m
a
a
t
t
e
e
s
s
P
P
o
o
i
i
n
n
t
t
9
9
5
5
%
%
W
W
a
a
l
l
d
d
E
E
f
f
f
f
e
e
c
c
t
t
E
E
s
s
t
t
i
i
m
m
a
a
t
t
e
e
C
C
o
o
n
n
f
f
i
i
d
d
e
e
n
n
c
c
e
e
L
L
i
i
m
m
i
i
t
t
s
s
E
E
d
d
u
u
7
7
v
v
s
s
1
1
4
4
.
.
3
3
5
5
5
5
1
1
.
.
1
1
1
1
0
0
1
1
7
7
.
.
0
0
7
7
7
7
E
E
d
d
u
u
6
6
v
v
s
s
1
1
8
8
.
.
9
9
6
6
8
8
1
1
.
.
8
8
2
2
6
6
4
4
4
4
.
.
0
0
3
3
3
3
E
E
d
d
u
u
5
5
v
v
s
s
1
1
7
7
.
.
6
6
2
2
9
9
2
2
.
.
0
0
1
1
1
1
2
2
8
8
.
.
9
9
4
4
9
9
E
E
d
d
u
u
7
7
0
0
v
v
s
s
1
1
5
5
.
.
1
1
6
6
1
1
1
1
.
.
3
3
4
4
0
0
1
1
9
9
.
.
8
8
7
7
4
4
E
E
d
d
u
u
4
4
v
v
s
s
1
1
2
2
.
.
9
9
5
5
8
8
0
0
.
.
8
8
0
0
2
2
1
1
0
0
.
.
9
9
0
0
6
6
E
E
d
d
u
u
3
3
v
v
s
s
1
1
2
2
.
.
2
2
3
3
2
2
0
0
.
.
6
6
1
1
9
9
8
8
.
.
0
0
5
5
5
5
E
E
d
d
u
u
2
2
v
v
s
s
1
1
2
2
.
.
0
0
3
3
8
8
0
0
.
.
5
5
1
1
5
5
8
8
.
.
0
0
6
6
7
7
(
(
1
1
=
=
L
L
e
e
s
s
s
s
t
t
h
h
a
a
n
n
h
h
i
i
g
g
h
h
s
s
c
c
h
h
o
o
o
o
l
l
,
,
2
2
=
=
s
s
o
o
m
m
e
e
h
h
i
i
g
g
h
h
s
s
c
c
h
h
o
o
o
o
l
l
,
,
3
3
=
=
H
H
i
i
g
g
h
h
s
s
c
c
h
h
o
o
o
o
l
l
,
,
4
4
=
=
S
S
o
o
m
m
e
e
c
c
o
o
l
l
l
l
e
e
g
g
e
e
,
,
5
5
=
=
C
C
o
o
l
l
l
l
e
e
g
g
e
e
,
,
6
6
=
=
S
S
o
o
m
m
e
e
g
g
r
r
a
a
d
d
u
u
a
a
t
t
e
e
s
s
c
c
h
h
o
o
o
o
l
l
,
,
7
7
=
=
g
g
r
r
a
a
d
d
u
u
a
a
t
t
e
e
s
s
c
c
h
h
o
o
o
o
l
l
,
,
7
7
0
0
=
=
a
a
s
s
s
s
o
o
c
c
i
i
a
a
t
t
e
e
d
d
e
e
g
g
r
r
e
e
e
e
)
)
The impact of education is presented in Table 17. The likelihood of knowing about FACTA follows a linear
relationship with education. As level of education increases, the odds of knowing FACTA increase.
T
T
a
a
b
b
l
l
e
e
1
1
8
8
:
:
O
O
d
d
d
d
s
s
R
R
a
a
t
t
i
i
o
o
E
E
s
s
t
t
i
i
m
m
a
a
t
t
e
e
s
s
P
P
o
o
i
i
n
n
t
t
9
9
5
5
%
%
W
W
a
a
l
l
d
d
E
E
f
f
f
f
e
e
c
c
t
t
E
E
s
s
t
t
i
i
m
m
a
a
t
t
e
e
C
C
o
o
n
n
f
f
i
i
d
d
e
e
n
n
c
c
e
e
L
L
i
i
m
m
i
i
t
t
s
s
I
I
n
n
c
c
o
o
m
m
e
e
1
1
1
1
v
v
s
s
1
1
6
6
.
.
2
2
6
6
4
4
0
0
.
.
8
8
9
9
5
5
4
4
3
3
.
.
8
8
3
3
9
9
I
I
n
n
c
c
o
o
m
m
e
e
1
1
0
0
v
v
s
s
1
1
2
2
1
1
.
.
7
7
9
9
2
2
2
2
.
.
0
0
1
1
0
0
2
2
3
3
6
6
.
.
2
2
0
0
9
9
I
I
n
n
c
c
o
o
m
m
e
e
9
9
v
v
s
s
1
1
5
5
.
.
4
4
1
1
5
5
1
1
.
.
8
8
7
7
3
3
1
1
5
5
.
.
6
6
4
4
9
9
I
I
n
n
c
c
o
o
m
m
e
e
8
8
v
v
s
s
1
1
3
3
.
.
1
1
8
8
5
5
1
1
.
.
4
4
6
6
8
8
6
6
.
.
9
9
1
1
0
0
I
I
n
n
c
c
o
o
m
m
e
e
7
7
v
v
s
s
1
1
3
3
.
.
2
2
1
1
3
3
1
1
.
.
8
8
3
3
6
6
5
5
.
.
6
6
2
2
2
2
I
I
n
n
c
c
o
o
m
m
e
e
6
6
v
v
s
s
1
1
2
2
.
.
2
2
8
8
2
2
1
1
.
.
4
4
2
2
3
3
3
3
.
.
6
6
5
5
9
9
I
I
n
n
c
c
o
o
m
m
e
e
5
5
v
v
s
s
1
1
2
2
.
.
2
2
6
6
2
2
1
1
.
.
4
4
8
8
8
8
3
3
.
.
4
4
3
3
9
9
I
I
n
n
c
c
o
o
m
m
e
e
4
4
v
v
s
s
1
1
1
1
.
.
2
2
4
4
2
2
0
0
.
.
8
8
1
1
8
8
1
1
.
.
8
8
8
8
6
6
I
I
n
n
c
c
o
o
m
m
e
e
3
3
v
v
s
s
1
1
1
1
.
.
7
7
4
4
5
5
1
1
.
.
1
1
2
2
6
6
2
2
.
.
7
7
0
0
4
4
I
I
n
n
c
c
o
o
m
m
e
e
2
2
v
v
s
s
1
1
1
1
.
.
2
2
8
8
7
7
0
0
.
.
8
8
3
3
9
9
1
1
.
.
9
9
7
7
4
4
(
(
1
1
=
=
<
<
1
1
5
5
,
,
0
0
0
0
0
0
,
,
2
2
=
=
1
1
5
5
,
,
0
0
0
0
0
0
-
-
2
2
4
4
,
,
9
9
9
9
9
9
,
,
3
3
=
=
2
2
5
5
,
,
0
0
0
0
0
0
-
-
3
3
4
4
,
,
9
9
9
9
9
9
,
,
4
4
=
=
3
3
5
5
,
,
0
0
0
0
0
0
-
-
4
4
9
9
,
,
9
9
9
9
9
9
,
,
5
5
=
=
5
5
0
0
,
,
0
0
0
0
0
0
-
-
7
7
4
4
,
,
9
9
9
9
9
9
,
,
6
6
=
=
7
7
5
5
,
,
0
0
0
0
0
0
-
-
9
9
9
9
,
,
9
9
9
9
9
9
7
7
=
=
1
1
0
0
0
0
,
,
0
0
0
0
0
0
-
-
1
1
2
2
4
4
,
,
9
9
9
9
9
9
,
,
8
8
=
=
1
1
2
2
5
5
,
,
0
0
0
0
0
0
-
-
1
1
4
4
9
9
,
,
9
9
9
9
9
9
,
,
9
9
=
=
1
1
5
5
0
0
,
,
0
0
0
0
0
0
-
-
1
1
9
9
9
9
,
,
9
9
9
9
9
9
,
,
1
1
0
0
=
=
1
1
9
9
9
9
,
,
9
9
9
9
9
9
-
-
2
2
4
4
9
9
,
,
9
9
9
9
9
9
,
,
1
1
1
1
=
=
>
>
2
2
5
5
0
0
,
,
0
0
0
0
0
0
)
)
DRAFT – VERY PRELIMINARY
DRAFT – VERY PRELIMINARY 23
The likelihood of knowing FACTA also shows a linear relationship with income (Table 18). We can observe that, as
the amount of income increases, the odds of knowing FACTA increase as well. For a respondent having income
between $15,000 and $24,999, his odds of knowing FACTA is 1.287 times higher than that of a respondent with
income less than $15,000. People who have income between $200,000 and $249,999 have the highest odds, which is
21.792 times higher than that of people with income less than $15,000. This ratio is drastically higher than any other
categories and is significant (0.0653).
Next, we focus on the probability that an individual actually requests a copy of his credit report through FACTA.
We restrict our analysis to the subjects who, in fact, claimed to know about the existence of the initiative:
EmploymentMarritalgionAgeGenderknowportFACTAquest
543210
Re)FACTA |Re (Relogit
ββββββ
+++++=
RaceIncomeEducation
876
βββ
+++
T
T
a
a
b
b
l
l
e
e
1
1
9
9
:
:
T
T
y
y
p
p
e
e
3
3
A
A
n
n
a
a
l
l
y
y
s
s
i
i
s
s
o
o
f
f
E
E
f
f
f
f
e
e
c
c
t
t
s
s
W
W
a
a
l
l
d
d
E
E
f
f
f
f
e
e
c
c
t
t
D
D
F
F
C
C
h
h
i
i
-
-
S
S
q
q
u
u
a
a
r
r
e
e
P
P
r
r
>
>
C
C
h
h
i
i
S
S
q
q
M
M
a
a
l
l
e
e
1
1
0
0
.
.
2
2
6
6
0
0
0
0
0
0
.
.
6
6
1
1
0
0
2
2
A
A
g
g
e
e
1
1
1
1
.
.
3
3
8
8
3
3
0
0
0
0
.
.
2
2
3
3
9
9
6
6
R
R
e
e
g
g
i
i
o
o
n
n
3
3
8
8
.
.
5
5
8
8
7
7
7
7
0
0
.
.
0
0
3
3
5
5
3
3
M
M
a
a
r
r
i
i
t
t
a
a
l
l
s
s
t
t
a
a
t
t
u
u
s
s
5
5
1
1
8
8
.
.
9
9
3
3
9
9
7
7
0
0
.
.
0
0
0
0
2
2
0
0
E
E
m
m
p
p
s
s
t
t
a
a
t
t
u
u
s
s
7
7
1
1
6
6
.
.
1
1
9
9
9
9
1
1
0
0
.
.
0
0
2
2
3
3
4
4
E
E
d
d
u
u
c
c
a
a
t
t
i
i
o
o
n
n
7
7
2
2
5
5
.
.
2
2
6
6
5
5
6
6
0
0
.
.
0
0
0
0
0
0
7
7
I
I
n
n
c
c
o
o
m
m
e
e
1
1
0
0
1
1
8
8
.
.
7
7
4
4
4
4
4
4
0
0
.
.
0
0
4
4
3
3
6
6
R
R
a
a
c
c
e
e
7
7
1
1
9
9
.
.
1
1
9
9
7
7
4
4
0
0
.
.
0
0
0
0
7
7
6
6
Table 19 presents a cumulative analysis of effects. Region ( χ
2
= 8.5877, p = 0.0353), marital status ( χ
2
= 18.9397, p
= 0.002), employment status ( χ
2
= 16.1991, p = 0.0234), education ( χ
2
= 25.2656, p = 0.0007), income ( χ
2
=
18.7444, p = 0.0436), and race (q244, χ
2
= 19.1974, p = 0.0076) are in fact significant at the 0.05 level.
The odds presented in Tables 20 are based on the regression coefficients. They show that the relation between
income and FACTA request rates remain (mostly) monotonic and increasing (confirming one of our hypotheses);
while the relation between education and FACTA request rates is no longer so, once we control for knowledge of
the FACTA initiative.
T
T
a
a
b
b
l
l
e
e
2
2
0
0
:
:
O
O
d
d
d
d
s
s
R
R
a
a
t
t
i
i
o
o
E
E
s
s
t
t
i
i
m
m
a
a
t
t
e
e
s
s
(
(
s
s
e
e
l
l
e
e
c
c
t
t
e
e
d
d
v
v
a
a
r
r
i
i
a
a
b
b
l
l
e
e
s
s
)
)
P
P
o
o
i
i
n
n
t
t
9
9
5
5
%
%
W
W
a
a
l
l
d
d
E
E
f
f
f
f
e
e
c
c
t
t
E
E
s
s
t
t
i
i
m
m
a
a
t
t
e
e
C
C
o
o
n
n
f
f
i
i
d
d
e
e
n
n
c
c
e
e
L
L
i
i
m
m
i
i
t
t
s
s
M
M
a
a
l
l
e
e
2
2
v
v
s
s
1
1
0
0
.
.
9
9
3
3
2
2
0
0
.
.
7
7
1
1
0
0
1
1
.
.
2
2
2
2
3
3
A
A
g
g
e
e
0
0
.
.
9
9
9
9
3
3
0
0
.
.
9
9
8
8
1
1
1
1
.
.
0
0
0
0
5
5
E
E
d
d
u
u
7
7
0
0
v
v
s
s
1
1
0
0
.
.
8
8
1
1
0
0
0
0
.
.
1
1
1
1
6
6
5
5
.
.
6
6
2
2
9
9
E
E
d
d
u
u
7
7
v
v
s
s
1
1
0
0
.
.
6
6
2
2
8
8
0
0
.
.
0
0
9
9
0
0
4
4
.
.
3
3
6
6
8
8
E
E
d
d
u
u
6
6
v
v
s
s
1
1
0
0
.
.
2
2
7
7
1
1
0
0
.
.
0
0
3
3
6
6
2
2
.
.
0
0
5
5
0
0
E
E
d
d
u
u
5
5
v
v
s
s
1
1
0
0
.
.
3
3
9
9
8
8
0
0
.
.
0
0
5
5
9
9
2
2
.
.
6
6
9
9
2
2
DRAFT – VERY PRELIMINARY
24 DRAFT – VERY PRELIMINARY
E
E
d
d
u
u
4
4
v
v
s
s
1
1
0
0
.
.
3
3
2
2
2
2
0
0
.
.
0
0
4
4
8
8
2
2
.
.
1
1
7
7
7
7
E
E
d
d
u
u
3
3
v
v
s
s
1
1
0
0
.
.
3
3
0
0
5
5
0
0
.
.
0
0
4
4
6
6
2
2
.
.
0
0
2
2
7
7
E
E
d
d
u
u
2
2
v
v
s
s
1
1
0
0
.
.
5
5
1
1
0
0
0
0
.
.
0
0
6
6
6
6
3
3
.
.
9
9
3
3
1
1
I
I
n
n
c
c
o
o
m
m
e
e
1
1
1
1
v
v
s
s
1
1
1
1
.
.
9
9
8
8
0
0
0
0
.
.
5
5
2
2
7
7
7
7
.
.
4
4
4
4
5
5
I
I
n
n
c
c
o
o
m
m
e
e
1
1
0
0
v
v
s
s
1
1
3
3
.
.
0
0
6
6
2
2
0
0
.
.
9
9
5
5
4
4
9
9
.
.
8
8
2
2
8
8
I
I
n
n
c
c
o
o
m
m
e
e
9
9
v
v
s
s
1
1
3
3
.
.
0
0
0
0
5
5
1
1
.
.
2
2
8
8
9
9
7
7
.
.
0
0
0
0
7
7
I
I
n
n
c
c
o
o
m
m
e
e
8
8
v
v
s
s
1
1
2
2
.
.
8
8
0
0
0
0
1
1
.
.
2
2
8
8
2
2
6
6
.
.
1
1
1
1
5
5
I
I
n
n
c
c
o
o
m
m
e
e
7
7
v
v
s
s
1
1
1
1
.
.
8
8
1
1
2
2
0
0
.
.
9
9
4
4
4
4
3
3
.
.
4
4
7
7
8
8
I
I
n
n
c
c
o
o
m
m
e
e
6
6
v
v
s
s
1
1
2
2
.
.
1
1
8
8
6
6
1
1
.
.
1
1
7
7
9
9
4
4
.
.
0
0
5
5
5
5
I
I
n
n
c
c
o
o
m
m
e
e
5
5
v
v
s
s
1
1
2
2
.
.
2
2
9
9
6
6
1
1
.
.
2
2
7
7
4
4
4
4
.
.
1
1
3
3
7
7
I
I
n
n
c
c
o
o
m
m
e
e
4
4
v
v
s
s
1
1
2
2
.
.
6
6
5
5
2
2
1
1
.
.
4
4
3
3
7
7
4
4
.
.
8
8
9
9
2
2
I
I
n
n
c
c
o
o
m
m
e
e
3
3
v
v
s
s
1
1
3
3
.
.
1
1
5
5
4
4
1
1
.
.
6
6
9
9
7
7
5
5
.
.
8
8
6
6
1
1
I
I
n
n
c
c
o
o
m
m
e
e
2
2
v
v
s
s
1
1
1
1
.
.
7
7
8
8
7
7
0
0
.
.
9
9
4
4
8
8
3
3
.
.
3
3
6
6
8
8
We present in Tables 21 a comparison of the significance of various demographic variables across three independent
variables: knowledge of FACTA, FACTA request, and registration to the do-not-call list (from Varian et al. 2004).
T
T
a
a
b
b
l
l
e
e
2
2
1
1
:
:
C
C
o
o
m
m
p
p
a
a
r
r
i
i
s
s
o
o
n
n
o
o
f
f
s
s
i
i
g
g
n
n
i
i
f
f
i
i
c
c
a
a
n
n
t
t
p
p
r
r
e
e
d
d
i
i
c
c
t
t
o
o
r
r
s
s
,
,
o
o
d
d
d
d
s
s
r
r
a
a
t
t
i
i
o
o
s
s
S
S
i
i
g
g
n
n
i
i
f
f
i
i
c
c
a
a
n
n
t
t
I
I
n
n
d
d
e
e
p
p
e
e
n
n
d
d
e
e
n
n
t
t
V
V
a
a
r
r
i
i
a
a
b
b
l
l
e
e
s
s
K
K
n
n
o
o
w
w
F
F
A
A
C
C
T
T
A
A
R
R
e
e
q
q
u
u
e
e
s
s
t
t
F
F
A
A
C
C
T
T
A
A
D
D
o
o
-
-
n
n
o
o
t
t
-
-
C
C
a
a
l
l
l
l
L
L
i
i
s
s
t
t
(
(
r
r
e
e
p
p
o
o
r
r
t
t
e
e
d
d
i
i
n
n
V
V
a
a
r
r
i
i
a
a
n
n
e
e
t
t
a
a
l
l
.
.
(
(
2
2
0
0
0
0
4
4
)
)
A
A
g
g
e
e
R
R
e
e
g
g
i
i
o
o
n
n
M
M
e
e
d
d
i
i
a
a
n
n
H
H
o
o
u
u
s
s
e
e
h
h
o
o
u
u
s
s
e
e
I
I
n
n
c
c
o
o
m
m
e
e
E
E
d
d
u
u
c
c
a
a
t
t
i
i
o
o
n
n
E
E
d
d
u
u
c
c
a
a
t
t
i
i
o
o
n
n
L
L
a
a
t
t
i
i
n
n
o
o
H
H
o
o
u
u
s
s
e
e
h
h
o
o
l
l
d
d
I
I
n
n
c
c
o
o
m
m
e
e
I
I
n
n
c
c
o
o
m
m
e
e
H
H
o
o
u
u
s
s
e
e
h
h
o
o
l
l
d
d
w
w
i
i
t
t
h
h
c
c
h
h
i
i
l
l
d
d
r
r
e
e
n
n
1
1
2
2
-
-
1
1
8
8
Y
Y
r
r
s
s
R
R
a
a
c
c
e
e
R
R
a
a
c
c
e
e
H
H
o
o
u
u
s
s
e
e
h
h
o
o
l
l
d
d
l
l
i
i
n
n
g
g
u
u
i
i
s
s
t
t
i
i
c
c
i
i
s
s
o
o
l
l
a
a
t
t
i
i
o
o
n
n
M
M
a
a
r
r
i
i
t
t
a
a
l
l
S
S
t
t
a
a
t
t
u
u
s
s
M
M
a
a
r
r
i
i
t
t
a
a
l
l
S
S
t
t
a
a
t
t
u
u
s
s
E
E
d
d
u
u
c
c
a
a
t
t
i
i
o
o
n
n
l
l
o
o
w
w
S
S
t
t
a
a
t
t
e
e
h
h
a
a
s
s
o
o
w
w
n
n
D
D
N
N
C
C
-
-
l
l
i
i
k
k
e
e
l
l
i
i
s
s
t
t
S
S
t
t
a
a
t
t
e
e
h
h
a
a
s
s
m
m
e
e
r
r
g
g
e
e
d
d
w
w
i
i
t
t
h
h
D
D
N
N
C
C
One of the assumptions of our research is that the motivation to request free credit report under FACTA is
conceptually comparable (although obviously mostly unrelated) to the motivation of sign up for a do-not-call list
studied by Varian et al (2004).
First, in absolute terms, it is clear that the rates of FACTA requests we estimated in previous Sections translate to a
smaller population than the 157 million do-not-call list registrants Varian et al (2004) estimate. In terms of
behavioral and demographic differences in the two datasets, we found that age is not a significant variable in our
model, and it doesn’t have a consistent impact on the likelihood of registering to the do-not-call list either. The
impact of income on do-not-call list sign up and FACTA report request are very similar in the two scenarios. High
income people/household have high likelihood of or request or sign-up frequency. The likelihood increases with
income. People or household at high end in both researches all have substantial likelihood comparing with other
group. The only difference is that in our research, people with average income, from $25,000 to $34,999, have
substantial increase in request odds ratio too. The effects of education are similar in the two context too. In general,
the likelihood increases with education level. People with associate degree have highest likelihood of request
FACTA report, while people with post graduate education have highest likelihood of sign-up to the do-not-call list.
People with graduate school education in our research have the second highest odds of request.
DRAFT – VERY PRELIMINARY
We also find those who are unmarried and live with partners have high likelihood of request free credit report under
FACTA. In our research, those people have the second highest odds, next to those are separated. Varian et al. use
unmarried and with partner as control and compare it with all the other groups. Their results show the former group
does have lower frequencies. So marital status has similar effect in the two cases.
The effect of race on the request rates of FACTA credit reports, however, is different than the likelihood found by
Varian et al. (2004) for the do-not-call list case. In their findings, Asian households have the highest sign-up rate,
followed up multiracial households, white, and black households. In our context, black individuals, after controlling
for other variables, have in fact the highest odds of any other group to request FACTA reports. This is one of the
various items of analysis that will inform the rest of our research agenda. We present in Table 22 an overview of
various specifications of our models and these various independent variables.
Conclusion
We have presented initial results from a nationally representative survey we conducted in concert with Harris
Interactive to study US adults’ response to the FACTA legislation.
We have found that knowledge about FACTA is widespread, and that 24 to 36% of US adults took advantage of this
opportunity. However, a significant fraction of US population may have erroneously ended up spending money in
the attempt of getting a free credit report. On the other hand, the FACTA initiative has led a quarter of consumers
who had never seen their report to finally receive it. The response rate to FACTA is therefore, as one of our
hypotheses suggested, lower than the registration rate that Varian et al. (2004) found for the do-not-call list – but it
is still quite high, considering the transaction and cognitive costs associated both with the problem (identity theft and
financial fraud) and its solution (the FACTA initiative).
Our analysis is preliminary, because of the very recent date at which our data was received. Our ongoing research
agenda includes a refinement of the random utility model presented above, and a more detailed analysis of our
dataset. We also plan to address a number of additional questions - such as the prevalence of Internet FACTA
requests notwithstanding their higher risks and complexity when compared to phone or mail requests, and the
difficulty users experience in finding out about the way to request FACTA reports online in the presence of several
look-alike sites.
DRAFT – VERY PRELIMINARY 25