Green Building Costs and Financial Benefits pdf
Bạn đang xem bản rút gọn của tài liệu. Xem và tải ngay bản đầy đủ của tài liệu tại đây (470.79 KB, 10 trang )
GGrreeeenn BBuuiillddiinngg CCoossttss aanndd
FFiinnaanncciiaall BBeenneeffiittss
by Gregory H. Kats
1
Green Building Costs and Financial Benefits
by Gregory H. Kats
Sponsors
Barr Foundation
Environmental Business Council of New England, Inc.
Equity Office Properties
Massachusetts Technology Collaborative
Massport
In co-operation with
The City of Boston Green Buildings Task Force
Greater Boston Real Estate Board
Boston Society of Architects
Western Massachusetts AIA
Green Roundtable & Developers Roundtable
Northeast Sustainable Energy Association
Greater Boston Chamber of Commerce
Real Estate Finance Association
Health Care without Harm
Springfield Chamber of Commerce
New Ecology Inc.
The Massachusetts Technology Collaborative is the state's development agency for renewable
energy and the innovation economy. The agency administers the Renewable Energy Trust,
which is maximizing the benefits of clean energy and helping to create jobs for the
Commonwealth by stimulating new supply and demand for green power. The Trust was
created in 1998 through the electric restructuring law and is funded through a monthly
surcharge on electric utility bills. For more information, please visit the agency's website
www.masstech.org.
Published in USA for Massachusetts Technology Collaborative Copyright 2003
Captions for cover photos (top to bottom)
The J.F. Williams Federal Building in Boston includes 30 kW of solar photovoltaics and a 75 kW cogeneration system. Through an MTC
grant, a data acquisition system has been installed at the site to monitor the production and savings of these systems.
Artists for Humanity is building a new facility in the Fort Point Channel district of Boston to house its arts education programs. The building
has been designed to reduce energy use by 65% and to include significant daylighting and other green building features. Up to 100% of
remaining energy needs will be met by the installation of 45 kW of solar photovoltaics funded by MTC.
In its redevelopment of an historic mill building as a mixed-use office and commercial facility, Alternatives Unlimited has focused on the
design of green building and energy efficiency features that will best meet occupant needs. The capstone of this project will be the restoration
of a hydropower system in Whitinsville's Mumford River adjacent to the mill to provide the facility's electricity.
2
Introduction
Massachusetts is a leading state in the rapidly
growing green building movement. Buildings
consume 70% of the nation’s electricity and a
large part of the materials, water and waste used
and generated in our economy. Buildings have
traditionally been viewed as a relatively static
sector of the economy experiencing relatively
little change in technology or resource
consumption patterns. To date there has been a
widespread perception that green buildings—
though more attractive from an environmental
and health perspective—are substantially more
costly than conventional design and may not be
justified from a cost benefits perspective. This
perception has been the single largest obstacle to
the more widespread adoption of green design.
This paper reviews a major recent report on the
issue of green building costs benefits, “The Costs
and Benefits of Green Buildings,” Kats
1
et al.,
October 2003
2
(the Report). Led by Capital E,
the Report was prepared in partnership with the
US Green Building Council and California’s
Sustainable Building Task Force for 40+ California
state agencies.
What are green buildings?
“Green” or “sustainable” buildings use key
resources like energy, water, materials, and land
more efficiently than buildings that are just built
to code. With more natural light and better air
quality, green buildings typically contribute to
improved employee and student health, comfort,
and productivity. The United States Green
Building Council (USGBC), a national non-profit
membership organization, developed the
Leadership in Energy and Environmental Design
(LEED) System
TM
to provide a guideline and rating
system for green buildings.
It is generally recognized that buildings consume
a large portion of water, wood, energy, and other
resources used in the economy. For example, US
buildings alone are responsible for more CO
2.
emissions than those of any other entire country
in the world except China.
3
If building green is
cost effective, a broad shift to green construction
offers a potentially promising way to help address
a range of challenges facing Massachusetts,
including:
■ Address growing costs of transmission and
distribution congestion. The growth of
Time of Use rates (TOU) by Massachusetts
utilities, and the creation of congestion
pricing in the form of locational marginal
pricing
4
allows building owners to capture
some of the benefits associated with lower
overall and lower peak energy use in green
buildings
Green Building Costs and Financial Benefits
Greg Kats, Capital E
1 The author is founding Principal of Capital E, a national clean technology deployment and strategy firm. Mr. Kats served from 1996 to 2001as the
Director of Financing for the $1.1 billion dollar Office of Energy Efficiency and Renewable Energy at the US Department of Energy - the largest clean
technology R&D and deployment program in the US. He is Chair of the Energy And Atmosphere Technical Advisory Group for LEED and serves on the
LEED Steering Committee.
2 “The Costs and Benefits of Green Buildings”, A Report to California’s Sustainable Building Task Force, October 20003. Principal author Greg Kats,
For full text and summary slides see www.cap-e.com
3 Kinzey et al., “The Federal Buildings Research and Development Program: A Sharp Tool for Climate Policy,” 2002 ACEEE proceedings, Section 9.21.
4 see: />The Woods Hole Research Center received a total of $500,000 in MTC
awards to install 26.4 kW of solar photovoltaics and a 100 kW wind turbine
at the site of its new headquarters. Combined with innovative energy
efficiency measures and high-performance design, these renewables will help
Woods Hole achieve its goal of a "Zero Energy" facility, producing more
energy than it consumes. Pictured here, the Ordway Building.
3
■ Reduce or slow rise in electricity and gas
prices through expanded green
construction and building retrofits and
reduced energy demand
5
■ Help cut pollution from fossil fuels
(Massachusetts fuel mix includes 28% coal
as of 1999 - US DOE) including fine
particulates in urban areas
■ Help Massachusetts meet EPA mandated
emissions reductions targets
■ Improve quality of educational environment
and improve school test scores
■ Enhance competitiveness by providing work
and living environments characterized by
superior health and comfort and work
environments
How much more do
green buildings cost?
Green buildings are commonly perceived to be a
lot more expensive than conventional buildings
and often not worth the extra cost. For example,
an early 2003 article in the New York Times was
entitled “Not Building Green Is Called a Matter of
Economics.”
In order to determine the cost of building green
compared to conventional design, several dozen
building representatives and architects were
contacted to secure the cost of 33 green
buildings from across the United States compared
to conventional designs for those same buildings.
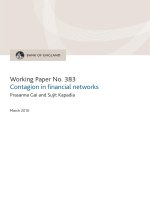
The average premium for these green buildings is
slightly less than 2%, or $3-5/ft
2
, substantially
lower than is commonly perceived (See Figure 1).
The majority of this cost is due to the increased
architectural and engineering (A&E) design time,
modeling costs and time necessary to integrate
sustainable building practices into projects.
Generally, the earlier green building features are
incorporated into the design process, the lower
the cost.
The cost of green design has dropped in the last
few years as the number of green buildings has
risen. The trend of declining costs associated
with increased experience in green building
construction has been experienced in
Pennsylvania, as well as in Portland and Seattle.
Portland’s three reported and completed LEED
Silver buildings were finished in 1995, 1997, and
2000. They incurred cost premiums of 2%, 1%
and 0% respectively. Seattle has seen the cost of
LEED Silver buildings drop from 3-4% several
years ago to 1-2% today.
Green buildings financial benefits
Green Buildings provide financial benefits that
conventional buildings do not. These benefits
include energy and water savings, reduced waste,
improved indoor environmental quality, greater
employee comfort/productivity, reduced employee
health costs and lower operations and
maintenance costs. This paper will focus on two
of these benefits: lower energy costs, and health
and productivity benefits.
Level 1
Certified
(8 bldgs)
Level 2
Silver
(18 bldgs)
Level 3
Gold
(6 bldgs)
Level 4
Platinum
(1 bldg)
0.00%
1.00%
2.00%
3.00%
4.00%
5.00%
6.00%
7.00%
1.82%
2.11%
0.66%
6.50%
Figure 1
Average Green Cost Premium vs. Level of Green Certification
for Offices and Schools
Average Green Cost Premium
(in percent)
Source: USGBC, Capital E Analysis
5 See for example, “Impacts of Energy Efficiency and Renewable Energy on Natural Gas Markets”, Elliott et al., ACEEE, Sept, 2003. See:
4
Energy
Energy is a substantial and widely recognized
cost of building operations that can be reduced
through energy efficiency and related measures
that are part of green building design. The
average annual cost of energy in Massachusetts
buildings is approximately $2.00/ft
2
. On average,
green buildings use 30% less energy than
conventional buildings—a reduction, for a
100,000 ft
2
state office building, worth $60,000
per year, with a 20-year present value of
expected energy savings at a 5% real discount
rate worth about three quarters of a million
dollars.
A detailed review of 60 LEED rated buildings,
demonstrates that green buildings, when
compared to conventional buildings, are:
■ On average 25-30% more energy efficient
■ Characterized by even lower electricity
peak consumption
■ More likely to generate renewable energy
on-site
■ More likely to purchase grid power
generated from renewable energy sources
(green power and/or tradable renewable
certificates)
Green building energy savings primarily come
from reduced electricity purchases and
secondarily from reduced peak energy demand.
On average, green buildings are 28% more
efficient than conventional buildings and
generate 2% of their power on-site from
photovoltaics (PV). (See Figure 2.) The financial
benefits of 30% reduced consumption at an
electricity price of $0.08/kWh are about
$0.30/ft
2
/yr, with a 20-year NPV of over $5/ft
2
,
equal to or more than the average additional cost
associated with building green.
The environmental and health costs associated
with air pollution caused by non-renewable
electric power generation and on-site fossil fuel
use are generally externalized (not considered)
when making investment decisions. The larger
Report this paper draws from quantifies two of
these benefits: the value of peak power reduction
and the value of emissions reductions associated
with the energy strategies integrated into green
building design. The Report calculates these
additional financial benefits are equal to about
one third of that provided by energy savings
alone.
Figure 2
Reduced Energy Use in Green Buildings as Compared with Conventional Buildings
Source: USGBC, Capital E Analysis
Certified Silver Gold Average
Energy Efficiency (above standard code) 18% 30% 37% 28%
On-Site Renewable Energy 0% 0% 4% 2%
Green Power 10% 0% 7% 6%
Total 28% 30% 48% 36%
The Genzyme Corporation's recently completed office in
Cambridge is a world-class example of green building
construction, including advanced daylighting and thermal
technologies. In addition to a photovoltaic installation
funded by MTC, one of the most prominent features is a
combined heliostat and reflective panel system designed
to channel daylight deep into the 8-story building.
5
Productivity and health
There is growing recognition of the large health
and productivity costs imposed by poor indoor
environmental quality (IEQ) in commercial
buildings—estimated variously at up to hundreds
of billions of dollars per year. This is not
surprising as people spend 90% of their time
indoors, and the concentration of pollutants
indoors is typically higher than outdoors,
sometimes by as much as 10 or even 100 times.
6
The relationship between worker comfort/pro-
ductivity and building design/operation is com-
plicated. There are thousands of studies,
reports and articles on the subject that find sig-
nificantly reduced illness symptoms, reduced
absenteeism and increases in perceived produc-
tivity over workers in a group that lacked these
features.
7
For example, two studies of over
11,000 workers in 107 European buildings ana-
lyzed the health effect of worker-controlled tem-
perature and ventilation. The Report relies in
large part on recent meta-studies that have
screened tens or hundreds of other studies and
have evaluated and synthesized their findings.
Following are some relevant attributes common in
green buildings that promote healthier work
environments:
■ On average 25-30% more energy efficient
■ Much lower source emissions from measures
such as better siting (e.g., avoiding
locating air intakes next to outlets, such as
parking garages, and avoiding
recirculation), and better building material
source controls (e.g., required attention to
storage). Certified and Silver level green
buildings achieved 55% and Gold level LEED
buildings achieved 88% of possible LEED
credits for use of the following:
8
less toxic
materials, low-emitting adhesives &
sealants, paints, carpets, and composite
woods, and indoor chemical & pollutant
source control.
■ Significantly better lighting quality
including: more daylighting (half of 21
LEED green buildings reviewed provide
daylighting to at least 75% of building
space
9
), better daylight harvesting and use
of shading, greater occupancy control over
light levels and less glare
■ Generally improved thermal comfort and
better ventilation—especially in buildings
that use underfloor air for space
conditioning
■ Commissioning, use of measurement and
verification, and CO
2 monitoring to ensure
better performance of systems such as
ventilation, heating and air conditioning
Measuring the exact financial impact of healthier,
more comfortable and greener buildings is
6 US Environmental Protection Agency, “Indoor Air Quality,” January 6, 2003. Available at: />7 Judith Heerwagen, “Sustainable Design Can Be an Asset to the Bottom Line - expanded internet edition,” Environmental Design & Construction,
Posted 07/15/02. Available at:
8 Capital E analysis of USGBC data (based on analysis of points actually achieved in building performance data submitted to USGBC), November and
December 2002. For more detail on achievable reductions from some of these indoor emissions sources, please see: Hodgson AT. “Common Indoor
Sources of Volatile Organic Compounds: Emissions Rates and Techniques for Reducing Consumer Exposures.” University of California, Lawrence
Berkeley National Laboratory. 1999.
Prepared for California Air Resources Board.
Available at:
9 Capital E analysis of USGBC data, November and December 2002.
Urban Edge is developing a pioneering example of green building opportuni-
ties in affordable housing. Through an MTC grant, the non-profit will install
63 kW of solar photovoltaics at the new Egleston Crossing development in
Jamaica Plain and Roxbury. This installation, in combination with multiple
energy efficiency measures, will reduce the project's electricity needs by 50%.
6
difficult. The costs of poor indoor environmental
and air quality—including higher absenteeism
and increased respiratory ailments, allergies and
asthma—are hard to measure and have generally
been “hidden” in sick days, lower productivity,
unemployment insurance and medical costs.
However, four of the attributes associated with
green building design—increased ventilation
control, increased temperature control, increased
lighting control and increased daylighting—have
been positively and significantly correlated with
increased productivity. Increases in tenant
control over ventilation, temperature and lighting
each provide measured benefits from 0.5% up to
34%, with average measured workforce
productivity gains of 7.1% with lighting control,
1.8% with ventilation control, and 1.2% with
thermal control. Additionally, significant
measured improvements have been found with
increased daylighting.
There are also quantifiable green building gains
in attracting and retaining a committed
workforce—an aspect beyond the scope of the
Report. Attracting and retaining the best
employees can be linked to the quality of
benefits that workers receive, including the
physical, environmental and technological
workplace. Green buildings are designed to be
healthier and more enjoyable working
environments. Workplace qualities that improve
the environment of knowledge workers may also
reduce stress and lead to longer lives for multi-
disciplinary teams.
LEED rated buildings all address some
combination of measures that help reduce the
pollutants that cause sickness and increase health
care costs; improve quality of lighting and
increase use of daylighting; and increase tenant
control and comfort. LEED Green buildings
consistently include a range of material, design
and operation measures that directly improve
human health and productivity. Gold and
Platinum level LEED buildings are more
comprehensive in applying IEQ-related measures
and therefore should be viewed as providing
larger productivity and health benefits than
Certified or Silver level green buildings.
Given the studies and data reviewed above, the
Report recommends attributing a 1% productivity
and health gain to Certified and Silver level
buildings and a 1.5% gain to Gold and Platinum
level buildings. These percentages are at the low
end of the range of productivity gains for each of
the individual specific building measures—
ventilation, thermal control, light control and
daylighting—analyzed above. They are
consistent with or well below the range of
additional studies reviewed in the Report.
The Blackstone Valley Vocational Regional School District is planning an ambitious 80,000 square foot addition to
accommodate four new vocational programs, and will renovate the existing building which has some systems that date
back to the 1960’s. Daylighting will be accomplished in this project by using light tube technology, which will save over
500 kW a year. Other efficiency measures include efficient air conditioning equipment and variable speed drives for the
air handling unit. The school will also incorporate photovoltaic panels mounted on the roof and a solar thermal
domestic water preheating system.
A 1% increase in productivity (equal to about 5
minutes per working day) is equal to $600 to
$700 per employee per year, or $3/ft
2
per year. A
1.5 % increase in productivity (or a little over 7
minutes each working day) is equal to about
$1000 per year, or $4 to $5/ft
2
per year. Over 20
years and at a 5% real discount rate, the present
value of the productivity benefits is about $35/ft
2
for Certified and Silver level buildings, and
$55/ft
2
for Gold and Platinum level buildings. The
relatively large impact of productivity and health
gains reflects the fact that the direct and indirect
cost of employees is far larger than the cost of
construction or energy. Consequently, even small
changes in productivity and health translate into
large financial benefits. Assuming a longer
building operational life, such as 30 or 40 years,
would result in substantially larger benefits.
It is worth noting that:
■ Nearly one-fifth of Massachusetts’
population spend their day inside schools
■ Only 43% of high-volume chemicals have
been tested for potential human toxicity,
and only 7% have been tested for their
effect on children’s development
10
■ Asthma is the leading cause of admission
of urban children into hospitals and the
leading cause of days absent from school
11
Green building improvements—especially for new
buildings—appear to be very cost effective
compared with other available measures to
enhance student performance. Under the
recently adopted Federal Education Bill, schools
and states stand to lose billions of dollars in
federal funding if students do not perform well on
annual standardized tests. School and university
systems should consider adopting whole building
green design at the LEED Gold level or
corresponding MASS-CHP scoring as a standard
requirement in new school design and school
retrofits.
7
10 Philip Landrigan et al, “Environmental Pollutants and Disease in American Children: Estimates of morbidity, Mortality, and Costs of Lead
Poisoning, Asthma, Cancer and Developmental Disabilities,” Environmental Health Perspectives, Volume 110, Number 7, July 2002.
Available at:
11 Ibid.
The MITRE Corporation is developing a new state-of-the-art
campus center at its Bedford facility to be built according to a
comprehensive energy plan and green building standards. With
assistance from an MTC grant, the project will incorporate 16.5
kW of rooftop photovoltaics and 12.5 kW of advanced semi-trans-
parent solar photovoltaic panes installed on a covered walkway.
8
Overall costs and
financial benefits
Green Buildings provide financial benefits that
conventional buildings do not. As indicated in
Figure 3 below, the Report concluded that
financial benefits of green design are between
$50 and $70 per square foot in a LEED building,
over 10 times the additional cost associated with
building green. The financial benefits are in
lower energy, waste and water costs, lower
environmental and emissions costs, and lower
operational and maintenance costs and increased
productivity and health.
Massachusetts already has established national
leadership in green buildings, including achieving
the first gold rated federal building (at EPA’s
Chelmsford Lab), and is well positioned to build
on this. Doing so will involve developing policies
that allow green buildings to capture the
financial value of benefits associated with green
design. Although this issue is beyond the scope
of this paper, two disparate examples are worth
noting:
■ Accelerated permissioning for the Manulife
Financial Headquarters building in South
Boston
12
resulting from the perceived
benefits associated from its green design
suggests one way to make these links more
clearly.
■ An expected shift from zonal to nodal
pricing system for load and generation
pricing is a step towards allowing more
accurate mapping of real cost into price
signals that might allow green buildings to
better capture the financial benefits
resulting from green construction.
The benefits of building green include cost
savings from reduced energy, water, and waste;
lower operations and maintenance costs; and
enhanced occupant productivity and health. As
Figure 3 indicates, the total financial benefits of
green buildings are over ten times the average
initial investment required to design and
construct a green building. Despite data
limitations and the need for additional research
in various areas, the data demonstrates that
building green is cost-effective today, particularly
for those projects which start “green” design
early in the process.
12 See: />Figure 3
Financial Benefits of Green Buildings
Summary of Findings (per ft
2
)
Source: Capital E Analysis
Category 20-year Net Present Value
Energy Savings $5.80
Emissions Savings $1.20
Water Savings $0.50
Operations and Maintenance Savings $8.50
Productivity and Health Benefits $36.90 to $55.30
Subtotal $52.90 to $71.30
Average Extra Cost of Building Green (-3.00 to -$5.00)
Total 20-year Net Benefit $50 to $65
Massachusetts Technology Collaborative
75 North Drive, Westborough, MA 01581
508.870.0312 fax.508.898.9226
www.masstech.org