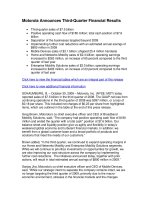
FOR IMMEDIATE RELEASE LIVE NATION REPORTS FIRST QUARTER 2008 FINANCIAL RESULTS pptx
Bạn đang xem bản rút gọn của tài liệu. Xem và tải ngay bản đầy đủ của tài liệu tại đây (223.04 KB, 9 trang )
FOR IMMEDIATE RELEASE
LIVE NATION REPORTS FIRST QUARTER 2008 FINANCIAL RESULTS
- 2008 concert season begins with over 4,400 music events in first quarter -
LOS ANGELES – May 8, 2008 – Live Nation (NYSE: LYV) released financial results for the three months ended
March 31, 2008 today.
Q1 2008 Q1 2007
Revenue 636.5$ 520.3$
Adjusted Operating Income (Loss) (2.1)$ (2.8)$
Operating Income (Loss) (38.5)$ (36.9)$
Free Cash Flow (24.0)$ (46.6)$
Net Income (Loss) (35.4)$ (45.0)$
Basic and Diluted EPS (0.47)$ (0.69)$
Summary Results
$ in millions (except per share amounts)
“The first quarter represented a solid start to what we believe will be a very healthy year for concerts globally,” said
Michael Rapino, President and Chief Executive Officer of Live Nation. “Our ticket sales to date remain strong
despite the slowdown in the economy. Our priorities for 2008 continue to be focused on improving the profitability
of our core concert distribution platform, building our ticketing division for our 2009 launch and continuing to
divest non-core assets to reduce debt.”
“We are pleased with our financial results which are in line with our plan in what is seasonally a slow quarter for
us,” said Kathy Willard, Chief Financial Officer of Live Nation. “Due to earlier timing of ticket sales and continued
control over maintenance-related capital expenditures, our cash balances and free cash flow have improved during
the quarter, as well.”
Highlights:
• Build-out of our ticketing initiative is in process and on schedule through our long-term agreement with CTS
Eventim, through which we will exclusively license the Eventim platform in North America, and Eventim will
provide back-office ticketing services in the United Kingdom and ticketing services across Europe.
• Entered into strategic marketing alliance with Citi® that capitalizes on the company’s fully integrated music
platform, including concerts, online ticketing and access to Live Nation Artists, to deliver a uniquely
comprehensive live music experience to Citi® customers in the United States.
• Acquired the operating company that manages and holds the 20-year lease for the Heineken Music Hall in
Amsterdam. We believe that this 5,500-capacity venue is one of the most attended venues in the world.
1
• Provided services through our Global Artists segment to 797 artists during the quarter. In addition, we have
reached agreements to acquire long-term rights for Madonna, U2 and Jay-Z.
• Currently have 528 corporate sponsors on a local, national and international basis as of the first quarter of 2008.
• Agreed to acquire a 65% interest in Mirage Productions, a leading promoter in Dubai. This acquisition is
consistent with our strategy to expand into global markets in which we don’t currently have a significant
presence.
• Recorded 1.45 million unique visitors on LiveNation.com for Jonas Brothers’ information and tickets in one
week, a new record for a single artist on the website.
Below are what we believe to be our key metrics related to our music businesses:
METRICS
(Unaudited)
Key Drivers
2007 Actual
Full Year Q1 2008 Q1 2007
Variance
(Qtr.)
Total Direct Operating Expense (in millions) 3,017.2$ 390.7$ 280.6$
39.2%
Total Direct Operating Expense as % of Total Reve nue 81.6% 78.3% 74.7%
Number of Live Rights (Events) (est.) 16,747 4,431 3,253
36.2%
Number of Ancillary Live Rights (est.) 1,865 797
n/a
Total Attendance (est.) 46,438,000 6,327,000 6,109,000
3.6%
Number of Sponsors (est.) 1,201 528 640
(17.5%)
Sponsorship Revenue Recognized (in millions) 215.0$ 18.7$ 18.6$
0.4%
Total Revenue per Attendee (Fan) 79.59$ 78.85$ 61.51$
28.2%
Rights Acquisitions
Distribution Platform
2
FINANCIAL HIGHLIGHTS
Q1 2008 Q1 2007 Growth
Revenue
North American Music 300.1$ 248.3$ 20.9%
International Music 128.9 104.6 23.2%
Global Artists 69.9 22.9 **
Global Digital 5.7 1.3 **
Other and Eliminations 131.9 143.2 (7.9%)
636.5$ 520.3$ 22.3%
Adjusted Operating Income (Loss) Q1 2008 Q1 2007
North American Music (16.9)$ (19.0)$ 11.1% (5.6%) (7.7%)
International Music 1.0 0.6 66.7% 0.8% 0.6%
Global Artists (9.0) (4.8) (87.5%) (12.9%) (21.0%)
Global Digital (3.4) (1.8) (88.9%) **
Other and Eliminations 35.5 30.8 15.3% 26.9% 21.5%
Corporate (9.3) (8.6) (8.1%)
(2.1)$ (2.8)$ 25.0% (0.3%) (0.5%)
Operating Income (Loss)
North American Music (32.6)$ (33.5)$ 2.7% (10.9%) (13.5%)
International Music (7.0) (4.0) (75.0%) (5.4%) (3.8%)
Global Artists (17.7) (8.8) ** (25.3%) (38.4%)
Global Digital (3.9) (2.5) (56.0%) ** **
Other and Eliminations 35.9 22.9 56.8% 27.2% 16.0%
Corporate (13.2) (11.0) (20.0%)
(38.5)$ (36.9)$ (4.3%) (6.0%) (7.1%)
** percentages are not meaningful
$ in millions
Margins
The highlights of our financial information for the first quarter of 2008 as compared to the first quarter of 2007 are
as follows:
Revenue change – Total increase of $116.2 million, primarily driven by:
• $35.2 million – Acquisition of HOB Canada in North American Music
• $10.8 million – Foreign exchange movements in International Music
• $16.0 million – Acquisitions of AMG and Heineken Music Hall in International Music
• $24.3 million – Acquisitions of Signatures and Anthill in Global Artists
• $15.5 million – Increased ticket revenues due to strong arena acts and improved results at promoted mid-sized
music venues as a result of higher attendance, increased show count and higher average ticket prices for North
American Music. In total, North American Music promotions increased by approximately 340 events in the quarter
to over 2,100 events, although total attendance for these events decreased slightly.
Adjusted Operating Income (Loss) change – Total improvement of $0.7 million, primarily driven by:
• $1.6 million – Acquisition of HOB Canada in North American Music
• $3.9 million – Acquisitions of AMG and Heineken Music Hall in International Music
• ($3.2) million – Investment in Global Artists infrastructure
• ($3.9) million – Investment in infrastructure for ticketing and digital operations in Global Digital
3
4
Operating Income (Loss) change – Total decline of $1.6 million, primarily driven by:
• $0.7 million – Overall improvement in Adjusted Operating Income (Loss) noted above
• ($1.1) million – Increase in non-cash compensation expense for additional equity grants since March 2007
• $6.0 million – Increase in gain on sale of operating assets due to gain recorded on the sale of a motor sports
related joint venture as compared to a net loss recorded in 2007 on the sale of two non-core assets
• ($7.2) million – Increase in depreciation and amortization expense due to amortization of intangible assets related
to the AMG and CPI acquisitions
Other information
• We completed the divestiture of substantially all of our North American theatrical business for gross sales
proceeds of $90.4 million. The results for this business are now reported as discontinued operations for all periods
presented.
• Maintenance capital expenditures for the quarter were only $6.3 million. We also incurred $16.9 million of
capital expenditures for revenue generating projects, including the renovation of The Point in Ireland and the AMG
venue expansion in Sheffield.
• As of March 31, 2008, our cash and cash equivalents were $433.9 million and our total long-term debt was $764.2
million with no balance outstanding on our revolving credit facility.
About Live Nation:
Live Nation is the future of the music business. With the most live concerts, music venues and festivals in the world
and the most comprehensive concert search engine on the web, Live Nation is revolutionizing the music industry:
onstage and online. Headquartered in Los Angeles, California, Live Nation is listed on the New York Stock
Exchange, trading under the symbol “LYV”.
Conference Call:
The company will host a teleconference today, May 8
th
, 2008 at 5:00 p.m. Eastern Time, which can be accessed by
dialing 888-603-6873 (U.S.) or 973-321-1019 (Int’l) and referencing passcode 44729185. To access the call via
webcast, please visit the Investor Relations section of the company’s website at
www.livenation.com/investors.
Additional statistical and financial information to be provided on the call, if any, will be posted supplementally
under that same link.
Media Contact: Investor Contact:
John Vlautin Brad Edwards
Live Nation Brainerd Communicators, Inc.
310-867-7000 212-986-6667
5
CONSOLIDATED STATEMENTS OF OPERATIONS (UNAUDITED)
Three Months Ended
March 31,
2008
2007
(in thousands except share and per share data)
Revenue
$ 636,451 $ 520,312
Operating expenses:
Direct operating expenses
468,682 373,289
Selling, general and administrative expenses
161,616 142,467
Depreciation and amortization
34,377 27,062
Loss (gain) on sale of operating assets
(1,375) 4,575
Corporate expenses
11,641 9,796
Operating loss (38,490) (36,877)
Interest expense 15,927 14,928
Interest income (1,575) (2,637)
Equity in losses (earnings) of nonconsolidated affiliates 289 (343)
Minority interest income (2,242) (2,995)
Other income — net (851) (47)
Loss from continuing operations before income taxes (50,038) (45,783)
Income tax expense:
3,308
2,197 Current
Deferred 3,021 3,704
Loss from continuing operations (56,367) (51,684)
Income from discontinued operations, net of tax 20,965 6,635
Net loss (35,402) (45,049)
Other comprehensive income (loss), net of tax:
Unrealized holding loss on cash flow derivatives (1,636) (436)
Foreign currency translation adjustments 12,072 (67)
Comprehensive loss $ (24,966) $ (45,552)
Basic and diluted income (loss) per common share:
Loss from continuing operations $ (.75) $ (.79)
Income from discontinued operations .28 .10
Net loss $ (.47) $ (.69)
Basic and diluted weighted average common shares outstanding 74,984,934 65,499,719
6
CONSOLIDATED BALANCE SHEETS
March 31,
2008
Decembe 31, r
2007
(unaudited) (audited)
(in thousands)
ASSETS
CURRENT ASSETS
Cash and cash equivalents……………………………………………………………………. $ 433,865 $ 338,991
Accounts receivable, less allowance of $16,697 as of March 31, 2008 and $18,928 as of
December 31, 2007………………………………………………………………………
284,703 264,316
Prepaid expenses………………………………………………………………………………
289,375 186,379
Other current assets…………………………………………………………………………… 49,645 44,722
Total Current Assets………………………………………………………………… 1,057,588 834,408
PROPERTY, PLANT AND EQUIPMENT
Land, buildings and improvements…………………………………………………………… 956,194 1,018,079
Furniture and other equipment………………………………………………………………
237,736 236,320
Construction in progress……………………………………………………………………
66,975 51,725
1,260,905 1,306,124
Less accumulated depreciation………………………………………………………… 389,279 391,079
871,626 915,045
INTANGIBLE ASSETS
Intangible assets — net……………………………………………………………………… 399,645 382,999
Goodwill……………………………………………………………………………………….
473,944 471,542
OTHER LONG-TERM ASSETS
1,685
1,703 Notes receivable, less allowance of $745 as of March 31, 2008 and December 31, 2007…
Investments in nonconsolidated affiliates………………………………………………
24,508 23,443
Other long-term assets……………………………………………………………………
127,973 122,963
Total Assets
$ 2,956,969 $ 2,752,103
LIABILITIES AND SHAREHOLDERS’ EQUITY
CURRENT LIABILITIES
Accounts payable…………………………………………………………………………… $ 81,557 $ 79,273
Accrued expenses……………………………………………………………………………
460,487 511,636
Deferred revenue…………………………………………………………………………… 560,432 259,868
Current portion of long-term debt…………………………………………………………
36,406 36,345
Other current liabilities…………………………………………………………
27,767 18,348
Total Current Liabilities…………………………………………………………… 1,166,649 905,470
Long-term debt………………………………………………………………………………
727,775 786,261
Other long-term liabilities…………………………………………………………………….
109,801 91,465
Minority interest liability……………………………………………………………………
66,918 61,841
Series A and Series B redeemable preferred stock……………………………………………
40,000 40,000
Commitments and contingent liabilities …………………………………………………….
SHAREHOLDERS’ EQUITY
Common stock……………………………………………………………………………… 749 749
Additional paid-in capital……………………………………………………………………
944,574 940,848
Retained deficit………………………………………………………………………………
(166,343) (130,941)
Accumulated other comprehensive income…………………………………………………
66,846 56,410
Total Shareholders’ Equity
845,826 867,066
Total Liabilities and Shareholders’ Equity
$ 2,956,969 $ 2,752,103
CONSOLIDATED STATEMENTS OF CASH FLOWS (UNAUDITED)
Three Months Ended
March 31,
2008
2007
(in thousands)
CASH FLOWS FROM OPERATING ACTIVITIES
Net loss
.
$ (35,402) $ (45,049)
Reconciling items:
Depreciation
.
17,508 19,920
Amortization of intangibles
.
17,036 7,766
Deferred income tax expense
.
3,021 3,704
Amortization of debt issuance costs
.
853 301
Non-cash compensation expense
.
3,435 2,385
Loss (gain) on sale of operating assets
.
(20,340) 4,462
Gain on sale of other investments
.
— (62)
Equity in losses (earnings) of nonconsolidated affiliates
.
289 (343)
Minority interest income
.
(2,226) (3,045)
Changes in operating assets and liabilities, net of effects of acquisitions and dispositions:
Increase in accounts receivable
.
(12,913) (10,341)
Increase in prepaid expenses
.
(103,087) (197,804)
Increase in other assets
.
(30,703) (1,282)
Decrease in accounts payable, accrued expenses and other liabilities
.
(18,472) (406)
Increase in deferred revenue
.
335,508 308,096
Decrease in other — net
.
(43) —
Net cash provided by operating activities
.
154,464 88,302
CASH FLOWS FROM INVESTING ACTIVITIES
Collection of notes receivable
.
19 1,266
Advances to notes receivable
.
(552) (12,046)
Distributions from nonconsolidated affiliates
.
2,445 2,684
Investments made to nonconsolidated affiliates
.
(250) (22,332)
Proceeds from disposal of other investments
.
— 3,615
Purchases of property, plant and equipment
.
(23,120) (13,679)
Proceeds from disposal of operating assets, net of cash divested
.
22,895 15,516
Cash paid for acquisitions, net of cash acquired
.
(6,754) (4,142)
Purchases of intangible assets
.
(1,248) —
Decrease (increase) in other — net
.
31 (173)
Net cash used in investing activities
.
(6,534) (29,291)
CASH FLOWS FROM FINANCING ACTIVITIES
Proceeds from long-term debt, net of debt issuance costs
.
18,329 77,000
Payments on long-term debt
.
(77,014) (51,698)
Distributions to minority interest partners
.
(195) (2,844)
Proceeds from exercise of stock options
.
— 424
Net cash provided by (used in) financing activities
.
(58,880) 22,882
Effect of exchange rate changes on cash
.
5,824 (1,007)
Net increase in cash and cash equivalents
.
94,874 80,886
Cash and cash equivalents at beginning of period
.
338,991 313,880
Cash and cash equivalents at end of period
.
$ 433,865 $ 394,766
7
8
Forward Looking Statements, Non-GAAP Financial Measures and Reconciliations:
Certain statements in this press release constitute “forward-looking statements” within the meaning of the Private Securities
Litigation Reform Act of 1995. Such forward-looking statements include, but are not limited to, statements regarding the
potential health and growth of the live music industry in 2008; Live Nation’s competitive position within the industry and its
potential to benefit from that anticipated growth and from various industry trends; the anticipated lack of impact to the company
of the current economic slowdown; the company’s anticipated achievement of its operational objectives for the year, including
the expansion of its distribution platform; the company’s efforts to build out its ticketing and e-commerce businesses and the
anticipated benefits of its ticketing and online strategies; the anticipated strength of the company’s 2008 summer concert
season; and the anticipated economics associated with the company’s artist rights arrangements. Live Nation wishes to caution
you that there are some known and unknown factors that could cause actual results to differ materially from any future results,
performance or achievements expressed or implied by such forward-looking statements, including but not limited to operational
challenges in achieving strategic objectives and executing on the company’s plans, the possibility that artists may unexpectedly
cancel or reschedule all or part of currently scheduled tours, the risk that the company’s markets do not evolve as anticipated,
the potential impact of any general economic slowdown, competition for corporate sponsors and in the industry generally and
operational challenges associated with building out the company’s ticketing and digital media operations.
Live Nation refers you to the documents it files from time to time with the U.S. Securities and Exchange Commission,
specifically the section titled “Item 1A. Risk Factors” of the company’s most recent Annual Report filed on Form 10-K,
Quarterly Reports on Form 10-Q and Current Reports on Form 8-K, which contain and identify other important factors that
could cause actual results to differ materially from those contained in the company’s projections or forward-looking statements.
You are cautioned not to place undue reliance on these forward-looking statements which speak only as of the date on which
they are made. All subsequent written and oral forward-looking statements by or concerning Live Nation are expressly
qualified in their entirety by the cautionary statements above. Live Nation does not undertake any obligation to publicly update
or revise any forward-looking statements because of new information, future events or otherwise.
This press release contains certain non-GAAP financial measures as defined by SEC Regulation G. A reconciliation of each
such measure to its most directly comparable GAAP financial measure, together with an explanation of why management
believes that these non-GAAP financial measures provide useful information to investors, is provided below.
Adjusted Operating Income (Loss) is a non-GAAP financial measure that the company defines as operating income (loss)
before depreciation and amortization, loss (gain) on sale of operating assets and non-cash compensation expense. The company
uses Adjusted Operating Income (Loss) to evaluate the performance of its operating segments. The company believes that
information about Adjusted Operating Income (Loss) assists investors by allowing them to evaluate changes in the operating
results of the company’s portfolio of businesses separate from non-operational factors that affect net income, thus providing
insights into both operations and the other factors that affect reported results. Adjusted Operating Income (Loss) is not
calculated or presented in accordance with U.S. generally accepted accounting principles. A limitation of the use of Adjusted
Operating Income (Loss) as a performance measure is that it does not reflect the periodic costs of certain capitalized tangible
and intangible assets used in generating revenue in the company’s business. Accordingly, Adjusted Operating Income (Loss)
should be considered in addition to, and not as a substitute for, operating income (loss), net income (loss), and other measures
of financial performance reported in accordance with U.S. GAAP. Furthermore, this measure may vary among other
companies; thus, Adjusted Operating Income (Loss) as presented herein may not be comparable to similarly titled measures of
other companies.
Free Cash Flow is a non-GAAP financial measure that the company defines as Adjusted Operating Income (Loss) less
maintenance capital expenditures, less net interest expense, less cash taxes, less distributions to minority interest partners plus
distributions from investments in nonconsolidated affiliates net of contributions to investments in nonconsolidated affiliates.
The company uses free cash flow, among other measures, to evaluate the ability of its operations to generate cash that is
available for purposes other than maintenance capital expenditures. The company believes that information about free cash
flow provides investors with an important perspective on the cash available to service debt and make acquisitions. Free cash
flow is not calculated or presented in accordance with U.S. generally accepted accounting principles. A limitation of the use of
free cash flow as a performance measure is that it does not necessarily represent funds available for operations and it is not
necessarily a measure of our ability to fund our cash needs. Accordingly, free cash flow should be considered in addition to,
and not as a substitute for, operating income (loss) and other measures of financial performance reported in accordance with
U.S. GAAP. Furthermore, this measure may vary among other companies; thus, free cash flow as presented above may not be
comparable to similarly titled measures of other companies.
Reconciliation of Non-GAAP Measures to Their Most Directly Comparable GAAP Measures (Unaudited)
Adjusted Operating Income (Loss) to Operating Income (Loss) – First Quarter
For the three months ended March 31, 2008
Adjusted
operating
income (loss)
Non-cash
compensation
expense
Loss (gain) on
sale of operating
assets
Depreciation and
amortization
Operating
income
(loss)
($ in millions)
North American Music (16.9)$ 1.5$ -$ 14.2$ (32.6)$
International Music 1.0 0.6 - 7.4 (7.0)
Global Artists (9.0) (0.2) - 8.9 (17.7)
Global Digital (3.4) 0.1 - 0.4 (3.9)
Other and Eliminations 35.5 (0.8) (1.9) 2.3 35.9
Corporate (9.3) 2.3 0.5 1.1 (13.2)
Total Live Nation (2.1)$ 3.5$ (1.4)$ 34.3$ (38.5)$
For the three months ended March 31, 2007
Adjusted
operating
income
(
loss
)
Non-cash
compensation
ex
p
ense
Loss (gain) on
sale of operating
assets
Depreciation and
amortization
Operating
income
(
loss
)
($ in millions)
North American Music (19.0)$ 0.8$ -$ 13.7$ (33.5)$
International Music 0.6 0.1 (0.1) 4.6 (4.0)
Global Artists (4.8) 0.3 - 3.7 (8.8)
Global Digital (1.8) 0.1 - 0.6 (2.5)
Other and Eliminations 30.8 0.0 4.7 3.2 22.9
Corporate (8.6) 1.1 - 1.3 (11.0)
Total Live Nation (2.8)$ 2.4$ 4.6$ 27.1$ (36.9)$
Reconciliation of Adjusted Operating Income (Loss) to Free Cash Flow – First Quarter
($ in millions)
March 31, 2008 March 31, 2007
Adjusted operating income ($2.1) ($2.8)
Less: Interest expense, net (14.3) (12.2)
Cash taxes (3.3) (2.2)
Maintenance capital expenditures (6.3) (6.9)
Distributions to minority interest partners (0.2) (2.9)
Distributions from (contributions to) investments in nonconsolidated affiliates 2.2 (19.6)
Free Cash Flow ($24.0) ($46.6)
9