2012 Small Business Profile - A profile of small business in British Columbia pot
Bạn đang xem bản rút gọn của tài liệu. Xem và tải ngay bản đầy đủ của tài liệu tại đây (2.12 MB, 36 trang )
2012
Small Business Prole
Small Business Profile | 2012
CONTENTS
Preface 1
Highlights 3
1 | Small Business Growth 4
2 | Small Business Employment 10
3 | Contribution to the Economy 17
4 | Growth Industries and Specially Defined Sectors 20
5 | Regional Focus 24
6 | Small Business Exporters 29
Technical Notes Inside Back Cover
Information on programs and services for small
businesses can be obtained by contacting:
Small Business BC
601 West Cordova St.
Vancouver, BC V6B 1G1
Telephone: 604.775.5525
Toll Free: 1.800.667.2272
Internet: www.smallbusinessbc.ca
Statistics related to small business are available at:
BC Stats
Data Services
553 Superior St.
Box 9410 Stn Prov Govt
Victoria, BC V8W 9V1
Telephone: 250.387.0327
Internet: www.bcstats.gov.bc.ca
Information on provincial government programs
and services can be found at:
Ministry of Jobs, Tourism and Skills Training
Small Business Branch
Box 9822 Stn Prov Govt
Victoria, BC V8W 9N3
Telephone: 250.397.4699
Fax: 250.925.0113
Internet: www.gov.bc.ca/jti/
This publication is also available electronically
on the following web sites:
www.gov.bc.ca/jti/
www.bcstats.gov.bc.ca
www.resourcecentre.gov.bc.ca/pdf/SmallBusEngWeb.pdf
www.resourcecentre.gov.bc.ca/m/2012profile/index.html
SMALL BUSINESS PROFILE 2012
A profile of small business in British Columbia
Small Business Profile | 2012 page 1
|
PREFACE
Small Business Success Stories:
Job Creation and Innovation
For the past 16 years, the Small Business Profile has reported on the small business climate in
British Columbia using measures such as small business growth, employment and GDP.
There were approximately 385,100 small businesses in British Columbia in 2011, comprising
98 per cent of all businesses and employing over a million people in the province.
As a complement to the statistics, the report highlights seven small businesses that are inspiring
examples of job creators and innovators in British Columbia. Small business is an engine of British
Columbia’s economy, and these small businesses are among the many providing valuable services
that strengthen their communities and drive the economy.
Small Business Profile 2012: A Profile of Small
Business in British Columbia is an update of
previous versions published annually since 1997.
The 2012 report reflects data from 2011, the
most recent year for which data are available.
This report is designed to answer some common
questions about the role of small business in
British Columbia through an examination of
trends in growth. Where possible, it also makes
comparisons with other provinces. Key indicators
examined in this report include the number
of businesses, growth in employment and
earnings, contribution to the economy, industry
distribution, regional focus, and the role of small
business exporters.
Statistical information in this report was prepared
by BC Stats using data provided by Statistics
Canada from various statistical databases, such as
the Business Register, the Survey of Employment,
Payrolls and Hours, the Labour Force Survey and
the Exporter Registry.
Small Business Profile 2012 is produced by the
British Columbia provincial government. The
report was prepared by BC Stats in the Ministry
of Citizens’ Services and Open Government in
partnership with the Ministry of Jobs, Tourism
and Skills Training.
page 2 Small Business Profile | 2012
Entrepreneurial Success
“In custom work, reputation is everything.”
River City Woodworks
Fernie, British Columbia
For more information, visit www.rivercity.ca
It was Fernie’s world class skiing that
first brought Willard Ripley to B.C. and
inspired him to relocate his business,
River City Woodworks, from New
Brunswick in 1989.
“I’m a dyed-in-the-wool skier since
childhood and spent winters since 1975
skiing and teaching skiing in Fernie,”
Ripley says. “I eventually succumbed to
the pull of the Rocky Mountains.”
Today, River City Woodworks has been
operating for over 20 years in Fernie,
producing custom wood products
primarily for the mid to high-end
residential market. From custom doors
to kitchens and bath cabinetry, River City
Woodworks works closely with builders
and home owners to bring to life the
designs their customers have in mind.
Specializing in rustic work and hand
tooling to give a realistic and authentic
aged look, Ripley finds building
products for recreational homes in the
mountains provides the most interesting
work. “The city has challenges of its
own,” says Ripley, “where modern,
stylish designs are becoming ever
more popular, but that’s fun too.”
He has also found himself pursuing
more commercial work, such as store
fronts, restaurant tables, wine rooms
and building facades.
“In custom work, reputation is
everything,” says Ripley. “We at River City
Woodworks believe that ‘you say what
you do and you do what you say,’ and
if you are true to that, you will build
a reputation.”
Since moving to Fernie, River City
Woodworks has expanded its staff
to almost 20, including highly skilled
journeyman tradespeople, and it
continues to grow, with a new sales
office and showroom in Calgary, A.B.,
which was opened in the summer
of 2010.
Ripley says being a small business
owner has taught him a lot, not only
about how to manage finances and
employees, but also about himself.
“I’m a much harder worker than I
thought I was,” Ripley says. “And having
perseverance is a necessary trait. If you
don’t have it, you better get it.”
Small Business Profile | 2012 page 3
NUMBER OF SELF-EMPLOYED
BUSINESS OWNERS IN
BRITISH COLUMBIA, 2011
With paid
help
Without
paid help Total Per cent
Incorporated 94,800 70,800 165,600 40%
Unincorporated 35,300 217,900 253,200 60%
TOTAL SELF-
EMPLOYMENT
130,100 288,700 418,800 100%
Source: Statistics Canada / Prepared by BC Stats
For more information on incorporation, please see page 12.
BREAKDOWN OF BUSINESSES
IN BRITISH COLUMBIA, 2011
Number of
Businesses
Per cent
of total
†
TOTAL SMALL BUSINESSES 385,100 98%
Self-employed without
paid help
‡
217,900 56%
Businesses with less than
50 employees
167,200 43%
TOTAL LARGE BUSINESSES 6,400 2%
TOTAL ALL BUSINESSES 391,500 100%
† Figures do not add due to rounding
‡ Incorporated self-employed are not included in this figure to avoid double-counting, since
they are already included in the count of businesses with fewer than 50 employees.
Source: BC Stats using data supplied by Statistics Canada
Small Business – There were approximately 385,100
small businesses operating in British Columbia in 2011,
accounting for 98 per cent of all businesses in the
province. About 82 per cent of these small businesses
were micro-businesses with fewer than five employees.
Small Businesses Per Capita – In 2011, British
Columbia ranked first in terms of small businesses per
capita, with 84.2 small businesses per 1,000 people.
Saskatchewan had just slightly fewer small businesses
per 1,000 people, at 81.9, but third-ranked Alberta was
well behind with 75.0 businesses per 1,000 people. The
national average was 69.3.
Employment – Approximately 1,027,900 people
were employed by small business in British Columbia
in 2011. These jobs accounted for about 56 per cent of
private sector employment in the province, the second
highest rate in the country.
Employment Growth – The small business sector
in British Columbia felt the effects of continued global
economic uncertainty. Small business employment in
the province fell 1.0 per cent between 2010 and 2011.
However, small businesses have fared relatively well
in the last five years, increasing employment by
2.6 per cent since 2006.
Self-Employed – On average, the self-employed
tend to be older, are more often men and are more
likely to work longer hours than paid employees.
More than 37 per cent of the self-employed in British
Columbia are women, well above the national average.
|
HIGHLIGHTS
Gross Domestic Product – British Columbia small
businesses generated approximately 29 per cent of the
province’s gross domestic product in 2011, well above
the national average of 27 per cent.
Earnings – In 2011, small business provided 32 per
cent of all wages paid to workers in British Columbia,
the highest share of all provinces.
Industry Focus – The mining, oil and gas extraction
industry saw employment grow 24.7 per cent between
2006 and 2011, the strongest growth rate of any of the
industry sectors. At the other end of the spectrum, the
forestry, logging and support industry lost 17.8 per cent
of its employment over the same period; however, the
number of jobs in that industry has increased in each
of the last two years, perhaps signalling a turnaround.
High Technology Sector – There were 8,462 small
businesses in British Columbia’s high tech sector in
2011, which represents about 97 per cent of all high
technology businesses.
Regional Focus – The Thompson-Okanagan region
recorded the highest net growth in the number of small
businesses in British Columbia between 2007 and 2011,
at 7.3 per cent.
Exports – British Columbia small businesses shipped
approximately $16.9 billion worth of merchandise to
international destinations in 2010, comprising almost
55 per cent of the total value of goods exported from
the province.
page 4 Small Business Profile | 2012
A business is defined as a small
business if it is either:
•Abusinesswithfewerthan
50 employees
•Abusinessoperatedbya
self-employed person with
no paid help
A micro-business is defined as
a small business with fewer than
five employees.
Incorporated Businesses
Incorporated businesses consist of
those organized and maintained as
legal corporations. A corporation
is created (incorporated) by one
or more shareholders who have
ownership of the corporation,
represented by their holding of
common stock.
Self-employed
Self-employed individuals are defined
as individuals who spend most of
their working hours operating their
own businesses. The self-employed
can be categorized as either
incorporated
or
unincorporated
.
Each of these classifications can
be further divided between those
operating
with paid help
(i.e., with
employees) or
without paid help
(i.e., working by themselves). This
produces four major categories of
self-employed workers.
Unincorporated Businesses
Unincorporated businesses
consist of
those not organized and maintained
as legal corporations, and wherein
the tie between members need not
be a legally enforceable contract.
|
1
|
SMALL BUSINESS GROWTH
British Columbia’s small business sector has established
itself as an integral instrument of job creation and
economic growth. It is the primary provider of private
sector jobs in the province, reflecting an important and
ongoing trend toward economic diversification. The
small business sector is also a key source of innovation.
For example, approximately 97 per cent of high
technology businesses in British Columbia have
fewer than 50 employees.
Given its importance to the provincial economy, it
is essential to monitor the performance of the small
business sector. Data from opinion surveys, such as those
produced by the Canadian Federation of Independent
Business (CFIB), are useful as a subjective measure of
the sector’s strength. In addition to this analysis, it is also
important to examine more objective measures, such as
business counts, employment, GDP and revenues, to see
if they paint a similar picture of British Columbia’s small
business sector.
What is a small business?
A business can be classified as small, medium or large
through a number of different methods, including
production levels and revenues. However, the most
commonly used definition focuses on the number
of individuals employed. In British Columbia, a small
business is defined as one with either fewer than
50 employees, or a business operated by a person
who is self-employed without paid help.
How many businesses operate
in British Columbia and is that
number growing?
In 2011, British Columbia was home to a total of 391,500
businesses, of which 98 per cent (385,100) were classified
as small businesses. Between 2010 and 2011, the
number of small businesses operating in British Columbia
declined by 1.7 per cent. The number of small businesses
with employees saw a decrease of 1.2 per cent. However,
a larger share of the overall reduction in small businesses
was attributable to a 2.1 per cent drop in businesses
operated by unincorporated self-employed individuals
without paid help.
Various factors could account for this reduction. Faced
with a widespread economic downturn that began in
late 2008, it is possible that a number of small businesses
shed employees, with some owners perhaps even opting
to run their businesses alone.
Small Business Profile | 2012 page 5
FIGURE 1.1
NUMBER OF SMALL BUSINESS IN
BRITISH COLUMBIA, 2007-2011
0
100
200
300
400
Self-employed without paid help
Small businesses with employees
Source: BC Stats using data supplied by Statistics Canada
Thousands
43%
57%
2007
44%
56%
2008
43%
57%
2009
43%
57%
43%
57%
2010 2011
It is also conceivable that in times of job uncertainty,
individuals who faced layoffs or lack of job security
opted to choose self-employment. In the years that
followed, as the economy showed signs of recovery,
some self-employed may have returned to the employee
workforce, resulting in a decline in self-employment
numbers. This may at least partially account for the
decrease in businesses run by self-employed persons
with no paid help.
Despite the slowdown in small business growth in 2011,
the large business sector (50 or more paid employees)
fared worse, dropping off by 4.3%, its third consecutive
annual decline.
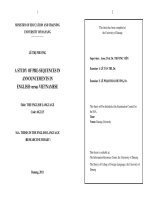
What is the size distribution
of small businesses?
The majority of small businesses in British Columbia are
micro-businesses with fewer than five employees. In 2011,
about 316,600 businesses fit this description, comprising
82 per cent of all small businesses. Of these, 57 per cent
were self-employed persons without paid help and the
remaining 26 per cent employed one to four individuals.
From 2007 to 2011, the number of small businesses in
the province expanded by 0.6 per cent; however, all
FIGURE 1.2
SIZE DISTRIBUTION OF SMALL BUSINESS
IN BRITISH COLUMBIA, 2011
Number of
Businesses
Per cent
of total
†
TOTAL BUSINESSES WITH
0 TO 4 EMPLOYEES
316,600 82%
Self-employed without paid help
‡
217,900 57%
Businesses with 1 to 4 employees 98,700 26%
BUSINESSES WITH 5 TO 19
EMPLOYEES
55,700 14%
BUSINESSES WITH 20 TO 49
EMPLOYEES
12,700 3%
TOTAL SMALL BUSINESSES 385,100 100%
† Figures do not add due to rounding
‡ Incorporated self-employed are not included in this figure to avoid double-counting, since
they are already included in the count of businesses with fewer than 50 employees.
Source: BC Stats using data supplied by Statistics Canada
the growth was in 2009, as there was a slight decline
in businesses between 2007 and 2008 and again in
2010 and 2011.
1
The fastest growing group in the small
business sector between 2007 and 2011 was businesses
with one to four employees, which increased at a rate
of 2.5 per cent, an addition of approximately 2,400 new
businesses. Overall, small business growth in the province
outperformed that of large business. The number of large
businesses declined a hefty 5.8 per cent, as a 2.1 per cent
gain in 2008 was more than offset by three consecutive
years of reductions from 2009 to 2011.
FIGURE 1.3
GROWTH IN NUMBER OF
BRITISH COLUMBIA BUSINESSES, 2007-2011
Growth (#) Growth rate
TOTAL SMALL BUSINESSES 2,400 0.6%
Self-employed without paid help 800 0.4%
Businesses with 1-4 employees 2,400 2.5%
Businesses with 5-19 employees -700 -1.2%
Businesses with 20-49 employees -100 -0.8%
TOTAL LARGE BUSINESSES -400 -5.8%
TOTAL ALL BUSINESSES 2,000 0.5%
Source: BC Stats using data supplied by Statistics Canada
1
Due to a methodological change in 2008, consistent data for British Columbia are only available back to 2007. For other provinces, BC Stats has access only to data back to 2008. As a
result, time series analysis is only possible for the 2007 to 2011 period for British Columbia and the 2008 to 2011 period for the rest of the provinces.
page 6 Small Business Profile | 2012
FIGURE 1.4A
SMALL BUSINESSES, WITH AND WITHOUT
EMPLOYEES, BY INDUSTRY, 2011
Source: BC Stats using data supplied by Statistics Canada
Note: F.I.R.E.: Finance, Insurance & Real Estate
0 5 10 15 20 25 30
Other Primary & Utilties
Accommodation & Food
Manufacturing
Agriculture
Education Services
Transportation & Warehousing
Wholesale & Retail Trade
Health & Social Services
F.I.R.E.
Construction
Other
Business Services
1-49 employees
(Total 167,200)
No paid employees
(Total 217,900)
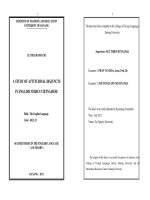
In which sectors are small
businesses concentrated?
Small businesses in British Columbia are engaged in a
number of incredibly diverse activities, which range from
family-owned and operated restaurants to self-employed
dog trainers and small lumber milling operations. More
than three quarters (78 per cent) of all businesses in
the province are in service sector industries, with small
businesses only slightly less likely than large businesses
to be providing a service. In the small business service
sector, the largest concentration is in business services,
which in 2011 accounted for 23 per cent of all British
Columbia small businesses. These include occupations
such as veterinarians and accountants. Next, at 16 per
cent, were “other” services, which include occupations
involving information, culture and recreation. Both
business and “other” services are more concentrated
among businesses with no employees. On the other
hand, firms involved in trade are more likely to have
employees. Wholesale and retail trade also has a
significant presence in the small business service
sector, and in 2011 made up 11 per cent of the province’s
small businesses. Figure 1.4a shows the industry
Within the small business sector, certain industries are
dominated by businesses without employees, while
the opposite is true for some others. For example,
among small businesses providing education services,
about 85 per cent consist of self-employed individuals
without paid help. Conversely, nearly 75 per cent of small
businesses in the hospitality industry employ staff.
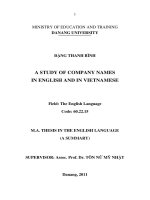
FIGURE 1.4B
TOTAL SMALL BUSINESSES WITH 0-49 EMPLOYEES, 2011
Source: BC Stats using data supplied by Statistics Canada
Service sector Goods sector
(Total: 385,100)
Other 15.8%
Business
Services 22.7%
Accommodation
& Food 3.8%
Health &
Social Serv.
8.5%
Education
Services
3.6%
Finance, Insurance &
Real Estate 8.4%
Wholesale & Retail
Trade 10.6%
Transport. &
Warehousing 5.0%
Agriculture 2.9%
Construction 14.6%
Manufacturing 2.7%
Other Primary
& Util. 1.4%
breakdown for small businesses with employees
compared to that for businesses operated by a self-
employed person with no staff. Figure 1.4b provides
the same dissection for small business overall.
Construction is the most significant industry in the goods
sector, accounting for close to 15 per cent of all small
businesses in the province. Construction is somewhat
more amenable to smaller operations than many other
industries, such as those involved in manufacturing, so
it follows that it has the largest concentration of small
businesses among industries outside the service sector.
Small Business Profile | 2012 page 7
FIGURE 1.5
SMALL BUSINESSES BY INDUSTRY, SHARES
WITH AND WITHOUT EMPLOYEES, 2011
Source: BC Stats using data supplied by Statistics Canada
0 20 40 60 80 100
Other
Business Services
Accommodation & Food
Health & Social Services
Education Services
F.I.R.E.
Wholesale & Retail Trade
Transportation & Warehousing
Agriculture
Construction
Manufacturing
Other Primary & Utilties
0% 20% 40% 60% 80% 100%
1-49 employees
No paid employees
Other
Business Services
Accommodation & Food
Health & Social Services
Education Services
Finance, Insurance & Real Estate
Wholesale & Retail Trade
Transportation & Utilities
Construction
Manufacturing
Primary
How does the prevalence
of small business in
British Columbia compare
with other provinces?
Small business is consistently more prevalent in
Western Canada compared to the rest of the country,
at least in terms of small businesses per capita. In 2011,
FIGURE 1.6
SMALL BUSINESSES PER CAPITA BY PROvINCE, 2011
Source: BC Stats using data supplied by Statistics Canada
69.3 = Canadian average
0
20
40
60
80
100
NL
PEI
NSNB
Que
OntManSask
AltaBC
Small businesses per 1,000 population
FIGURE 1.7
SMALL BUSINESS GROWTH, 2008-2011
Source: BC Stats using data supplied by Statistics Canada
-8%
-6%
-4%
-2%
0%
2%
4%
6%
8%
10%
12%
NL
PEI
NS
NB
Que
Ont
Man
SaskAlta
BC
2.2% = Canadian average
Growth 2008-2011
British Columbia surpassed Saskatchewan to rank first
among the provinces, with 84.2 small businesses per
1,000 people. Along with Saskatchewan (81.9), the
only other provinces to exceed the Canadian average
of 69.3 small businesses per 1,000 people were Alberta
(75.0) and Prince Edward Island (73.7).
Between 2008 and 2011, the number of small
businesses in British Columbia climbed 1.0 per cent,
the strongest growth among the western provinces,
but slightly below the national average (+2.2 per cent).
Nova Scotia (+8.0 per cent) led the country in small
business growth, followed by Ontario (+4.7 per cent).
New Brunswick (+4.2 per cent) was the only other
province to see higher small business growth than
British Columbia, while four others posted declines.
page 8 Small Business Profile | 2012
Entrepreneurial Success
For decades, the Haida Nation has
wished to increase its presence directly
in the forest industry on the Islands.
Taan Forest is doing just that, firstly
by protecting valuable lands on the
Islands requiring special attention
and secondly through a balance
of environmental protection and
responsible logging practices.
At its core, Taan Forest is a logging
and lumber business, but it is so much
more than that. Its sustainable timber
harvesting model is firmly entrenched in
the Haida Culture, as the Haida people
have inhabited the land there for more
than 12,000 years.
Taan Forest manages 270,000 acres
of ancient Haida Gwaii rainforest, and
handles all aspects of the business from
harvest to production and sales. Taan
Forest and the Haida people carefully
choose from the finest available western
red cedar, yellow cedar, Sitka spruce and
western hemlock. They then custom cut
the timber and deliver it to anywhere in
the world.
When asked what is behind the
business’ success, Taan Forest President
Bob Brash says, “a strong-willed Haida
Nation, with pragmatic and realistic
short-term and long-term goals.”
Taan Forest employs eight people
directly, and has grown to include over
120 direct and indirect contractors. It is
also the first company to achieve Forest
Stewardship Council (FSC) accreditation
on the coast in 11 years, making it the
largest holder of 100 per cent certified
FSC wood on the B.C. coast.
Brash says he expects Taan Forest to
continue a strong upward path as it
gears up its harvesting operations and
expands its initial lumber programs.
“Over the next couple of years, we
expect to develop a widely known and
recognized brand in the market place,”
says Brash. “This will help us create a
significant amount of local jobs in Haida
Gwaii. Our goal is to transform the very
core of the Islands’ economy.”
“Our goal is to transform the very core of the Islands’
economy.”
Taan Forest
Haida Gwaii, British Columbia
For more information, visit www.taanforest.com
Small Business Profile | 2012 page 9
Entrepreneurial Success
audience. Green says, ironically, it is also
the least profitable side of what they do,
but they are discovering new ways to
marry the principles that matter most
with the best way to fund them.
“The research is important, and we
are proud that our reasoning is being
heard and action is coming from it,”
Green says.
To date, MGA has been behind the
design of office interiors, a restaurant
and lodge on Whistler Blackcomb,
schools for the Aga Khan, Ronald
McDonald House at BC Children’s
Hospital, private residences and
residential towers, to name a few.
In the future his firm will be looking
for bigger projects in Vancouver and
around the province, where it can team
with other consultants and clients
to help build a positive environment
for B.C.
“It’s great fun to share in the world of
building a province. It takes a lot of
determination, hard work and creativity.
We are proud to be a part of B.C.’s
future,” Green says.
The name says it all – Michael Green
is the sole proprietor of Michael Green
Architecture (MGA), a full-service
design firm with a particular focus on
architecture interiors, landscape design,
product design and planning.
Green launched MGA this year with a
full complement of 16 staff, including
associates, architects and designers,
after closing operations of his previous
firm, which he shared with two other
partners.
Green says what he likes most about
being a small business owner is the
power to respond to different situations
and opportunities quickly, as well as the
ability to be truly innovative.
“Nimbleness is good for business and
great for the soul of the adventurer
at heart that I can be,” says Green. “I
think most small business owners are
adventurers; sometimes by birth and
sometimes by the reality of juggling
the many balls it takes to keep a small
business moving forward. For all of
us in small business, each day can be
an adventure.”
MGA has been conducting ongoing
research into the future of tall wood
buildings and carbon neutral urban
buildings, which has reached the widest
“It’s great fun to share in the world of building a province.”
Michael Green Architecture
Vancouver, British Columbia
For more information, visit www.mg-architecture.ca/
page 10 Small Business Profile | 2012
|
2
|
SMALL BUSINESS EMPLOYMENT
How many jobs does small
business provide in British
Columbia?
In 2011, approximately 1,027,900 jobs in British Columbia
were derived from small business, accounting for 45 per
cent of total employment in the province.
FIGURE 2.1
SHARE OF TOTAL EMPLOYMENT, B.C., 2011
Source: BC Stats using data supplied by Statistics Canada (Total: 2,274,700)
Large Business
36%
Public Sector
19%
Small Business
45%
FIGURE 2.2
PRIvATE SECTOR EMPLOYMENT IN BRITISH COLUMBIA
BY SIZE OF BUSINESS, 2011
Employment
Per cent
of Total
TOTAL SMALL BUSINESS
EMPLOYMENT
1,027,900 56%
Self-employed 421,500 23%
Employed by small business 606,400 33%
LARGE BUSINESS
EMPLOYMENT
821,500 44%
TOTAL PRIVATE SECTOR
EMPLOYMENT
1,849,400 100%
Source: BC Stats using data supplied by Statistics Canada
The private sector (both small and large businesses)
employed approximately 1,849,400 people. The 1,027,900
people working for a small business translates into
56 per cent of private sector jobs, a ratio that has
remained relatively stable over the past decade. In 2011,
self-employed workers represented nearly a quarter
(23 per cent) of total private sector employment, while
33 per cent were employed by a small business.
In 2011, small business employment slipped, contracting
by 1.0 per cent over 2010 levels. This came on the heels
of a relatively strong year in 2010, when the province
saw a 1.4 per cent gain in small business employment.
Given the uncertain economic climate of recent years,
the volatility in small business employment in British
Columbia (and other provinces) is understandable.
However, this decline was in direct contrast to large
business, which saw employment climb by 3.7 per cent.
The decline in small business employment in 2011 was
the result of a 2.5 per cent drop in the number of self-
employed. Meanwhile, the number of employees of small
business remained stable, inching up 0.1 per cent. Self-
employment in British Columbia has been rather volatile
in recent years, and has generally been outperformed by
growth rates for employees of small businesses. In fact, in
2011, there were 17,300 more small business employees
in British Columbia than in 2006, a 2.9 per cent increase
over the five-year period. Coupled with a slightly more
modest 2.2 per cent rise in self-employment, this increase
made for a 2.6 per cent jump in overall small business
employment (including self-employed) between
2006 and 2011. By comparison, employment in large
businesses increased 7.6 per cent over the same period.
Compared to some other provinces, small business
employment growth in British Columbia fared well
over the five-year span. Although the province’s
2.6 per cent growth rate fell short of the national
average (+3.9 per cent), it outperformed most of its
easternmost counterparts. Ontario (+5.8 per cent) led
the nation in small business employment growth, while
Newfoundland and Labrador experienced the most
substantial decline (-4.5 per cent).
Small Business Profile | 2012 page 11
FIGURE 2.4
SMALL BUSINESS AS A PER CENT OF
PRIvATE SECTOR EMPLOYMENT BY PROvINCE, 2011
FIGURE 2.3
SMALL BUSINESS EMPLOYMENT
GROWTH BY PROvINCE, 2006-2011
Source: BC Stats using data supplied by Statistics Canada
Growth 2006-2011
-6%
-5%
-4%
-3%
-2%
-1%
0%
1%
2%
3%
4%
5%
6%
NLPEINS
NB
Que
Ont
Man
Sask
Alta
BC
3.9% = Canadian average
Source: BC Stats using data supplied by Statistics Canada
0%
10%
20%
30%
40%
50%
60%
70%
NL
PEINS
NB
Que
OntMan
Sask
Alta
BC
49% = Canadian average
How does British Columbia’s
small business employment
compare with other
provinces?
In 2011, British Columbia maintained its rank of second
among the provinces in percentage of total private
sector jobs derived from small business. Approximately
56 per cent of the province’s private sector employment
is provided by small business. Prince Edward Island
ranked first (close to 57 per cent), followed by
Saskatchewan (just over 55 per cent). Conversely, Ontario
(46 per cent) had the least reliance on small business for
private sector employment. Nationally, small business
supplied 49 per cent of private sector employment.
Significant variation exists among the provinces in small
business employment, likely due to regional differences
in economic structure. For example, Saskatchewan
and Prince Edward Island have substantial agricultural
and fishing sectors, respectively, and these sectors are
commonly characterized by smaller operations with
fewer employees. By contrast, Ontario is more likely
to have a higher percentage of employment in large
business, being one of the country’s manufacturing hubs
(particularly in the automotive industry). British Columbia
has a larger service sector than other provinces, which
may account for a stronger presence of small businesses.
SELFEMPLOYMENT
According to a recent poll conducted on behalf of
the Canadian Federation of Independent Business,
94 per cent of Canadians admire entrepreneurs and
92 per cent would approve of an immediate family
member starting their own business.
2
It is not surprising
that entrepreneurialism garners such respect, given that
much of what drives communities and their respective
economies is thanks to self-employed individuals
operating local businesses.
What proportion of total
employment consists of
the self-employed?
Individuals classified as “self-employed” are those
who spend most of their working hours running their
own businesses. In 2011, self-employment accounted for
18.5 per cent of total employment in British Columbia.
Over the past five years, the proportion of British
Columbia’s workforce consisting of self-employed
workers has remained sizeable, hovering between
18 and 20 per cent.
The province’s share of self-employed workers is the
highest in the country, more than three percentage
points above the Canadian average of 15.4 per cent.
2
Troster, N. (July, 2011). Perspectives on Small Business in Canada. Canadian Federation of Independent Business.
page 12 Small Business Profile | 2012
FIGURE 2.6
SELF-EMPLOYMENT AS A PER CENT OF TOTAL
EMPLOYMENT BY PROvINCE, 2011
FIGURE 2.5
BRITISH COLUMBIA’S SELF-EMPLOYMENT
AS A PER CENT OF TOTAL EMPLOYMENT, 2006-2011
Source: Statistics Canada / Prepared by BC Stats
0%
5%
10%
15%
20%
201120102009200820072006
Source: Statistics Canada / Prepared by BC Stats
0%
5%
10%
15%
20%
NLPEINSNBQueOntManSaskAltaBC
15.4% = Canadian average
With its heavy reliance on family farming operations,
Saskatchewan (also 18.5 per cent) is the only province to
have a comparable proportion of self-employed workers.
However, over the last 20 years or so, the number of
farmers in Saskatchewan has been drifting downward,
a trend that may impact that province’s share of self-
employed workers. Alberta (16.8 per cent) was the only
other province to exceed the national average in 2011,
while Newfoundland and Labrador (9.4 per cent) had by
far the lowest proportion of self-employed workers.
How many self-employed
people are there in British
Columbia and is this
number growing?
There were 421,500 self-employed workers in British
Columbia in 2011, including 2,600 people working
in family businesses without pay. This leaves 418,800
self-employed business owners.
3
Most (60 per cent)
of self-employed businesses were unincorporated.
Unincorporated individuals, working on their own
with no employees, made up the largest class of
self-employed small businesses. Over half (52 per cent)
of all self-employed workers fit this description.
In 2011, the overall number of self-employed workers in
British Columbia slipped 2.5 per cent, or by approximately
10,800 workers. This decrease followed a similar
decline in 2010 and marked only the second loss in
self-employment in British Columbia in the past decade.
A number of factors can impact self-employment
patterns. In 2009, when self-employment jumped
3.9 per cent, the uneasy economic environment may have
had a significant impact. In these unsure economic times,
certain people may have turned to self-employment in
the face of layoffs or lack of job security. The subsequent
declines recorded in 2010 and 2011 may reflect a return
of such workers to the employee workforce.
4
Among the self-employed in British Columbia, sole
operators are more common than employers with
staff. This is not surprising, given that businesses
often begin with one individual running a business,
and, as the business grows, these individuals may take
on employees.
FIGURE 2.7
NUMBER OF SELF-EMPLOYED BUSINESS OWNERS
IN BRITISH COLUMBIA, 2011
With
paid help
Without
paid help Total Per cent
Incorporated 94,800 70,800 165,600 40%
Unincorporated 35,300 217,900 253,200 60%
TOTAL SELF-
EMPLOYMENT
130,100 288,700 418,800 100%
Source: Statistics Canada / Prepared by BC Stats
3
These numbers do not sum due to rounding.
4
It is possible that some people take up self-employed work to supplement their salaried income. However, such workers are not included in figures quoted in this report. The “self-
employed” as counted here are people for whom their self-employed work constitutes the job “at which they work the most hours,” except where specifically indicated otherwise.
Small Business Profile | 2012 page 13
FIGURE 2.8
NUMBER OF SELF-EMPLOYED WITH PAID HELP COMPARED
TO SELF-EMPLOYED WITHOUT PAID HELP, B.C., 2006-2011
Source: Statistics Canada / Prepared by BC Stats
Thousands
0
50
100
150
200
250
300
350
Self-employed without paid helpSelf-employed with paid help
201120102009200820072006
Over the last decade, the number of self-employed
persons with employees, regardless of incorporation
status, expanded at a much slower rate (+9.2 per cent)
than those without paid help (+26.5 per cent). This
pattern has also held true in more recent years. In fact,
between 2006 and 2011, the number of sole operators
experienced a solid 6.6 per cent rise, while the number
of employers with staff declined (-4.9 per cent). However,
the opposite was true in 2011, as the decrease among
the self-employed with staff (down 1.3 per cent) was
overshadowed by that of those without employees
(down 3.4 per cent).
What is the prole of a
self-employed person
in British Columbia?
People choose self-employment for many reasons.
Students, semi-retired persons or even people looking to
earn extra income may prefer self-employment to other
options because it offers more flexibility. Other potential
factors include technological changes that allow people
the option of working from home, and the increase in
dual-earner families and desire to balance family and
work. Others are compelled by an entrepreneurial drive
that induces them to build their own businesses. In fact,
in 2011, 60 per cent of Canadian small business owners
listed being their own boss and making their own
decisions as a reason they started their own business.
Financial opportunity and having a flexible schedule
were also high on the list.
5
On average, self-employed people tend to be older,
are more often men, work longer hours and are less
likely to be Aboriginal.
Over half (51 per cent) of British Columbia’s self-
employed people are between the ages of 35 and 54,
whereas just 45 per cent of employees fall into this age
range. Similarly, while 40 per cent of employees are
under the age of 35, just 16 per cent of self-employed
business owners fit this description. At the other end of
the scale, 32 per cent of entrepreneurs are aged 55 and
over, compared to a mere 16 per cent of employees.
There are a number of reasons for the different age
structure of self-employed persons and employees.
5
Troster, N. (July, 2011). Perspectives on Small Business in Canada. Canadian Federation of Independent Business.
Many younger people under the age of 25 lack the
skills and capital to start and operate a business. By
comparison, for older workers, self-employment may
be used as a transition from working at a full-time job
to moving into retirement. Indeed, nine per cent of self-
employed business owners are 65 and over, but only
two per cent of employees are in this age range. As self-
employed business owners reach potential retirement
age, they might be more prone to carry on working as
they are the main decision-makers of their businesses.
Employees, on the other hand, may be more inclined
to retire at a socially predetermined age thanks to the
pension and/or retirement package available to them.
In British Columbia, self-employment as a percentage of
all workers has been growing steadily in all age groups.
However, among people over the age of 55, there has
been a particularly sharp increase in the propensity to be
self-employed, which may be partly retirement-related.
Many of those who have retired or semi-retired from their
professions seek alternative sources of income that offer
them the flexibility typical of self-employment. Also, on
average, the self-employed tend to retire at an older age
than the general workforce. The median retirement age
(the age at which half of retirees are older and half
younger) for all Canadian retirees in 2011 was
62.3 years, a full year older than just five years prior
(61.2 in 2006). By comparison, the median retirement age
for the self-employed in 2011 was 65.1 years of age,
page 14 Small Business Profile | 2012
FIGURE 2.9
AGE DISTRIBUTION OF SELF-EMPLOYED WORKERS
COMPARED TO EMPLOYEES, BRITISH COLUMBIA, 2011
Note: Percentages do not add to 100 due to rounding
Source: Statistics Canada / Prepared by BC Stats
Age
9%
24%
30%
21%
13%
3%
2%
14%
24%
21%
23%
17%
0
EmployeesSelf-employed
15-24
25-34
35-44
45-54
55-64
65+
6
On January 1, 2008, British Columbia adopted legislation prohibiting mandatory retirement of persons who are 65 years of age and older.
relatively unchanged from 2006 (64.8 years), but
significantly higher than that of the average Canadian.
It remains to be seen what sort of long-term effect the
recent loosening of mandatory retirement in British
Columbia could have on employment and self-
employment of older Canadians, and whether the
apparent increases in retirement age across most types
of employment will continue in upcoming years.
6
Gender is another factor distinguishing the self-
employed from employees. Self-employed individuals
are more often male and employees are slightly more
likely to be female. In 2011, close to two-thirds of
British Columbia’s self-employed were men. However,
entrepreneurial women have a substantial presence
in business, both in British Columbia and in the rest
of the country. Approximately 37.4 per cent of all
business owners in British Columbia in 2011 were
women, well above the national average of 35.4 per cent
and the second highest rate among the provinces. British
Columbia trailed only New Brunswick (39.6 per cent), with
respect to the share of businesses owned by women.
In British Columbia, differences in the number of hours
worked per week also distinguishes the self-employed
from employees. On average, the self-employed have
much longer work days than employees. A quarter
(25 per cent) of self-employed individuals work 50 or
more hours per week, compared to just four per cent
of employees. By contrast, only 28 per cent of the self-
employed work 35 to 40 hours per week, compared to
63 per cent of employees. In 2011, the average work
week for self-employed workers was 36.5 hours, and
34.7 hours for employees. The disparity in work hours
between the self-employed and employees has
remained relatively unchanged over the last decade. The
average work week for the self-employed has fluctuated
only slightly (between about 37 and 40 hours), while the
average for employees has remained even more stable,
hovering around 35 since the beginning of the decade.
FIGURE 2.10
PROPORTION OF SELF-EMPLOYED
WHO ARE WOMEN, BY PROvINCE, 2011
Source: Statistics Canada / Prepared by BC Stats
0%
5%
10%
15%
20%
25%
30%
35%
40%
NLPEINSNBQueOntManSaskAltaBC
35% = Canadian average
FIGURE 2.11
HOURS WORKED, SELF-EMPLOYED COMPARED
TO EMPLOYEES, BRITISH COLUMBIA, 2011
Source: Statistics Canada / Prepared by BC Stats
Usual hours worked per week
12%
17%
10%
7%
21%
7%
25%
14%
8%
21%
43%
4%
4%
7%
EmployeesSelf-employed
50+
41-49
40-40
35-39
30-34
15-29
1-14
Small Business Profile | 2012 page 15
However, a new pattern may be emerging, as the average
number of hours worked by British Columbia’s self-
employed has been declining for the past four years.
Self-employed Canadians who work long hours represent
an even larger portion of total self-employed than in
British Columbia. In 2011, 30 per cent of self-employed
workers in Canada averaged 50 hours or more per week,
five percentage points more than in British Columbia
(25 per cent). Nationally, the average work week for self-
employed workers is approximately 40 hours, three hours
more than the average in British Columbia (37 hours).
There are several possible reasons why certain self-
employed business owners work longer hours. These
include lack of available staff to do extra work, or lack of
capital to compensate staff for overtime. In some cases,
self-employed individuals may have more passion for a
business that they can call their own, and hence, more
drive to work longer hours.
Examining self-employment trends for Aboriginal
peoples in British Columbia provides some insight on
the diversity of small business owners in the province.
Data for 2011 indicate that Aboriginal peoples living
off-reserve continue to be significantly less likely to be
self-employed than non-Aboriginals. In that year,
13.9 per cent of Aboriginal peoples in British Columbia
were self-employed, compared to 18.7 per cent of non-
Aboriginals who worked for themselves. One explanation
for this difference may be the younger age distribution of
Aboriginal people relative to the overall population, given
the older age composition of self-employed individuals
compared to those who are employees.
How does self-employment
growth in British Columbia
compare with other
provinces?
Over the last five years, British Columbia has shown
moderate self-employment growth. The province’s five-
year growth rate of 2.2 per cent between 2006 and 2011
is notably below the national average (+6.8 per cent).
However, with an increase of 11.3 per cent, Ontario was
responsible for much of the growth at the national level
and only two other provinces exceeded the Canadian
average. Over this period, Newfoundland and Labrador
saw by far the most notable decline in self-employment
(-22.0 per cent), likely reflecting the ongoing drop in the
number of independent fishing operations in that part of
the country.
FIGURE 2.12
PER CENT OF WORKING, OFF-RESERvE ABORIGINALS
COMPARED TO NON-ABORIGINALS WHO ARE
SELF-EMPLOYED, BRITISH COLUMBIA, 2006-2011
Source: Statistics Canada / Prepared by BC Stats
0%
5%
10%
15%
20%
25%
Non-AboriginalAboriginal
201120102009200820072006
FIGURE 2.13
SELF-EMPLOYMENT GROWTH BY PROvINCE, 2006-2011
Source: Statistics Canada / Prepared by BC Stats
-25%
-20%
-15%
-10%
-5%
0%
5%
10%
15%
20%
NLPEINSNBQueOntManSaskAltaBC
6.8% = Canadian average
page 16 Small Business Profile | 2012
Entrepreneurial Success
Imagine a place where you can stay in
a century-old home with a waterfall,
walking paths, a labyrinth, a saltwater
pool, billiards, meeting rooms and
gourmet food. That’s just some of what
the Sasquatch Crossing Eco Lodge has
to offer.
The 10,000 sq. ft. lodge, which was
purchased by the Sts’ailes First Nation
in 2009, also offers cultural experiences
such as drum making, cedar weaving
and storytelling.
Chief Willie Charlie, CEO of Sts’ailes
Development Corporation, says the
lodge is positioned in a culturally
historic location, adding that is named
the Sasquatch Crossing Eco Lodge for
a reason!
“The name Sasquatch Crossing came
from the Sts’ailes Elders who wanted to
honour the historic sightings of Sa:sq’ets
(Sasquatch) crossing from the nearby
mountains to the Chehalis and Harrison
Rivers,” Charlie says.
The Sasquatch Crossing Eco Lodge
is an award winning facility. It was
recognized on March 29, 2012 with the
Outstanding Accommodations Award
at Canada’s first National Aboriginal
Tourism Conference.
“It has also proven to both me and my community that
with dedication and hard work, success is achievable.”
Sasquatch Crossing Eco Lodge
Agassiz, British Columbia
For more information, visit www.stsailesdevcorp.com/tourism/sasquatch-crossing-eco-lodge/
Hosts Denny and Al Stobbart are
credited with a lot of the lodge’s
success, because of their willingness
to share the Sts’ailes culture and their
welcoming hospitality.
“Running a small business has allowed
me to make new friends, develop
relationships with people from around
the world and share in their varied
cultures and experiences,” says Denny
Stobbart. “It has also proven to both
me and my community that with
dedication and hard work, success
is achievable.”
The Sasquatch Crossing Eco Lodge
works with many organizations to
offer its numerous unique cultural
experiences, including the Aboriginal
Tourism Association of British Columbia,
destination marketing organizations,
the municipalities of Harrison, Chilliwack
and Mission, Vancouver Coast and
Mountains Tourism and the Ministry
of Jobs, Tourism and Skills Training.
Small Business Profile | 2012 page 17
Source: BC Stats
0%
5%
10%
15%
20%
25%
30%
35%
NLPEINSNBQueOntManSaskAltaBC
27% = Canadian average
FIGURE 3.1
SMALL BUSINESS CONTRIBUTION
TO GDP BY PROvINCE, 2011
|
3
|
CONTRIBUTION TO THE ECONOMY
How large is the contribution
of small business to British
Columbia’s economy relative
to other provinces?
Small business contributes to the provincial economy not
only by creating and maintaining jobs, but also through
its production of goods and services and by meeting
payrolls that support families and stimulate further
economic activity.
The key measure of economic production of a sector is
its gross domestic product (GDP). GDP represents the
value that a sector adds to the raw inputs it uses, which
is an important aspect of the sector’s contribution to
the economy. In 2011, British Columbia’s small business
GDP accounted for 29 per cent of the provincial GDP,
second only to Prince Edward Island and Saskatchewan
(each 32 per cent) and above the Canadian average of
27 per cent. This measure indicates that small business
in British Columbia plays a more significant role in the
provincial economy than it does in most other parts of
the country. The significant contribution of small business
is at least partly due to the fact that British Columbia
has traditionally been more service sector-oriented than
most other provinces, and much of the nation’s growth in
small businesses has been concentrated in service sector
industries. The proportion was lowest in Newfoundland
and Labrador (20 per cent), which is likely a reflection
of the increased role of large business in the offshore oil
industry in that province’s economy.
Gross Domestic Product (GDP)
refers to the total market value of all the goods and
services produced within national or provincial borders
during a specified period. The growth rates of GDP
provide an indication of how well an industry or an
economy is doing. The GDP of an industry (also referred
to as value added) equals output by the industry minus
the value of intermediate inputs that were purchased
from other industries, domestic or foreign. Value added
is a measure of how much an industry has contributed
to the value of its output over and above the value of
intermediate inputs. GDP by industry for the economy
as a whole is the sum of values added by all industries
resident in Canada.
How does average pay
compare between small
and large businesses?
On average, small businesses tend to pay their
employees lower wages compared to larger businesses.
There are several possible reasons that employees of
small business are willing to work for somewhat less than
their large business counterparts. Some small businesses
compensate for much of this wage disparity by providing
benefits not offered by some larger businesses, such as
more flexible working hours. In fact, according to a recent
poll, over a third (36 per cent) of employees of Canadian
small businesses indicated that they choose to work for a
small business in order to have a more flexible schedule.
Other top reasons for working for small business include
having the opportunity to contribute to the business
(35 per cent) and believing in what the business is doing
(45 per cent).
7
7
Troster, N. (July, 2011). Perspectives on Small Business in Canada. Canadian Federation of Independent Business.
page 18 Small Business Profile | 2012
FIGURE 3.2
CHANGES IN AvERAGE ANNUAL EARNINGS,
BRITISH COLUMBIA, 2006-2011
Small business Large business
Earnings 2005 (payroll/
employee)
$ 34,767 $ 41,106
Earnings 2010 (payroll/
employee)
$ 38,811 $ 46,594
PER CENT CHANGE 11.6% 13.4%
Source: BC Stats using data supplied by Statistics Canada
In 2011, the average small business employee earned
an annual salary of $38,811, compared to $46,594
for employees of large business, which amounts to a
difference of about $7,800. It is likely that at least part of
this wage gap is related to productivity. Larger firms tend
to be more productive than small businesses because
they can take advantage of economies of scale and
can better afford necessary capital improvements, such
as machinery and technological equipment that can
substitute for low-skilled labour. Consequently, larger
firms often achieve more output per employee and can
therefore afford to pay their employees higher wages.
Another possible factor in the wage difference is that
small businesses are far less likely to be unionized. In
general, employees who belong to unions tend to earn
higher wages than non-unionized employees.
Between 2006 and 2011, the difference between wages
of employees of small and large businesses widened
somewhat, as average earnings of small business
employees increased at a slower pace than those of
their large business counterparts. Employees of small
businesses saw their average wages increase 12 per cent
over this period, compared to a 13 per cent boost for those
working for larger businesses. At the beginning of the
decade, the difference between earnings of employees
of small and large businesses held fairly steady at
approximately $8,000, but contracted significantly
between 2005 and 2008, by which point it had shrunk
to $5,300. However, in 2009, this pattern came to a halt
and 2011 marked the third consecutive year in which
the gap widened.
The increase in wages among small businesses between
2005 and 2008 is probably related to the labour crunch
experienced in British Columbia in those years. In a tight
labour market, small businesses have to compete with
both large businesses and one another for workers.
Higher wages act as a mechanism to both retain existing
employees and also attract new workers. Conversely,
in 2009, the economic downturn likely expanded the
labour pool as businesses both large and small were
forced to lay off workers. In 2010 and 2011, as the effect
of the uncertain economic climate lingered, some small
8
Public administration refers to establishments that are mainly involved in governmental activities such as policing and judicial matters, national defence and regulatory issues, to name a
few. It is an area of contention whether or not public administration should be considered in a count of businesses. However, given that other organizations, such as Statistics Canada and
Industry Canada, include public administration in business counts, to be consistent, it is included in this study as well.
businesses may have asked staff to take wage cuts
to avoid layoffs or found it unnecessary to offer new
employees higher wages.
How does average pay
compare across industries for
small versus large businesses?
With the exception of employees working in trade
(wholesale and retail trade), small business wages
continue to lag those of businesses with 50 or more
employees for all major industry groupings. Workers in
the trade industry continue to earn more on an average
annual basis than their counterparts working for large
businesses. This disparity remains localized in retail trade,
which is a sector that often has difficulty retaining staff.
Employers in retail trade may offer raises in order to
maintain staffing levels needed for business operations.
Among other industries, significant wage differences
exist between workers of small and large businesses. In
2011, the largest wage gap was in public administration,
8
where large businesses paid approximately $18,100
more, on average, than their counterparts in small
business. Another industry with historically significant
wage disparities is construction. This was again the case
in 2011, as employees working for small businesses
earned roughly $17,700 less per annum than those
working for large construction companies. Manufacturing
was the only other industry in which the average wage
gap between large and small business was in the five-
figure range ($11,600). At just over $800, the smallest
Small Business Profile | 2012 page 19
FIGURE 3.3
AvERAGE ANNUAL EARNINGS
BY INDUSTRY, BRITISH COLUMBIA, 2011
Source: BC Stats using data supplied by Statistics Canada
Note: F.I.R.E. = Finance, Insurance & Real Estate
Thousands
$0 $20 $40 $60 $80 $100
Large businessSmall business
Total
Other Services
Prof. & Bus. Services
Public Administration
Health & Education
F.I.R.E.
Wholesale & Retail Trade
Transp. & Storage
Manufacturing
Construction
Utilities
Mining
Forestry
difference between salaries is in trade, followed by “other
services” (just over $1,200). “Other services” includes
accommodation and food, whose employees earn the
lowest wages of all industries, on average, regardless of
business size. On the other end of the scale, the highest
wage earners in 2011 were in utilities.
9
How does British Columbia
compare in terms of the
portion of total payroll
generated by small business?
Of all the provinces, British Columbia has the highest
reliance on small business payrolls. In 2011, small
business accounted for nearly a third (32 per cent) of
wages paid to workers. Second-ranked Quebec was a
full five percentage points lower than British Columbia,
with just over 27 per cent of its provincial payroll
comprising wages paid to small business employees.
The Canadian average was also approximately 27 per
cent. At 23 per cent, Manitoba was the province with
the smallest percentage of payroll derived from small
business. The high portion of payroll generated by small
business in British Columbia is partly due to the large
role that small business plays in the province’s economy.
Also, wages in industries that are less prevalent in British
Columbia, such as agriculture, tend to be lower, which
can affect the size of payrolls in provinces that rely more
heavily on these industries.
9
The wage data are from Statistics Canada’s Survey of Employment, Payrolls and Hours, which does not include data for the agriculture and fisheries industries. Data for the
accommodation and food sector do not include gratuities.
FIGURE 3.4
SMALL BUSINESS SHARE OF TOTAL PAYROLL
BY PROvINCE, 2011
Source: BC Stats using data supplied by Statistics Canada
0%
5%
10%
15%
20%
25%
30%
35%
40%
NLPEINSNBQueOntManSaskAltaBC
27% = Canadian average
page 20 Small Business Profile | 2012
FIGURE 4.1
NUMBER OF NET NEW SMALL BUSINESSES – FASTEST
GROWING SECTORS IN BRITISH COLUMBIA, 2007-2011
Source: BC Stats using data supplied by Statistics Canada
Note: Excludes self-employed without paid help
Growth 2007-2011 (#)
-600 -400 -200 0 200 400 600 800 1000
Secondary Manufacturing
Tourism
High Technology
SPECIALLY DEFINED SECTORS
Food Serv. & Drinking Places
Ambulatory Health Care
Professional, Sci. & Tech.
Specialty Trade Contractors
Real Estate
|
4
|
GROWTH INDUSTRIES AND
SPECIALLY DEFINED SECTORS
Although more traditional resource extraction-based
industries – namely forestry and mining – still play
a prominent role, sectors such as tourism and high
technology have come to represent a significant portion
of the provincial economy. The secondary manufacturing
sector is also important, in that adding value to goods
stands out as a potential source of future economic
growth in British Columbia. Since such industries are far
less reliant on capital-intense resource extraction, they
are well-suited for development by small business.
For example, in the high technology sector, small
businesses comprise 97 per cent of employers.
10
The basis for growth in this sector is innovation, and
services can be performed with few employees from
small plants, offices and even homes.
NUMBER OF SMALL
BUSINESSES
Which industries show the
greatest increase in the
number of small businesses?
Between 2007 and 2011, the real estate sector recorded
the most notable small business growth in terms
of numbers, with a net addition of close to 1,000
establishments. Real estate added businesses in every
year over this period, with the largest jump seen in 2011.
With almost 900 establishments added, the next highest
rise in net new small businesses was seen in the specialty
trade contractors industry. Much of the overall gain in
the five-year period was recorded in the years leading up
to the 2010 Winter Olympics in Vancouver. Despite the
fact that the five-year reporting period encompasses
the global economic downturn, 2011 marked the only
year in which this industry recorded a loss.
At the other end of the spectrum, the most substantial
loss in number of small businesses was seen in private
household businesses, which includes at-home services
such as cleaning, child-care and gardening. This industry
saw a loss of 1,176 businesses between 2007 and 2011.
The forestry and logging sector also lost a substantial
number of businesses over this period (-559), likely due
to reduced demand for forest products, particularly as a
result of the slump in housing starts in the United States.
Many of the province’s logging operations are smaller
businesses, which is why that particular industry segment
took such a large hit.
10
Data for self-employment by industry are only available at a large industry aggregation and cannot be calculated for non-standard industries, such as high technology and tourism.
Therefore, in order to maintain consistency and to enable a finer examination by industry, the figures provided in this chapter are for paid employees only and may differ from other parts
of this report.
Specially Dened Sectors
This section contains information on non-standard
industries that are not defined under the North American
Industry Classification System (NAICS) used by Statistics
Canada. The tourism, high technology and secondary
manufacturing sectors are called “specially defined
sectors” in this report and are in fact composites of
smaller parts of traditionally defined industries under
NAICS. Tourism, for example, includes data from parts
of the transportation industry, accommodation and
food services, and information, culture and recreation
services, among others. High technology includes both
manufacturing and services components.
Small Business Profile | 2012 page 21
Of the three specially defined sectors, high technology
has experienced the strongest growth in the count
of small businesses with a net addition of 173 new
businesses between 2007 and 2011. However, all the
gains were in high technology services, as the number of
high technology manufacturing establishments actually
declined over the same period.
Since 2008, factors such as increased competition from
other countries, the appreciation of the Canadian dollar
and a reduction in demand in the wake of the global
recession, have impacted the manufacturing sector
as a whole, across most industries. British Columbia’s
secondary manufacturing sector saw a net decline of
521 small businesses from 2007 to 2011, with losses
recorded in every year.
In the tourism sector, there was a net addition of 46 new
businesses between 2007 and 2011. Business counts
in this sector have been seesawing in recent years and
the overall increase was based solely on the strength of
gains made in 2008 and 2010. As with the manufacturing
sector, the appreciation of the Canadian dollar has likely
had a negative impact on tourism in British Columbia.
North American Industry
Classification System (NAICS)
The North American Industry
Classification System (NAICS) is
an industry classification system
used in Canada, the United States
and Mexico, which is designed
to provide common definitions
of the industrial structure of the
three countries. NAICS is Statistics
Canada’s comprehensive system
encompassing all economic activities.
It has a hierarchical structure: at
the highest level, it divides the
economy into 20 sectors; at lower
levels, it further distinguishes the
different economic activities in which
businesses are engaged.
Special Sector Definitions
Tourism includes industries such as
transportation, accommodation, food
services and other tourism-related
activities. (Further information on the
tourism sector is available at: www.
bcstats.gov.bc.ca/StatisticsBySubject/
BusinessIndustry/Tourism.aspx)
High technology industries may
employ a high proportion of scientists
and researchers or invest a high
proportion of revenues in research
and development. Other industries
that produce high technology
products are also included. (Further
information on the high technology
sector is available at:
www.bcstats.gov.bc.ca/
StatisticsBySubject/BusinessIndustry/
HighTechnology.aspx)
Secondary manufacturing industries
are those that produce goods from
the products of other manufacturers.
For example, a sawmill is a
manufacturing operation, but not
a secondary manufacturer, because
its logs do not come from another
manufacturer. On the other hand,
a factory producing wooden doors
with lumber obtained from sawmills
is a secondary manufacturer.
Which industries show the
fastest rates of growth in
new businesses?
Among the standard industries,
11
the fastest rate of
growth in number of establishments between 2007
and 2011 was seen in businesses involved in public
administration (+57.2 per cent).
Over this period, there
was also an impressive 49.6 per cent increase in small
businesses in the nursing and residential care industry,
which translates to an addition of 417 small businesses
to this sector. This trend will likely continue as the
province’s population continues to age and people
seek alternatives to hospitals for long-term care.
In the specially defined sectors, high technology
continued to grow between 2007 and 2011, with
a 2.1 per cent rise in the number of establishments.
By comparison, the number of tourism firms inched
up 0.3 per cent, while secondary manufacturing
experienced an 8.4 per cent loss in the number of
businesses in that sector.
11
Data for industries with fewer than 100 small businesses are excluded from ranking in the sub-sector growth analysis in order to avoid inflated growth rates for industries with smaller
numbers of businesses (e.g., an increase of one business in an industry with just one business to begin with would equal a 100% rate of growth).
page 22 Small Business Profile | 2012
FIGURE 4.2
SECTOR GROWTH RATES FOR NUMBER OF SMALL
BUSINESSES, BRITISH COLUMBIA, 2007-2011
Source: BC Stats using data supplied by Statistics Canada
Note: Excludes self-employed without paid help
Growth 2007-2011
-10% 0% 10% 20% 30% 40% 50% 60%
Secondary Manufacturing
Tourism
High Technology
Specially Dened Sectors
Other Info. Services
Crop Production
Broadcasting (exc. Internet)
Nursing & Residential Care
Public Administration
FIGURE 4.3
TOP AND BOTTOM FIvE INDUSTRIES IN TERMS OF
PER CENT CHANGE IN SMALL BUSINESS EMPLOYMENT
IN BRITISH COLUMBIA, 2006-2011
Source: BC Stats using data supplied by Statistics Canada
Growth 2006-2011
-20 -15 -10 -5 0 5 10 15 20 25
Arts, Entertainment & Rec.
Transportation & Warehousing
Wholesale & Retail Trade
Manufacturing
Forestry, Logging & Support
Health & Social Assistance
Other Services
Public Administration
Educational Services
Mining, Oil & Gas, Utilities
SMALL BUSINESS
EMPLOYMENT
Which industries are
experiencing the most
job growth?
Between 2006 and 2011, the business services industry
was the largest provider of new jobs in British Columbia.
12
Despite a hefty drop-off in 2009, this industry increased
its employment by 5.8 per cent over the five-year
period and created nearly 5,600 new jobs. A similar
picture was painted in many other industries. Although
long-term advances in employment are evident, nearly
every industry saw job losses between 2008 and 2009
as the effects of the global economic downturn were
felt. However, accommodation and food services, the
second-highest source of jobs over the period, appears
to have been an exception to the trend. Until 2011, jobs
in the hospitality industry had increased every year
since at least the beginning of the decade, with the
biggest jump seen in 2008. This trend came to a halt in
2011, marking the first year in the past decade where
accommodation and food services jobs declined. Despite
this recent decrease, approximately 4,800 jobs (+5.5 per
cent) were created in small businesses in this industry
over the past five years. Health care and social assistance
(7.0 per cent increase, nearly 4,000 jobs) and mining, oil
and gas extraction (a 24.7 per cent surge, over 900 jobs)
were also major players in employment growth from
2006 and 2011. It is possible that the mining sector could
see further strong growth in the next several years if
demand from Asia is sustained. The development of the
Northwest Transmission Line in the province’s Northwest
will potentially create more opportunities in that region
for new mining projects. While most of the activity slated
for the region is currently geared toward large mines, the
new transmission line may also lead to the development
of smaller projects, such as industrial mineral mines
operated by small businesses.
At the other end of the spectrum, job losses between
2006 and 2011 were most heavily concentrated in
forestry, logging and support.
13
Over the five-year period,
forestry and logging saw the number of jobs drop
17.8 per cent. However, 2011 marked the second year
of positive gains for this sector, with an employment
boost of 4.8 per cent, possibly signalling some recovery
in the industry. Despite this recent increase, employment
remains well below levels recorded at the beginning of
the decade.
12
Unlike business counts, there has been no data break for employment data, so it is possible to look at trends over longer periods.
13
Data on employment by size of business are not available for the specially defined sectors.
Small Business Profile | 2012 page 23
Entrepreneurial Success
Saltworks Technologies is a leading
water treatment solutions company
based in Vancouver B.C. that delivers
technology for water purification,
desalination and industrial waste
water treatment.
Saltworks Technologies is the brainchild
of two men – Chief Executive Officer
Ben Sparrow and President Joshua
Zoshi. Sparrow initially invented the
energy-efficient desalination process,
and the two worked together to start
the company, which has now filed over
25 patents, employs 30 people, and has
an international customer base.
“The key to Saltworks’ success to-
date has been building a great team,
listening to customers and continually
innovating,” says Zoshi.
And Saltworks has had a lot of successes
so far, including winning a contract to
deliver a pilot unit to NASA, receiving
a grant worth nearly $1 million from
the B.C. government’s Innovative
Clean Energy Fund and Zoshi and
Sparrow receiving the annual Business
in Vancouver Forty under 40 awards,
which profiles inspiring professionals in
B.C., including innovators, entrepreneurs
and not-for-profit leaders.
Sparrow was also awarded with the
prestigious Queen Elizabeth II Diamond
Jubilee Medal on Aug. 4, 2012. The
medal honours citizens and permanent
residents of Canada who have made a
significant contribution to their fellow
countrymen, their community, or to
Canada over the previous 60 years.
Zoshi and Sparrow expect Saltworks
Technologies to continue to grow and
evolve; saying that if you are willing to
think outside the box and put in plenty
of hard work, anything is possible.
“The next couple of years are all about
scaling up and delivering our energy-
efficient units to the market for treating
industrial waste water,” says Zoshi.
“Looking to the future, we would like to
increase our involvement in developing
countries. We are really just getting
started.”
“The key to Saltworks’ success to-date has been building
a great team, listening to customers and continually
innovating.”
Saltworks Technologies Inc.
Richmond, British Columbia
For more information, visit www.saltworkstech.com