Out of the Ordinary - Finding Hidden Threats by Analyzing Unusual Behavior pptx
Bạn đang xem bản rút gọn của tài liệu. Xem và tải ngay bản đầy đủ của tài liệu tại đây (600.53 KB, 187 trang )
This PDF document was made available
from
www.rand.org as a public service of
the RAND Corporation.
6
Jump down to document
Visit RAND at www.rand.org
Explore RAND-Initiated Research
View document details
This document and trademark(s) contained herein are protected by law
as indicated in a notice appearing later in this work. This electronic
representation of RAND intellectual property is provided for non-
commercial use only. Permission is required from RAND to reproduce, or
reuse in another form, any of our research documents.
Limited Electronic Distribution Rights
For More Information
CHILD POLICY
CIVIL JUSTICE
EDUCATIO
N
ENERGY AND ENVIRONMENT
HEALTH AND HEALTH CAR
E
INTERNATIONAL AFFAIR
S
NATIONAL SECURIT
Y
POPULATION AND AGIN
G
PUBLIC SAFETY
SCIENCE AND TECHNOLOGY
SUBSTANCE ABUSE
TERRORISM AND
HOMELAND SECURITY
TRANSPORTATION AND
INFRASTRUCTURE
The RAND Corporation is a nonprofit
research organization providing
objective analysis and effective
solutions that address the challenges
facing the public and private sectors
around the world.
RAND-INITIATED RESEARCH
Purchase this document
Browse Books & Publications
Make a charitable contribution
Support RAND
This product is part of the RAND Corporation monograph series.
RAND monographs present major research findings that address the
challenges facing the public and private sectors. All RAND mono
-
graphs undergo rigorous peer review to ensure high standards for
research quality and objectivity.
Approved for public release, distribution unlimited
JOHN HOLLYWOOD, DIANE SNYDER,
KENNETH M
cKAY, JOHN BOON
Out of the Ordinary
Finding Hidden Threats by
Analyzing Unusual Behavior
The RAND Corporation is a nonprofit research organization providing
objective analysis and effective solutions that address the challenges
facing the public and private sectors around the world. RAND’s
publications do not necessarily reflect the opinions of its research clients
and sponsors.
R
®
is a registered trademark.
© Copyright 2004 RAND Corporation
All rights reserved. No part of this book may be reproduced in any form
by any electronic or mechanical means (including photocopying,
recording, or information storage and retrieval) without permission in
writing from RAND.
Published 2004 by the RAND Corporation
1700 Main Street, P.O. Box 2138, Santa Monica, CA 90407-2138
1200 South Hayes Street, Arlington, VA 22202-5050
201 North Craig Street, Suite 202, Pittsburgh, PA 15213-1516
RAND URL: />To order RAND documents or to obtain additional information, contact
Distribution Services: Telephone: (310) 451-7002;
Fax: (310) 451-6915; Email:
This research in the public interest was supported by RAND, using
discretionary funds made possible by the generosity of RAND's donors,
the fees earned on client-funded research, and independent research and
development (IR&D) funds provided by the Department of Defense.
Library of Congress Cataloging-in-Publication Data
Out of the ordinary : finding hidden threats by analyzing unusual behavior /
John Hollywood [et al.].
p. cm.
“MG-126.”
Includes bibliographical references.
ISBN 0-8330-3520-7 (pbk. : alk. paper)
1. Criminal behavior, Prediction of—United States. 2. Crime forecasting—
United States. 3. Criminal methods—United States. 4. Terrorism—Forecasting. 5.
Terrorism—Psychological aspects. 6. Intelligence service—United States. 7.
National security—United States. I. Hollywood, John S., 1973– II. Rand
Corporation.
HV6080.O97 2004
363.32—dc22
2003023703
Cover photograph by Kenneth N. McKay. The photograph is of the "Warabe-
Jizo" statue in the Yusei-in Garden of the Sanzen-in Temple in Ohara, Japan.
The statue is of a child bodhisattva-kshitigarbha. He is a figure from both the
Hindu and Buddhist religions. Derived from the Mother Earth, he appeared in
the world to help people.
iii
Preface
This monograph presents a unique approach to “connecting the dots”
in intelligence—selecting and assembling disparate pieces of informa-
tion to produce a general understanding of a threat. Modeled after
key thought processes used by successful and proactive problem
solvers to identify potential threats, the schema described in this
document identifies out-of-the-ordinary, atypical behavior that is po-
tentially related to terror activity; seeks to understand the behavior by
putting it into context; generates and tests hypotheses about what the
atypical behavior might mean; and prioritizes the results, focusing
analysts’ attention on the most significant atypical findings. In addi-
tion to discussing the schema, this document describes a supporting
conceptual architecture that dynamically tailors the analysis in re-
sponse to discoveries about the observed behavior and presents spe-
cific techniques for identifying and analyzing out-of-the-ordinary in-
formation.
We believe the monograph would be of greatest interest to peo-
ple in the homeland security community who are interested in con-
necting the dots across disparate analysis groups and databases to
detect and prevent terror attacks. However, it should also interest
anyone who needs to monitor large and disparate data streams look-
ing for uncertain and unclear indicators that, taken together, repre-
sent potential risks. Thus, we can see the schema and architecture
described in this paper having an application in computing security
(which involves recognizing indicators of an impending cyber attack)
iv Out of the Ordinary
or in public health (which involves recognizing indicators of an im-
pending disease outbreak), for example.
This monograph results from the RAND Corporation’s con-
tinuing program of self-sponsored independent research. Support for
such research is provided, in part, by donors and by the independent
research and development provisions of RAND’s contracts for the
operation of its U.S. Department of Defense federally funded re-
search and development centers. This research was overseen by the
RAND National Security Research Division (NSRD). NSRD con-
ducts research and analysis for the Office of the Secretary of Defense,
the Joint Staff, the Unified Commands, the defense agencies, the De-
partment of the Navy, the U.S. intelligence community, allied for-
eign governments, and foundations.
v
The RAND Corporation Quality Assurance Process
Peer review is an integral part of all RAND research projects.
Prior to publication, this document, as with all documents in the
RAND monograph series, was subject to a quality assurance process
to ensure that the research meets several standards, including the fol-
lowing: The problem is well formulated; the research approach is well
designed and well executed; the data and assumptions are sound; the
findings are useful and advance knowledge; the implications and rec-
ommendations follow logically from the findings and are explained
thoroughly; the documentation is accurate, understandable, cogent,
and temperate in tone; the research demonstrates understanding of
related previous studies; and the research is relevant, objective, inde-
pendent, and balanced. Peer review is conducted by research profes-
sionals who were not members of the project team.
RAND routinely reviews and refines its quality assurance proc-
ess and also conducts periodic external and internal reviews of the
quality of its body of work. For additional details regarding the
RAND quality assurance process, visit />standards/.
vii
Contents
Preface iii
The RAND Corporation Quality Assurance Process v
Figures xi
Tables xiii
Summary xv
Acknowledgments xxvii
Acronyms xxix
CHAPTER ONE
Introduction 1
Prologue: Something Bad Happened on November 9th 1
The Problem of Connecting the Dots in Intelligence 3
Cognitive Processes for Connecting the Dots 6
A Solution for Connecting the Dots—The Atypical Signal Analysis
and Processing Schema 12
Key Attributes of ASAP 16
Near-Term Implementation of ASAP 18
An Evolutionary Path for ASAP 23
Summary of the Schema 23
Outline of the Monograph 24
CHAPTER TWO
Data Analyzed in the ASAP Schema 27
Types of Data 27
Sources of Data 29
viii Out of the Ordinary
Intelligence Networks 29
Information Reported as Out of the Ordinary 30
Information on Critical Industries 30
Open-Source Information 31
Commercial Databases 32
Partitioning Intelligence and Domestic Investigative Data 32
CHAPTER THREE
The Atypical Signal Analysis and Processing Architecture 35
The Scope of an ASAP System 35
Levels of Analysis in the ASAP Architecture 37
Major Functional Components Within the Architecture 39
Data Interception, Storage, and Distribution 39
Finding Dots 40
Linking Dots 43
Generating and Testing Hypotheses 44
Control of the ASAP Architecture 48
Principles and Structures of Control 48
Control at the Operations Level 53
Control at the Tactical Level 57
Learning and Adaptation 58
Roles of Human Analysts and Automated Agents 62
CHAPTER FOUR
Finding the Dots 65
Finding Dots with Rules 65
Representing Context 67
Dimensions of Context 68
Times, Events, and Behavioral Life Cycles 68
Structures of Tactical Behavior 69
Structures of Strategic and Organizational Behavior 71
Structures of the Status Quo 71
Structures That Disrupt: Dot Noise and Intentional Denial and
Deception 72
High-Dimensionality Detection Agents 75
Contents ix
CHAPTER FIVE
Connecting the Dots 77
Similarity Connections 77
Complementary Connections 80
CHAPTER SIX
Understanding the Dots: Generating and Testing Hypotheses 83
Generating Hypotheses 83
A First Pattern-Characterizing Dimension: Indicative and
Non-Indicative Patterns 85
A Second Pattern-Characterizing Dimension: Tests on Data,
Metadata, and Reports 88
Representation of Patterns 92
High-Dimensionality Pattern Analysis 93
Testing Hypotheses 94
CHAPTER SEVEN
Conclusion 97
Summary 97
A Research Plan 98
Conclusion: Recommendations for Action 100
APPENDIX
A. Case Study: “The November 9th Incident” 103
B. Systems Related to the ASAP Architecture 139
Bibliography 151
xi
Figures
S.1. The Atypical Signal Analysis and Processing (ASAP)
Schema xviii
1.1. How Proactive Problem Solvers Connect the Dots 9
1.2. The Atypical Signal Analysis and Processing Schema 13
2.1. Watched Entities and Intercepted Information 28
3.1. Intercepting Data 40
3.2. Data Sorting, Distribution, and Storage 41
3.3. Two Approaches to Detecting Dots 43
3.4. Finding Data Related to Dots 45
3.5. Using Dots to Generate a Hypothesis 47
3.6. Diagram of an End-to-End, Generic ASAP Process 49
3.7. Operational Control in the ASAP Schema 53
3.8. Tactical Control in the ASAP Schema 58
4.1. Identification and Initial Processing of the Dots 66
4.2. Levels of Activity During the Life Cycle of a Terror Attack 69
5.1. Finding Relationships Between the Dots 78
5.2. An Example Similarity Relationship 78
5.3. An Example Complementary Relationship 80
6.1. Generating and Testing Hypotheses About the Dots 84
6.2. An Indicative Pattern and a Corresponding Instance 86
6.3. A Non-Indicative Pattern and a Corresponding Instance 87
6.4. An Instance of Two Agencies Analyzing the Same Data 90
6.5. An Instance of an Agency Making Out-of-the-Ordinary
Data Requests 91
6.6. Validating a Hypothesis 96
xiii
Tables
S.1. The ASAP Schema xxiv
1.1. The ASAP Schema 24
3.1. Example Performance Metrics for an ASAP System 50
4.1. Contextual Rules Corresponding to Activity Life-Cycle
Phases 70
xv
Summary
The problem of “connecting the dots” in intelligence—selecting and
assembling disparate pieces of information to produce a general un-
derstanding of a threat—has been given great priority since the Sep-
tember 11, 2001, terrorist attacks.
1
This monograph summarizes a
RAND internal research and development project on developing
unique approaches to assist in connecting the dots.
Synthesizing disparate pieces of information to understand
threats is an extremely difficult challenge. The analysis process re-
quires searching through enormous volumes of data, and analysts’
attention must be directed to the most important findings. There are,
however, few direct clues as to which data are important and how to
link the data together. The most obvious approach to prioritizing
data—looking for patterns similar to those of previous attacks—can
easily lead to missing the signals indicating the next, different attack.
When analyzing uncertain and messy (i.e., real-world) data, time and
situational pressures often force the analyst into making conclusions,
despite great uncertainty as to whether the conclusions are true. Ex-
1
As one example of the high priority placed on this topic, the Congressional Joint Inquiry
into September 11 writes, in its “Conclusion—Factual Findings” section: “No one will ever
know what might have happened had more connections been drawn between these disparate
pieces of information. We will never definitively know to what extent the Community would
have been able and willing to exploit fully all the opportunities that may have emerged. The
important point is that the Intelligence Community, for a variety of reasons, did not bring
together and fully appreciate a range of information that could have greatly enhanced its
chances of uncovering and preventing Usama Bin Laden’s plan to attack these United States
on September 11th, 2001.”
xvi Out of the Ordinary
isting legal, technological, procedural, and cultural barriers to sharing
and linking information further complicate these challenges.
A Schema for Connecting the Dots
Historically, however, many people have surmounted the barriers to
connecting the dots, albeit with significantly smaller amounts of data
than the homeland security community faces. These successful prob-
lem solvers have tended to follow similar cognitive processes. First,
the problem solver establishes expectations for what the environment
will be like if everything is “normal”—in effect, defining a status quo.
This formulation is employed because it is often impossible to predict
everything that is abnormal; instead, it is much easier to describe the
status quo as the starting point and add to this description what is
known about how the status quo might change. The problem solver
next identifies a set of metrics (both quantitative and qualitative) with
which to observe the environment, especially in regard to whether the
actual environment is consistent with expectations. Third, the prob-
lem solver observes streams of measurement data about the environ-
ment. Generally, the solver does not examine every observation care-
fully but instead scans for out-of-the-ordinary or atypical signals that
significantly deviate from the expected status quo. These signals range
from defined precursors of a well-understood change in the environ-
ment to an entirely novel phenomenon whose meaning is un-
known—except that it is in some way relevant to the task at hand.
2
All, however, deserve additional analysis: Because they are outside of
expectations for what the current environment should exhibit, they
2
It is important to reiterate that the problem solver does not try to examine all atypical be-
havior in the environment; doing so would lead to data overload. Instead, the solver pays
attention to relevant behavior that can quickly be related to the task at hand. For example,
suppose the problem solver is responsible for identifying potential threats to a theme park.
Clearly, many attendees in the theme park will engage in “unusual” behavior. The problem
solver, however, will be interested strictly in behavior that can quickly be declared potentially
relevant to attacks on the theme park, such as a group of guests on a terror watch list, or a
group of guests who engage in behavior that strikes the park’s security guards as threatening
(casing behavior, clandestine communications, etc.).
Summary xvii
may signal an impending change in the environment. Upon discov-
ering out-of-the-ordinary behavior, the solver looks for supporting
data marking the observed signals as a true phenomenon and not just
noise. Should such supporting data be discovered, the problem solver
searches for related information that helps explain the phenomenon
and then develops and tests hypotheses as to what the phenomenon
means. Finally, once the phenomenon is understood, and identified
as indicating a risk, the problem solver uses heuristics to avoid or
mitigate the risk. It should be noted that the process the problem
solver uses is not linear—the solver separates the noise from the truly
significant through an iterative, multistage process of testing and
learning, with the steps used being dependent on what the solver
learns about the phenomenon at each stage (i.e., context-dependent
analysis).
We have developed the Atypical Signal Analysis and Processing
(ASAP) schema to assist in connecting the dots by mirroring the
problem-solving process described above. An implementation of the
schema will serve as an analyst’s “virtual extension,” applying the
problem-solving process to the volumes of data and numbers of di-
mensions within the data that are far too large for analysts to work
with directly. Figure S.1 shows the schema.
The shortest, linear path through the schema has six major steps.
The schema begins with the gathering of information from a set of
external databases. Most of the information pertains to watched enti-
ties—people, places, things, and financial activities already suspected
as being relevant to a terror attack or activities within key infrastruc-
ture and commercial processes already being monitored, such as in-
ternational commerce, nuclear energy, hazardous materials, and air
transportation. Intelligence and government databases would be used,
supplemented by open-source data, all in accordance with privacy
regulations. This baseline information would be further supple-
mented by precedent-setting phenomena—data, voluntarily submitted,
that describes behavior the reporters find to be highly out of the or-
dinary and suspicious with respect to asymmetric threats. (For ex-
xviii Out of the Ordinary
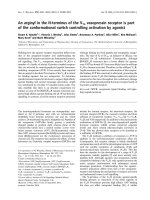
Figure S.1
The Atypical Signal Analysis and Processing (ASAP) Schema
External
networks
ASAP
network
Tactical network
control
Information
pool gets
data, sends
filter changes
Respond to findings and requests
(direct tasks and changes to analysis parameters)
Analysts
review
Information pool sends data,
receives initial and follow-up queries
Processor sends instructions, receives test results
Feedback (to all parts of network)
Processor sends
prioritized
results, receives
analysts‘
requests
Analysis
results
and
analysts‘
requests
Observational data
Analysis histories
Information
pool
$
Gather
information
Process results
Find dots
(unusual
data/
datasets)
Link dots
and data
Generate
and test
hypotheses
Information
on watched
entities
RANDMG126-S.1
ample, prior to the 9/11 attacks, FBI officials might have sub-
mitted their suspicions about certain flight school students.) The
schema incorporates both direct observations of the watched entities
and metadata on who is working with those observations and why.
The resulting information goes into a structured information pool.
Second, within the pool, a number of automated detection
agents perpetually filter the information to look for out-of-the-
ordinary signals.
3
These signals might be single observations (e.g., a
3
Note that an ASAP network would not detect and process all atypical signals; instead, it
would process atypical signals that can be quickly classified as being potentially relevant to an
attack or the operations of a terrorist organization. For the former, a network would seek
atypical signals potentially related to attack preparations such as target casing, training, clan-
destine communications, supply (smuggling), and weapons acquisition. For example, from a
theme park, the network would be interested in hearing reports of people videotaping secu-
Summary xix
very large financial transfer) or a significant trend (e.g., a 75 percent
increase in fund transfers during the past month). The signals might
also be a group studying information they do not normally review
(e.g., an FBI field office requesting records of students at truck driv-
ing schools funded by the aforementioned increase in funding trans-
fers). Such signals become the “dots.” Note that ASAP will support
detection filters ranging in sophistication from simple rules evaluating
a few data fields (usually generated by human analysts) to compli-
cated algorithms evaluating tens of simultaneous data fields simulta-
neously (usually generated by hybrid human-machine statistical
training techniques, such as neural networks).
Third, once the dots have been identified, the next step is to
find information related to the dots. The schema thus employs auto-
mated relationship agents to look for relationships between new and
existing dots. It also uses agents to perform backsweeping—searching
for previously unremarkable data that relate to the dots. These related
data would come primarily from the information pool but also from
queries in external (intelligence) databases and, in cases constituting
probable cause, from commercial databases (for example, examining
the credit transactions of a positively identified terror suspect).
4
The
information discovered helps determine the extent of an out-of-the-
ordinary phenomenon and provides a context to help explain it.
Fourth, once the dots have been linked, hypothesis agents can
be tasked to create possible interpretations for the linked dots and to
create corresponding testing plans to determine whether the hypothe-
ses are correct. The principal purpose of these agents is to assess
which phenomena should be given priority for further investigation.
rity checkpoints and support beams of major attractions; it would not be interested in hear-
ing reports on generic disorderly conduct. For the latter, a network would seek atypical sig-
nals such as sudden movements, changes in organizational structure, or changes in commu-
nications networks. The issue of what constitutes “out of the ordinary” is discussed at length
in Chapter Two.
4
Backsweeping in probable-cause cases is the only time the ASAP schema would use general
commercial databases. Thus, for example, the schema complies with the proposed Citizens’
Protection in Federal Databases Act, which would prohibit accessing databases “based solely
on a hypothetical scenario or hypothetical supposition of who may commit a crime or pose a
threat to national security.”
xx Out of the Ordinary
Consequently, the “hypotheses” very often do not pertain to a specific
inference but instead simply note that a phenomenon is so unusual
(and perhaps has particularly suspicious characteristics) that it is
worth investigating further. Correspondingly, the testing agents
monitor whether further investigations raise or lower concern about
the phenomenon.
Fifth, the results of these processes are strictly prioritized, and
high-priority results are forwarded to analysts. This prioritization
function is one of the most important of the schema, as it reduces
potentially large volumes of out-of-the ordinary discoveries, so that
analysts can restrict their attention to only the most relevant and sig-
nificant discoveries.
Finally, the schema facilitates the collaboration of analysts
working on related observations. It notifies different analysts that
they are looking at the same pieces of information and provides
communications channels between them. In the ASAP schema, ana-
lysts have primary responsibility for actions to be taken in response to
unusual phenomena that are brought to their attention because they
have insights (knowledge of human behavior, for instance) that
automated systems do not have.
As with human problem solvers, the schema permits iterative,
dynamically tailored analysis in which the actual sequences of testing
activities are dependent on what has been learned to date about the
observed phenomena. To allow for such context-dependent process-
ing, the complete schema is governed by a two-stage control system.
At the lower, operational level, processor agents direct data through
the schema. These agents use sets of control rules to interpret the re-
sults from the detection, relationship, and hypothesis agents, and de-
termine what to do next with a particular dataset (or test results on
the dataset). Thus, for example, a processor agent might direct a
newly detected dot to a relationship agent and forward results from
hypothesis testing to analysts. This structure allows for flows through
ASAP to be both dynamic and iterative. Thus, analysis results guide
what happens next, so that, for example, analyzing one initial signal
leads to the discovery of related phenomena, which are then further
analyzed, leading to yet more contextual information, and so on, po-
Summary xxi
tentially allowing an initially mysterious phenomenon to be illumi-
nated fully. Processor agents are guided both by automated logic and
directions from analysts. Analysts have the ability to request any type
of follow-up test or analysis of the ASAP agents, with the processor
agents executing these requests.
At the second, tactical level, the ASAP is subject to open-loop
control: Analysts may change any of the software agents and agents’
parameters, or make any specific analysis requests, in response to the
analysis results. The tactical level also supports automated control
agents that modify software agents and parameters based on interpre-
tation of finding, relating, and testing dots (these software control
agents are also subject to analysts’ direction).
We have developed an architectural design that applies the
schema; description of the design makes up the bulk of this paper.
The design has several key attributes worth mentioning here.
First, in its initial stages the architecture focuses on information
already suspected of being of interest, as opposed to performing un-
guided data mining of large databases and collecting data about ge-
neric transactions. This focus helps prevent analytic overload. At the
same time, the architecture has the flexibility both to receive reports
of highly atypical behavior from all sources and to cull databases for
particular pieces of information should the need arise (for example,
searching for data about a highly suspicious person’s travel plans).
Second, the architecture searches primarily for signals that are
out of the ordinary as opposed to signals that fit predetermined pat-
terns. This approach loses precision in meaning but gains in being
able to detect a wide range of threatening behavior that does not fit
previously seen attack patterns. Searching for signals deviating from,
rather than matching, existing patterns is uncommon in the pattern-
matching and signal analysis fields.
Third, in finding dots, searching for related information, and
generating hypotheses, the architecture employs contextual rules that
allow data to be analyzed in the context of existing knowledge. Con-
textual rules are not commonly used in information analysis.
Fourth, the architecture explicitly deals with uncertainty by gen-
erating and testing competing hypotheses for unusual signals. This
xxii Out of the Ordinary
approach helps defend against prematurely accepting an explanation
for a phenomenon.
Finally, the architecture enables the collaboration of personnel
needed to connect the dots, even if the personnel are distributed
across different groups and agencies. The architecture looks not just
for out-of-the-ordinary data, but for out-of-the-ordinary analyses of the
data. Flagging these analyses can bring together groups of people and
automated agents who can jointly characterize a previously mysteri-
ous phenomenon.
Near-Term Implementation
Fully implementing the ASAP schema and its supporting architecture
would be a lengthy, multiyear process. However, several improve-
ments could be implemented quickly, in effect allowing personal
analysis interactions to partially substitute for the automated agents
described previously.
A major requirement for detecting out-of-the-ordinary phenom-
ena is to understand what constitutes “ordinary” and what types of
behaviors are significant deviations away from the ordinary that may
be relevant to a counterterrorism investigation. Thus, we recommend
that appropriate users throughout the homeland security (HLS)
community create and distribute standardized profiles of organized
behavior. These profiles would discuss both what threats (terror at-
tacks, terror support activities, etc.) commonly look like and what
status-quo conditions look like in such “watched” fields as interna-
tional commerce, transportation, and demolition. Note that these
brief profiles are in no way intended to be comprehensive; their pur-
pose is merely to help analysts and field professionals in one area edu-
cate analysts and field professionals in other areas—in a more inten-
tional and systematic way than at present—on what types of behavior
to look out for.
The next step would be to establish electronic posting boards
where those in the field can report unusual phenomena and see
whether others have been observing similar or related occur-
Summary xxiii
rences—in effect, helping each other serve as detection and linking
agents. Personnel would post to unmoderated electronic bulletin
boards, and there would be no approval process for phenomena
posted. Trained reviewers would routinely review the boards, select-
ing especially unusual and significant reports to post to filtered boards
that would be widely read by analysts.
The third step would be to develop semiautomated tools to help
HLS personnel identify posts relevant to what they have been ob-
serving. One might first implement organizational tools that divide
the posts into threads dedicated to particular occurrences and create
indices of those threads. Particularly important threads would be as-
sociated with journals or diaries summarizing key developments and
current hypotheses. The next step would to be create Google-like
search engines for posts that match the results of search queries. Fi-
nally, simple heuristics could be developed that look for connections
and patterns across the threads of posted messages.
Summarizing the Schema
Table S.1 summarizes differences between the proposed schema and
traditional methods of intelligence analysis. The table also compares a
near-term, manual implementation of ASAP with a full implementa-
tion.
A Research Plan
At the same time as the short-term improvements are being imple-
mented, research can begin on the automated portions of the ASAP
architecture. This portion will be needed to assist analysts in identi-
fying out-of-the-ordinary signals in the enormous volume of data
generated by intelligence and infrastructure collection and monitor-
ing systems every day.