FOOD SECURITY IN PRACTICE Social Accounting Matrices and Multiplier Analysis pptx
Bạn đang xem bản rút gọn của tài liệu. Xem và tải ngay bản đầy đủ của tài liệu tại đây (3.36 MB, 42 trang )
Social Accounting Matrices and Multiplier Analysis
Clemens Breisinger, Marcelle Thomas, and James Thurlow
FOOD SECURITY IN PRACTICE
An Introduction with Exercises
sustainable solutions for ending hunger and poverty
Supported by the CGIAR
Social Accounting Matrices and Multiplier Analysis
Clemens Breisinger, Marcelle Thomas, and James Thurlow
F O O D S E C U R I T Y I N P R A C T I C E
An Introduction with Exercises
About IFPRI
The International Food Policy Research Institute (IFPRI
®
) was established in 1975 to identify and
analyze alternative national and international strategies and policies for meeting food needs of the
developing world on a sustainable basis, with particular emphasis on low-income countries and on
the poorer groups in those countries. While the research effort is geared to the precise objective of
contributing to the reduction of hunger and malnutrition, the factors involved are many and wide-
ranging, requiring analysis of underlying processes and extending beyond a narrowly defined food
sector. The Institute’s research program reflects worldwide collaboration with governments and
private and public institutions interested in increasing food production and improving the equity of
its distribution. Research results are disseminated to policymakers, opinion formers, administrators,
policy analysts, researchers, and others concerned with national and international food and
agricultural policy.
About IFPRI Food Security in Practice series
The Food Security in Practice technical guide series is designed for development practitioners.
The guides are based on IFPRI research and enable project personnel in the field to take research
from analysis to action. Each volume addresses informational and methodological issues that
practitioners confront during the life of a project and presents the lessons learned from research on
specific development issues. Relevant research and operational concepts are explained in easy-to-
understand ways. Additional information pertaining to research analyses, methodologies, and results
is available from IFPRI.
Social Accounting Matrices and Multiplier Analysis
Clemens Breisinger, Marcelle Thomas, and James Thurlow
F O O D S E C U R I T Y I N P R A C T I C E
An Introduction with Exercises
Updated April 2010
Copyright © 2009 International Food Policy Research Institute. All rights reserved. Sections of
this material may be reproduced for personal and not-for-profit use without the express written
permission of, but with acknowledgment to, IFPRI. To reproduce the material contained herein for
profit or commercial use requires express written permission. To obtain permission, contact the
Communications Division <>.
International Food Policy Research Institute
2033 K Street, N.W.
Washington, D.C. 20006-1002
U.S.A.
Telephone +1-202-862-5600
www.ifpri.org
How to cite this book: Breisinger, C., M. Thomas, and J. Thurlow. 2009. Social accounting matrices
and multiplier analysis: An introduction with exercises. Food Security in Practice technical guide 5.
Washington, D.C.: International Food Policy Research Institute.
DOI: 10.2499/9780896297838fsp5
Library of Congress Cataloging-in-Publication Data
Breisinger, Clemens.
Social accounting matrices and multiplier analysis : an introduction
with exercises / Clemens Breisinger, Marcelle Thomas, and James Thurlow.
p. cm. — (Food security in practice ; no. 5)
Includes bibliographical references.
ISBN 978-0-89629-783-8 (alk. paper)
1. Social accounting Mathematical models. 2. Microsoft Excel
(Computer file) I. Thomas, Marcelle. II. Thurlow, James. III. Title.
HC79.I5B72 2009
330.0285’554—dc22
2009044463
Food Security in Practice v
Acknowledgments . . . . . . . . . . . . . . . . . . . . . . . . . . . . . . . . . . . . . . . . . . . . . . . . . . . . . . . . . . . . . . . . . .iv
Introduction . . . . . . . . . . . . . . . . . . . . . . . . . . . . . . . . . . . . . . . . . . . . . . . . . . . . . . . . . . . . . . . . . . . . . . . v
Exercise 1: Composition of a SAM. . . . . . . . . . . . . . . . . . . . . . . . . . . . . . . . . . . . . . . . . . . . . . . . . . . 1
What is a SAM? . . . . . . . . . . . . . . . . . . . . . . . . . . . . . . . . . . . . . . . . . . . . . . . . . . . . . . . . . . . . . . . . . . . . 1
Task 1: Constructing a macro-SAM for Ghana . . . . . . . . . . . . . . . . . . . . . . . . . . . . . . . . . . . . . . . . . . . 3
Discussion of Task 1 . . . . . . . . . . . . . . . . . . . . . . . . . . . . . . . . . . . . . . . . . . . . . . . . . . . . . . . . . . . . . . . . 4
Exercise 2: Analysis of a SAM. . . . . . . . . . . . . . . . . . . . . . . . . . . . . . . . . . . . . . . . . . . . . . . . . . . . . . . 7
Detailed discussion of the macro-SAM. . . . . . . . . . . . . . . . . . . . . . . . . . . . . . . . . . . . . . . . . . . . . . . . . . 7
Task 2: Interpreting the Ghana micro-SAM. . . . . . . . . . . . . . . . . . . . . . . . . . . . . . . . . . . . . . . . . . . . . . 9
Discussion of Task 2 . . . . . . . . . . . . . . . . . . . . . . . . . . . . . . . . . . . . . . . . . . . . . . . . . . . . . . . . . . . . . . . . 9
Exercise 3: Economic Linkages and Multiplier Effects . . . . . . . . . . . . . . . . . . . . . . . . . . . . . 13
What are economic linkages and multiplier effects?. . . . . . . . . . . . . . . . . . . . . . . . . . . . . . . . . . . . . . 13
Task 3: Calculating round-by-round linkage effects . . . . . . . . . . . . . . . . . . . . . . . . . . . . . . . . . . . . . . 15
Discussion of Task 3 . . . . . . . . . . . . . . . . . . . . . . . . . . . . . . . . . . . . . . . . . . . . . . . . . . . . . . . . . . . . . . . 15
Exercise 4: Unconstrained SAM Multiplier Analysis . . . . . . . . . . . . . . . . . . . . . . . . . . . . . . . . 17
Deriving the unconstrained multiplier formula . . . . . . . . . . . . . . . . . . . . . . . . . . . . . . . . . . . . . . . . . 17
Task 4: Constructing an unconstrained multiplier model . . . . . . . . . . . . . . . . . . . . . . . . . . . . . . . . . 20
Discussion of Task 4 . . . . . . . . . . . . . . . . . . . . . . . . . . . . . . . . . . . . . . . . . . . . . . . . . . . . . . . . . . . . . . . 20
Exercise 5: Constrained SAM Multiplier Analysis . . . . . . . . . . . . . . . . . . . . . . . . . . . . . . . . . . 23
Deriving the constrained multiplier formula . . . . . . . . . . . . . . . . . . . . . . . . . . . . . . . . . . . . . . . . . . . 23
Task 5: Interpreting results from a constrained multiplier model . . . . . . . . . . . . . . . . . . . . . . . . . . . 24
Discussion of Task 5 . . . . . . . . . . . . . . . . . . . . . . . . . . . . . . . . . . . . . . . . . . . . . . . . . . . . . . . . . . . . . . . 25
References . . . . . . . . . . . . . . . . . . . . . . . . . . . . . . . . . . . . . . . . . . . . . . . . . . . . . . . . . . . . . . . . . . . . . . . . 27
Appendix 1: Equation System for Unconstrained SAM Multiplier. . . . . . . . . . . . . . . . . . . . 28
Appendix 2: Equation System for Constrained SAM Multiplier . . . . . . . . . . . . . . . . . . . . . . 30
Contents
vi Social Accounting Matrices and Multiplier Analysis
Acknowledgments
T
his introductory guide to social accounting matrices and multiplier analysis was originally
prepared for a series of workshops held in Ghana. We are grateful to the course participants
for helping us refine the materials. In particular we thank Prof. Nsowah-Nuamah,
Magnus Duncan, and Shashi Kolavalli for facilitating the workshops. Some of the teaching slides
accompanying this guidebook were adapted from course materials produced and generously shared
by Rob Davies and Dirk van Seventer. We also thank Suresh Babu, Xinshen Diao, Steve Haggblade,
Sam Morley, and two anonymous reviewers for their comments and suggestions. Finally, we thank
the United States Agency for International Development (USAID) and the German Agency for
Technical Cooperation (GTZ) for funding the Ghana courses and the development of this guidebook.
Financial Contributors and Partners
IFPRI’s research and capacity-strengthening and communications activities are made possible by its
financial contributors and partners. IFPRI receives its principal funding from governments, private
foundations, and international and regional organizations, most of which are members of the
Consultative Group on International Agricultural Research (CGIAR). IFPRI gratefully acknowledges
the generous unrestricted funding from Australia, Canada, China, Denmark, Finland, France,
Germany, India, Ireland, Italy, Japan, the Netherlands, Norway, South Africa, Sweden, Switzerland, the
United Kingdom, the United States, and the World Bank.
Food Security in Practice vii
T
his training guide introduces development practitioners, policy analysts, and students to social accounting matrices (SAMs)
and their use in policy analysis. There are already a number of books that explain the System of National Accounts and
SAM multipliers—some of these are recommended at the end of this training guide. However, most books tend to be
quite technical and move quickly from an introduction to more complex applications. By contrast, this guidebook uses a series
of hands-on exercises to gradually introduce SAMs and multiplier analysis. It therefore complements more theoretical SAM and
multiplier literature and provides a first step for development practitioners and students wishing to understand the strengths and
limitations of these economic tools. It is also useful for policy analysts and researchers embarking on more complex SAM-based
methodologies. One such methodology is computable general equilibrium (CGE) modeling, for which IFPRI has also developed a
series of introductory exercises and a standard modeling framework.
1
The course is designed around five Microsoft Excel-based exercises. Each exercise begins with a background discussion, an
outline of the task, and hints to help get you started. Each task and its solution can be downloaded from the IFPRI website (http://
www.ifpri.org/publication/social-accounting-matrices-and-multiplier-analysis).
After finishing each task, you can check your
answers by looking at the completed worksheets in the “Solution” files. You should also return to the guidebook, where we often
discuss the results. Although all exercises are based on the Ghanaian economy in 2007, the materials can be adapted to other
countries and years.
The course materials are designed for trainers and for self-learning and will be useful for both newcomers to the topic as well
as people who wish to refresh their knowledge of SAMs and multiplier analysis. The exercises gradually introduce the concepts and
skills that you would need to conduct your own multiplier analysis:
Exercise 1 explains the basic structure of a SAM and outlines the data required to build this database. In Task 1 you will
construct an aggregate “macro” SAM for Ghana using data from the national accounts, government budget, and
balance of payments. At the end of this task, you should be familiar with the structure of a SAM and how to use
various national economic data to assemble a macro-SAM.
Exercise 2 describes the various cells of a more disaggregated SAM. In Task 2, you will use the Ghana SAM to calculate key
macro- and microeconomic indicators. At the end of this task, you should be able to interpret a SAM and understand
the broad economic structure of an economy.
Exercise 3 introduces the concepts of “economic linkages” and “multiplier effects.” In Task 3, you will use the coefficients in
the Ghana SAM to calculate the round-by-round multiplier effects of increasing agricultural production. At the end
of this task, you should be familiar with economic linkages and how they lead to indirect effects and multiplier
processes.
Exercise 4 derives a mathematical formula for calculating multiplier effects. In Task 4, you will construct a simple or
“unconstrained” multiplier model in Excel using the Ghana SAM. At the end of this task, you should know how to
program the multiplier formula into Excel and interpret the results from a multiplier model.
Exercise 5 extends the simple multiplier model from the previous exercise by dropping the assumption that sectors are
unconstrained in their ability to increase output when demand rises. In Task 5, you will interpret the results of a
pre-programmed “constrained” multiplier model, where the output of some sectors is fixed (a “semi-input-output”
model). At the end of this task, you should understand the importance of supply constraints and how to run and
interpret simulations using this more complicated model.
The folder containing the exercises and their solutions also includes a Microsoft PowerPoint presentation covering some of the back-
ground materials used in the five exercises. In addition, the folder contains Handouts 1 and 2, which, like the two appendixes in this
guide, summarize the derivation of the multiplier formulas used in Exercises 4 and 5.
Introduction
1
See Microcomputers in Policy Research Series 4 (
www.ifpri.org/pubs/microcom/micro4.htm
) and Series 5 (
/>).
Food Security in Practice 1
What is a saM?
O
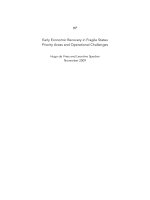
ne way of depicting the economy is the circular flow
diagram shown in Figure 1, which captures all transfers
and real transactions between sectors and institutions.
Productive activities purchase land, labor, and capital inputs
from the factor markets, and intermediate inputs from commod-
ity markets, and use these to produce goods and services. These
are supplemented by imports (M) and then sold through com-
modity markets to households (C), the government (G), inves-
tors (I), and foreigners (E). In the circular flow diagram, each
institution’s expenditure becomes another institution’s income.
For example, household and government purchases of commod-
ities provide the incomes producers need to continue the produc-
tion process. Additional inter-institutional transfers, such as taxes
and savings, ensure that the circular flow of incomes is closed.
In other words, all income and expenditure flows are accounted
for, and there are no leakages from the system.
A SAM is also a representation of the economy. More specifi-
cally, it is an accounting framework that assigns numbers to the
incomes and expenditures in the circular flow diagram. A SAM
is laid out as a square matrix in which each row and column is
called an “account.” Table 1 shows the SAM that corresponds to
the circular flow diagram in Figure 1. Each of the boxes in the
diagram is an account in the SAM. Each cell in the matrix repre-
sents, by convention, a flow of funds from a column account
to a row account. For example, the circular flow diagram
shows private consumption spending as a flow of funds from
households to commodity markets. In the SAM, it is entered in
the household column and commodity row. The underlying
principle of double-entry accounting requires that, for each
account in the SAM, total revenue equals total expenditure. This
means that an account’s row and column totals must be equal.
Figure 1. Circular ow diagram of the economy
Factor
markets
Commodity
markets
Government
Rest of world
Households
Investment
Recurrent
spending (G)
spending (C)
Exports (E)
Imports (M)
Investment
demand (I)
Direct taxes
Fiscal surplus
Social transfers
Intermediate
demand
Factor earnings
(value-added)
Sales income
Foreign grants
and loans
Indirect taxes
2 Social Accounting Matrices and Multiplier Analysis
Activities and commodities
The SAM distinguishes between “activities” and ”commodi-
ties.” Activities are the entities that produce goods and services,
and commodities are those goods and services produced by
activities. They are separated because sometimes an activity
produces more than one kind of commodity (by-products).
Similarly, commodities can be produced by more than one
kind of activity: for example, maize can be produced by small-
or large-scale farmers. The values in the activity accounts are
usually measured in producer prices (that is, farm or factory
gate prices).
Activities produce goods and services by combining the
factors of production with intermediate inputs. This is shown in
the activity column of the SAM, where activities pay factors the
wages, rents, and profits they generate during the production
process (that is, value-added). This is a payment from activities
to factors, and so the value-added entry in the SAM appears
in the activity column and the factor row [R3-C1]. Similarly,
intermediate demand is a payment from activities to commodi-
ties [R2-C1]. Adding together value-added and intermediate
demand gives gross output. The information on production
technologies contained in the activity column is the input part
of a typical “input–output table,” or factor and intermediate
inputs per unit of output.
Commodities are either supplied domestically [R1-C2]
or imported [R7-C2]. Indirect sales taxes and import tariffs
are paid on these commodities [R5-C2]. This means that the
values in the commodity accounts are measured at market
prices. A number of economic entities purchase commodi-
ties. As discussed, activities buy commodities to be used as
intermediate inputs for production [R2-C1]. Final demand
for commodities consists of household consumption spending
[R2-C4], government consumption, or recurrent expenditure
[R2-C5], gross capital formation or investment [R2-C6], and
export demand [R2-C7]. All of these sources of demand make
up the commodity row (payments by different entities for
commodities). On their own, the commodity row and column
accounts are sometimes referred to as a “Supply–Use Table,”
or the total supply of commodities and their different kinds of
uses or demands.
Table 1. Basic structure of a SAM
Expenditure columns
Income rows
Activities
C1
Commodities
C2
Factors
C3
Households
C4
Government
C5
Savings and
investment
C6
Rest of
world
C7 Total
Activities
R1
Domestic
supply
Activity
income
Commodities
R2
Intermediate
demand
Consumption
spending (C)
Recurrent
spending (G)
Investment
demand (I)
Export
earnings (E)
Total demand
Factors
R3
Value-added Total factor
income
Households
R4
Factor
payments to
households
Social
transfers
Foreign
remittances
Total
household
income
Government
R5
Sales taxes
and import
tariffs
Direct
taxes
Foreign
grants and
loans
Government
income
Savings and
investment
R6
Private
savings
Fiscal
surplus
Current
account
balance
Total
savings
Rest of world
R7
Import
payments
(M)
Foreign
exchange
outflow
Total
Gross output Total supply Total factor
spending
Total
household
spending
Government
expenditure
Total
investment
spending
Foreign
exchange
inflow
Food Security in Practice 3
The SAM in Table 1 shows only single activity and
commodity rows and columns. However, a SAM generally
contains a number of different activities and commodities. For
example, activities may be divided into agriculture, industry,
and services. The information needed to construct these
detailed activity and commodity accounts is usually found
in a country’s national accounts, input–output table and/or
supply–use table.
2
All of these data are usually published by a
country’s statistical bureau.
Domestic institutions
A SAM is different from an input–output matrix because it
not only traces the income and expenditure flows of activities
and commodities, but it also contains complete information
on different institutional accounts, such as households and
the government. Households are usually the ultimate owners
of the factors of production, and so they receive the incomes
earned by factors during the production process [R4-C3].
3
They
also receive transfer payments from the government [R4-C5]
(for example, social security and pensions) and from the
rest of the world [R4-C7] (such as remittances received from
family members working abroad). Households then pay taxes
directly to the government [R5-C4] and purchase commodities
[R2-C4]. The remaining income is then saved (or dis-saved
if expenditures exceed incomes) [R6-C4].
4
Information in
household accounts is usually drawn from national accounts
and household surveys from the country’s statistics bureau.
The government receives transfer payments from the rest
of the world [R5-C7] (such as foreign grants and development
assistance). This is added to all of the different tax incomes to
determine total government revenues. The government uses
these revenues to pay for recurrent consumption spending
[R2-C5] and transfers to households [R4-C5]. The differ-
ence between total revenues and expenditures is the fiscal
surplus (or deficit, if expenditures exceed revenues) [R6-C5].
Information on the government accounts is normally drawn
from public-sector budgets published by a country’s ministry of
finance.
Savings, investment, and the
foreign account
According to the ex post accounting identity, investment or
gross capital formation, which includes changes in stocks or
inventories, must equal total savings. So far we have accounted
for private savings [R6-C4] and public savings [R6-C5]. The
difference between total domestic savings and total investment
demand is total capital inflows from abroad, or what is called the
current account balance [R6-C7]. This is also equal to the differ-
ence between foreign exchange receipts (exports and foreign
transfers received) and expenditures (imports and government
transfers to foreigners). Information on the current account (or
rest of world) is drawn from the balance of payments, which is
usually published by a country’s central bank.
Balancing a SAM
The information needed to build a SAM comes from a variety of
sources, such as national accounts, household surveys, govern-
ment budgets, and the balance of payments. Placing these data
within the SAM framework almost always reveals inconsisten-
cies between the incomes and expenditures of each account.
For example, government spending in national accounts may
not be the same as what is reported in the government budget.
A number of statistical estimation techniques exist to balance
SAM accounts or reconcile incomes and expenditures. Cross-
entropy estimation is generally the preferred method. More
information on this approach can be found in various IFPRI
discussion papers.
5
TASK 1
ConstruCting a MaCro-saM
for ghana
In Task 1, you will build an aggregate macro-SAM using
data from Ghana for the year 2007. You should construct the
Ghana SAM on the worksheet “Task 1: Construct the Ghana
macro-SAM” in the Excel file “Task 1 Worksheet.xls.” The four
datasets that you will need to complete the SAM are on the
following worksheets:
• National accounts (GDP at factor cost)
• National accounts (GDP at market prices)
• Government budget
• Balance of payments
The datasets have already been balanced so there are no
inconsistencies between incomes and expenditures. Using the
SAM structure shown in Table 1, enter the data from the four
datasets into the cells of the macro-SAM in order to produce a
balanced 2007 SAM for Ghana.
Hints and tips
1. The Ghana macro-SAM is slightly more disaggregated than
the one shown in Table 1—it splits the factor account into
labor and capital.
2. It is usually easiest if you enter the accounts from left to
right. In other words, you should first balance the activity
account, and then move onto the commodity account.
Proceed across the accounts until you reach the final “rest
of the world” account.
4 Social Accounting Matrices and Multiplier Analysis
3. Do not just type the actual numbers from the datasets into
the macro-SAM. Rather, it is better practice to link the
macro-SAM entries to the respective datasets. You do this
by typing “=” followed by the cell reference where the data
are stored. Linking the macro-SAM to the four datasets will
allow you to trace back the source of each cell entry.
4. The row and column totals are automatically calculated
for you as you fill in the cells. The macro-SAM worksheet
also calculates the difference between row and column
totals, which should help you identify missing entries as you
construct the SAM.
5. The four datasets contain all of the information you need
to complete the macro-SAM. However, not all data provided
in the datasets are relevant. Below are some tips on the
kinds of data you will find on each worksheet and how to
calculate some of the more complicated cell entries in the
macro-SAM.
National accounts (GDP at factor cost)
a. You will need to use the capital–labor value-added
shares to split GDP at factor cost into its labor and
capital components.
b. To calculate intermediate demand, you will need to use
the intermediate input to value-added ratio.
c. Household factor income is the total return to labor
and capital.
d. Producer taxes, which are one type of indirect taxes,
are on this worksheet.
National accounts (GDP at market prices)
e. This worksheet contains information on household
consumption spending, government recurrent
spending, and investment demand. It also has total
export earnings and import payments.
f. The difference between GDP at factor cost and GDP at
market prices is that the latter includes sales taxes and
import tariffs (indirect taxes).
Government budget
g. Indirect taxes on this worksheet include sales and
import and export taxes.
h. Direct taxes include personal and corporate taxes.
In our aggregate SAM, we combine these two taxes
together and charge them both to households.
Balance of payments
i. Ghana ran a current account deficit in 2007. You
should therefore enter a negative number into the
macro-SAM (foreign dis-savings).
j. Exports and imports consist of traded goods and
services. The balance of payments often nets out
exported and imported services, so you will have to use
the value of total imports and exports from national
accounts.
6. Information on household savings is missing from the
datasets. However, we know that incomes must equal
expenditures in a balanced SAM, so household savings can
be calculated as a residual once we have entered all of the
other cells.
DisCussion of task 1
Once you have completed Task 1, you can check your answers
by opening the file “Task 1 Solution.xls.” The numbers
contained in the solution’s macro-SAM are color-coded to make
it easier to locate the relevant information. Also, all entries are
linked to their sources so that you can check the origin and
mode of calculation of all macro-SAM cells. By completing
this first exercise you will have learned how to construct a
balanced and consistent macro-SAM. In the next exercise, we
will construct a more disaggregated SAM for Ghana and then
discuss the meanings of each cell entry in greater detail.
Food Security in Practice 5
notes
2. For a description of the System of National Accounts, see />3. In our SAM and exercises, we will exclude corporate enterprises. For simplicity, we assume that profits (or gross operating
surplus) are paid directly to households (i.e., households’ direct taxes include corporate taxes).
4. If total household expenditures exceed incomes, then a negative value would appear in the savings cell entry.
5. See the IFPRI discussion papers TMD-33 (www.ifpri.org/divs/TMD/DP/tmdp33.htm), also published as Robinson et al. 2001;
TMD-58 (www.ifpri.org/divs/tmd/dp/tmdp58.htm); and TMD-64 (www.ifpri.org/divs/tmd/dp/tmdp64.htm).
Activities
C1
Commodities
C2
Factors
Households
C4
Government
C5
Savings and
investment
C6
Rest of
world
C7 Total
Labor
C3-1
Capital
C3-2
Activities
R1
24,996 24,996
Commodities
R2
12,029 12,142 1,805 4,680 5,151 35,807
Factors
Labor
R3-1
9,717 9,717
Capital
R3-2
3,250 3,250
Households
R4
9,717 3,250 1,387 2,001 16,354
Government
R5
2,372 940 739 4,052
Savings and
investment
R6
3,272 860 548 4,680
Rest of world
R7
8,439 8,439
Total
24,996 35,807 9,717 3,250 16,354 4,052 4,680 8,439
Food Security in Practice 7
Exercise 2: Analysis of a SAM
DetaileD DisCussion of
the MaCro-saM
I
n the previous exercise, you constructed an aggregate
macro-SAM using 2007 data from Ghana. The balanced
macro-SAM is shown in Table 2. In this background section
we discuss each of the entries and identify where information
can usually be found to construct a more disaggregated SAM.
Cell entries are identified as row-column combinations and
are valued in millions of Ghana cedi at 2007 prices.
6
Value-added
[Labor, Activities: 9,717] and [Capital, Activities: 3,250]
Total value-added is the earnings received by the factors of
production, such as the wages and salaries paid to labor and the
profits paid to capital. Total value-added is also called “GDP at
factor cost.” Information on GDP for different sectors is usually
found in national accounts. This was the case in Task 1, where
Ghana’s GDP at factor cost was reported for 14 sectors. Total
value-added was split into labor and capital components using
technology coefficients from Ghana’s input–output table. The
national capital–labor coefficient from Task 1 estimates that
75 percent of GDP is generated by labor, implying that Ghana is
a “labor-intensive” economy.
Intermediate demand
[Commodities, Activities: 12,029]
Intermediate demand is the goods and services used in the
production process. This was a single number in the macro-SAM
in Task 1, and so it could only describe the national ratio of
spending on factor to nonfactor inputs. However, a more detailed
SAM that disaggregates activities and commodities would
8 Social Accounting Matrices and Multiplier Analysis
reveal differences in production technologies across sectors. For
example, it would show which sectors use more fuel per value-
unit of output. This information is useful when determining
the effects of policies and external shocks on the economy.
Information on sectors’ production technologies is drawn from
an input–output (IO) table. If an IO table does not exist, or if it
does not include all sectors—as was the case in Ghana—then
it is necessary to estimate production technologies using agricul-
tural farm budgets and industrial surveys.
Factor income distribution
[Households, Labor: 9,717] and [Households, Capital:
3,250]
Factor incomes in the macro-SAM were paid to an aggregate
household account. However, most SAMs split households into
different groups, such as rural and urban. This information
allows us to assess distributional impacts from policies. As a
simple example, if our SAM shows that low-income households
rely more on labor earnings than higher-income households,
then policies that increase production in labor-intensive sectors
should disproportionately benefit poorer households. Obviously,
the greater the disaggregation, the more we can refine our
assessment. Thus, the distribution of factor incomes is an
important part of a SAM. This information is usually drawn
from labor force or household income surveys. There may also
be factors payments to nonhousehold accounts. For example,
some of the profits earned by capital may be paid to foreign
investors (for instance, mining rents) or to the government
(such as state-owned enterprises). For simplicity we ignore
these flows in our exercises.
Private consumption
[Commodities, Households: 12,142]
Households use most of their incomes to purchase commodities
for consumption. Although the macro-SAM contains a single
entry, most SAMs disaggregate private consumption across
different commodities and household groups because house-
holds’ consumption patterns vary, especially across income
groups. For example, poorer households usually spend a larger
share of their income on food than do wealthier households,
and so changes in the supply of foods will affect poorer house-
holds more. These differences can influence the distributional
impacts of policies and external shocks. Information on
consumption patterns can be drawn from household income
and expenditure surveys, such as the World Bank’s Living
Conditions Monitoring Surveys.
Government recurrent spending and
investment demand
[Commodities, Government: 1,805] and [Commodities,
Investment: 4,680]
Total absorption in an economy consists of private consump-
tion, as well as public consumption spending and investment
demand. Public consumption or recurrent expenditure consists
of the goods and services purchased to maintain government
function. Investment demand consists of both public and
private gross capital formation, such as spending on roads,
schools, and residential housing. Investment demand is
therefore mainly for commodities like cement and construc-
tion services. This information is usually drawn from national
accounts, government budgets, and supply-use tables.
Foreign trade
[Commodities, Rest of world: 8,439] and [Rest of world,
Commodities: 5,151]
Information on export earnings and import payments comes
from three sources. National accounts and the balance of
payments provide aggregate estimates of international trade in
goods and services. Most SAMs include further detail on specific
commodities groups, the information for which is compiled
from a country’s customs or trade data.
Government taxes
[Government, Commodities: 2,374] and [Government,
Households: 940]
The government generates revenue from direct and indirect
taxes. Direct taxes include personal (pay as you earn) and
corporate taxes imposed on domestic institutions, such as
households and enterprises. Because we do not distinguish
between households and enterprises, direct taxes appear as
a single value in our Ghana macro-SAM. Similarly, we do
not distinguish between the various indirect taxes imposed
on commodities, such as sales and export taxes and import
tariffs.
7
Information on tax rates on different commodities
and households can usually be obtained from tax authorities,
customs data, and household income and expenditure surveys.
Remittances and social transfers
[Households, Government: 1,387] and [Households, Rest of
world: 2,001]
Apart from factor payments, households also receive transfers
from the government and the rest of the world. Government
transfers include social security payments and public pensions.
Foreign receipts usually include remittances from family
members living and working abroad. Conversely, households
Food Security in Practice 9
might also remit incomes to family members living abroad. In
the macro-SAM, this could be reflected as a positive entry in the
cell [Rest of world, Households] or, as in the Ghana SAM, as a
negative addition to the cell [Households, Rest of world].
Grants, loans, and interest on
foreign debt
[Government, Rest of world: 739]
Many governments in low-income countries receive grants
and loans from development partners and foreign financial
institutions to cover recurrent spending and capital invest-
ments. These are direct payments from the rest of the world
to the government. Conversely, foreign debt requires interest
payments, which are positive payments from the government
to the rest of the world. Alternatively, interest payments can be
treated as a negative receipt from the rest of the world. This is
the convention adopted in the Ghana macro-SAM. Information
on foreign grant transfers to and from the government is drawn
from government budgets and the balance of payments.
Domestic and foreign savings
[Savings, Households: 3,272], [Savings, Government: 860],
and [Savings, Rest of world: 548]
The difference between incomes and expenditures is savings
(or dis-savings if expenditures exceed incomes). For the
government account, this is equal to the fiscal surplus/deficit
and for the rest of world account it is the current account
balance. This information is documented in the govern-
ment budget and balance of payments. However, information
on domestic private savings is rarely recorded in developing
datasets. Therefore, household savings is often treated as a
residual when balancing a macro-SAM.
TASK 2
interpreting the ghana
MiCro-saM
In Task 2, you will calculate various macroeconomic indicators
using the information contained in a SAM and then answer a
number of questions regarding Ghana’s economic structure.
The SAM can be found in the Excel file “Task 2 Worksheet.xls.”
The SAM is more detailed than the one constructed in Exercise
1. Activities are now disaggregated across seven sectors, and
households are split into rural and urban groups. We will refer
to this as the “Ghana micro-SAM.” Using the SAM, you are asked
to calculate and interpret production shares, commodity shares,
demand shares, household income and expenditure shares, and
macroeconomic indicators. The instructions and questions for
Task 2 can be found on the Excel worksheet.
Hints and tips
1. It is good practice to link your calculations to the SAM
entries. This will allow you to easily trace back the data
used in your calculations.
2. Hints are included in the Excel file. For example, next to
some tables there is a blue number, which is the correct
answer that should appear in the table. Check this
number with your own answer to make sure you are on
the right track.
DisCussion of task 2
GDP shares
By calculating the share of GDP generated by each sector, we
are determining which sectors contributed the most to factors’
income or value-added. Our findings show that Ghana depends
heavily on agriculture, with the sector contributing 35.1 percent
to GDP at factor cost. Utilities and construction also account
for a large share of GDP (14.9 percent). The third largest sector
(12.9 percent) is the government, which produces goods and
services like housing, health, and education. The most labor-
intensive sectors in the SAM are agriculture, trade, and public
services. For example, 92.6 percent of agriculture value-added
is paid to labor. By contrast, the most capital-intensive sector
in Ghana is mining, where capital contributes 66.8 percent of
total value-added. Together these calculations describe the key
structural characteristics of production in the economy.
Gross output shares
By calculating the share of each factor and commodity
payment in the value of gross output, we are determining
sectors’ production technologies. In other words, we are calcu-
lating the amount of each input required to produce a unit of
each sector’s output. We found that, in Ghana, manufactured
goods are usually the most important intermediate input. In
the mining sector, for example, manufactured inputs account
for 29.3 percent of the value of output. This means that for each
100 cedis-worth of mining output, 29.3 cedi must be spent on
manufactured inputs. Manufactured inputs are also important
for the production of manufactured goods themselves (29.2
percent) and for trade and transport (39.3 percent). In turn,
trade and transport is a key input into most sectors, especially
manufacturing, agriculture, private services, and public
services. This input payment captures the cost of moving goods
from farms and factories to the markets where they are sold
to households, investors, and other demanders. Therefore, not
surprisingly, trade and transport accounts for a large share of
the cost of agricultural production. As we will see in the next
section, information on sectors’ production technologies is an
10 Social Accounting Matrices and Multiplier Analysis
important part of the SAM, because it allows us to estimate
interdependency (or linkages) between sectors.
Trade shares
These calculations shed light on the structure of imports and
exports. Ghana, like many low-income countries in Africa, relies
on primary exports, such as agriculture (39.1 percent) and mining
(26 percent). It uses these export earnings to pay for imported
goods. Our calculations show that the majority of imports are
manufactured goods (88.2 percent), agricultural products
(6.8 percent), and private services (such as tourism) (4.9 percent).
Another way of understanding the relative importance of
trade for different commodities is to calculate import penetra-
tion ratios (IPR) and export intensities (EI). The IPR is the
share of imports in the value of total demand, and EI is the
share of exports in the value of gross output.
Our calculated IPRs reveal that Ghana’s manufacturing
sector faces the most import competition, with 54.1 percent of
total demand supplied by foreigners. By contrast, even though
Ghana imports agricultural goods, these account for only a
small part of total agricultural demand (7.4 percent). The
Ghanaian economy is therefore reliant on foreign manufac-
tured goods, but is fairly self-sufficient in agriculture. Our
calculated EIs show almost all mining output is sold abroad
(95.1 percent). Thanks to cocoa farmers, Ghanaian agriculture
is also an export-intensive sector, with 28.5 percent of agricul-
tural output exported.
Total demand shares
These calculations consider all the various sources of
commodity demand, including intermediate, private and public
consumption, investment, and exports. Our calculations show
that manufacturing and agricultural goods are the largest
components of private consumption spending (43.7 percent
and 34.8 percent, respectively), followed by private services
(15.1 percent). Not surprisingly, most government spending is
on the outputs of the government services sector. Finally, invest-
ment demand is mainly accounted for by manufactures
(56.1 percent) and electricity and construction (43.9 percent).
Household income and expenditure
shares
Our SAM separates rural from urban households, which allows
us to consider differences in how these two household groups
earn and spend their incomes. For example, rural households
spend most of their income on agricultural (33.8 percent) and
manufactured goods (33 percent). This high manufacturing
share may be surprising because we know that poorer rural
households usually spend most of their income on food. This
is, in fact, still the case in Ghana because manufacturing
includes the food-processing sector, which means that most of
rural demand for manufactured goods is actually demand for
processed foods (for example, milled grains and meats). Urban
households, on the other hand, spend less of their incomes on
foods, as seen by the lower expenditure shares on both agricul-
tural (19.5 percent) and manufactured goods (32 percent).
Total household incomes in our SAM comprise factor
incomes (such as labor wages and capital profits) and
nonfactor incomes (such as government transfers and foreign
remittances). In our earlier calculations, we saw that produc-
tion in Ghana is mostly labor intensive. Not surprisingly then,
both rural and urban households earn most of their income
from labor (69.6 percent and 51.3 percent, respectively). Both
household groups are relatively equally reliant on capital
earnings and government transfers. Capital earnings reflect the
profits generated by nonfarm enterprises, such as rural food
processors and urban manufactures factories. Finally, urban
households are the largest recipients of foreign remittances.
These transfers may be from family members working abroad.
They constitute 17.5 percent of urban incomes compared to
only 5.6 percent for rural households.
Macroeconomic shares
These indicators are based on GDP at factor cost, the fiscal
balance, the current account balance, the level of private
savings, and total imports and exports. GDP at factor cost is
total capital and labor value added and, in our SAM, is equal to
12,967 million cedi. GDP at market prices is the sum of all final
demands:
GDP = C + I + G + E - M
where C is private consumption
I is investment
G is government consumption
E is exports, and
M is imports.
GDP at market prices in our SAM is
15,339 million cedi.
The recurrent fiscal balance is 860 million cedi or 5.6
percent of GDP at market prices. The fact that it is positive
means that Ghana’s government ran a recurrent fiscal surplus
in 2007. By contrast, the current account balance, which is
recorded in the SAM as negative foreign savings, is a deficit of
–548 million cedi or –3.6 percent of GDP. Most of the current
Food Security in Practice 11
account deficit is due to Ghana’s large trade deficit of –3,228
million cedi or 21.4 percent of GDP: its total imports of 8,439
million cedi exceed total exports of 5,151 million cedi. Finally,
the share of imports and exports in GDP (the trade-to-GDP
ratio) is 88.6 percent, indicating that Ghana is a relatively open
economy.
In summary, the information in the SAM reveals a great
deal about a country’s economic structure. Our calculations
show a number of key characteristics of Ghana’s economy. For
example, we now know that Ghana is an agriculture-based and
labor-intensive economy that relies heavily on agricultural and
mining exports to pay for imported manufactures. However,
primary exports are insufficient to pay for all exports, and
the country runs a large current account deficit as a result.
Ghana’s government is an important part of the economy,
and its fiscal surplus accounts for a significant share of total
investment. However, though investment is a large part of GDP,
private consumption is most important. Here we found that
rural households spend a large share of income on agricul-
tural goods and derive more of their incomes from labor than
do urban households. These structural characteristics of the
Ghanaian economy are important for explaining economic
linkages and multiplier effects.
notes
6. In 2007 Ghana removed four zeros from its currency. The macro-SAM is therefore measured in “new” Ghana cedi. A detailed
description of a 2005 Ghana SAM (Breisinger et al. 2005) using “old” Ghana cedi can be downloaded from the websites of IFPRI
and Ghana Statistical Services (
7. Many SAMs assign separate accounts to each type of tax. Tax revenues are then paid to the government account.
12 Social Accounting Matrices and Multiplier Analysis
Figure 2. Direct and indirect linkages
Food Security in Practice 13
Exercise 3: Economic Linkages and Multiplier Effects
What are eConoMiC linkages anD
Multiplier effeCts?
W
hen we talk of “exogenous demand-side shocks” to
an economy, we are referring to changes in export
demand, government spending, or investment
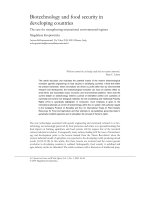
demand. The impacts of these shocks have both direct and
indirect effects. Direct effects are those pertaining to the
sector that is directly affected by the shock. For example, an
exogenous increase in demand for Ghanaian agricultural
exports has a direct impact on the agricultural sector. However,
it may also have indirect effects stemming from agriculture’s
linkages to other sectors and parts of the economy. These
indirect linkages can, in turn, be separated into production
and consumption linkages. When we add up all direct
and indirect linkages, we arrive at a measure of the shock’s
multiplier effect, or how much a direct effect is amplified or
multiplied by indirect linkage effects.
Production linkages are determined by sectors’ produc-
tion technologies, which are contained in the input-output part
of SAM. They are differentiated into backward and forward
linkages.
• Backward production linkages are the demand for
additional inputs used by producers to supply additional
goods or services. For example, when agricultural
production expands, it demands intermediate goods
like fertilizers, machinery, and transport services. This
demand then stimulates production in other sectors
to supply these intermediate goods. The more input-
intensive a sector’s production technology is, the stronger
its backward linkages are.
• Forward production linkages account for the increased
supply of inputs to upstream industries. For example,
when agricultural production expands, it can supply more
goods to the food-processing sector, which stimulates
manufacturing production. So the more important a
sector is for upstream industries, the stronger its forward
linkages will be.
Stronger forward and backward production linkages
lead to larger multipliers. Traditional input-output multi-
pliers measure the effects of production linkages only. They
do not consider consumption linkages, which arise when
an expansion of production generates additional incomes
for factors and households, which are then used to purchase
goods and services. For example, when agricultural produc-
tion expands, it raises farmers’ incomes, which are used to
buy consumer goods. Depending on the share of tradable
and nontradable goods in households’ consumption baskets,
domestic producers benefit from greater demand for their
Indirect
linkages
Exogenous shock
linkages
Backward
linkages
Forward
linkages
products. The size of consumption linkages depends on various
factors, including the share of factor income distributed to
households; the composition of the consumption basket; and
the share of domestically supplied goods in consumer demand.
Evidence from developing countries suggests that consumption
linkage effects are much larger than production linkage effects:
they account for 75–90 percent of total multiplier effects in
sub-Saharan Africa and 50–60 percent in Asia (Haggblade,
Hammer, and Hazell 1991). SAM multipliers therefore tend to
be larger than input-output multipliers because they capture
both production and consumption/income linkages.
Economic linkages are fairly static and are determined by
the structural characteristics of an economy (that is, sectors’
production technologies and the composition of households’
consumption baskets). Multiplier effects, on the other hand,
capture the combined effects of economic linkages over a period
of time. For example, forward production linkages tell us that
increasing agricultural production will stimulate production of
processed foods by increasing the supply of inputs to this sector.
This is the first-round linkage effect between agriculture and
food processing. However, in the second round, the increase in
processed food production will have additional forward produc-
tion linkage effects to other sectors, such as to the restaurant
sector, which uses processed foods as an intermediate input.
Similarly, in the third round, the expansion of the restaurant
sector will generate even more demand for other sectors. This
process continues over many rounds as the effects of increasing
agricultural production ripple throughout the economy, even-
tually becoming small enough that they effectively cease.
SAM multipliers measure the value of all production and
consumption linkage effects. They capture direct and indirect
effects in the first and all subsequent rounds of the circular
income flow. More specifically, multipliers translate initial
14 Social Accounting Matrices and Multiplier Analysis
Figure 3. Circular ow of income in the multiplier process
Increase in
agricultural
exports
Increase in
agricultural
Increase in
nonagricultural
Increase in
factor
incomes and
employment
Increase in
household
incomes and
s
linkages
linkages
Ind s
Import leakage
Government
Rest of world
A
A
B
C
Tax leakage
Food Security in Practice 15
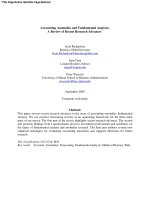
changes in exogenous demand (for example, increased agricul-
tural export demand) into total production and income changes
of endogenous accounts. Figure 3 illustrates this process.
Three types of multipliers can be distinguished from the
figure. First, an output multiplier combines all direct and
indirect (consumption and production) effects across multiple
rounds and reports the final increase in gross output of all
production activities. In Figure 3, this is the combined increase
in agricultural and nonagricultural production (the two boxes
marked “A”). Second, a GDP multiplier measures the total
change value-added or factor incomes caused by direct and
indirect effects (the box marked “B”). Finally, the income
multiplier measures the total change in household incomes
(the box marked “C”).
The size of a multiplier depends on the structural charac-
teristics of an economy. For example, a key determinant is the
share of imported goods and services in households’ consump-
tion demand. If households consume domestically produced
goods, then increasing household incomes will benefit domestic
producers and the circular flow of income will lead to further
rounds of indirect linkage effects. However, if households
demand imported goods, then it is foreign producers who
benefit and the indirect linkage effects will be smaller. Import
demand is therefore a leakage from the circular flow of
income. Similarly, when the government taxes factor incomes,
it limits how much of the returns to production are earned to
households, and so reduces consumption linkages. Ultimately,
these kinds of leakages make the round-by-round effects slow
down more quickly and reduce the total multiplier effect.
task 3: CalCulating rounD-by-
rounD linkage effeCts
In Task 3, you will calculate backward production linkage
effects during each round of the circular flow of income. In
this task, you will use an aggregated two-sector version of the
Ghana SAM to calculate input coefficients for the agricultural
and nonagricultural sectors. Using these technical coefficients,
you will then determine how downstream sectors benefit when
agricultural production increases as a result of its use of inter-
mediate inputs. The Ghana SAM and the flow chart (where
you can complete this task) can be found in the file “Task 3
Worksheet.xls.” Once you have completed the task, you can
check your answer by looking at the file “Task 3 Solution.xls.”
1. You are only asked to calculate backward production
linkage effects. In Task 3 we ignore forward production
and consumption linkages. We’ll come back to these in
later tasks.
2. Calculate input coefficients as in Task 2. It is good
practice to link your calculations to the SAM entries
because this allows you to trace back the data used in
your calculations.
3. The first-round effect can be calculated by multiplying
the direct increase in agricultural production (10) by the
respective input coefficients for each of the two sectors to
derive the additional increase in production in the second
round.
4. To calculate second-round effects, repeat the process in
hint 2, but this time start with the production increase
from the end of round 1.
5. The numbers in blue are the correct answers for the
neighboring cell entry.
DisCussion of task 3
This task demonstrates how sectors’ production technologies
(input coefficients) determine the size of multiplier effects.
For example, increasing agricultural production has a larger
linkage effect on nonagricultural production because the input
coefficient on nonagricultural inputs (0.27) is much larger
than the agricultural input coefficient (0.09). So at the end of
the first round, the direct increase in agricultural production
by 10 billion cedi leads to an indirect 2.71 billion-cedi increase
in nonagricultural production, but only a 0.86 billion-cedi
increase in agricultural production.
This task also shows how indirect effects become smaller
from round to round. For example, the direct impact of
increased agricultural export demand was a 10 billion-cedi
increase in agricultural production. In the first round, total
agricultural and nonagricultural production increased by 3.56
billion cedi (0.86 for agriculture and 2.71 for nonagriculture).
In the second round the total increase was 1.74 billion cedi,
and in the third round it was 0.89 billion cedi. If we were to
continue calculating these linkage effects into subsequent
rounds, we would see their values declining until they are
virtually zero. At this point we can say that the multiplier
process resulting from the increase in agricultural export
demand has effectively ceased.
The importance of technical coefficients and the fact that
linkages diminish after each round are important features
of the multiplier process. They still apply even when forward
production and consumption linkages are included in the
calculation of multiplier effects. Task 3 has therefore explained
the core concepts of the multiplier process and lays the founda-
tion for calculating multipliers using matrix algebra, which is
the objective of the next two exercises.
16 Social Accounting Matrices and Multiplier Analysis