RECENT ADVANCES ON META-HEURISTICS AND THEIR APPLICATION TO REAL SCENARIOS pot
Bạn đang xem bản rút gọn của tài liệu. Xem và tải ngay bản đầy đủ của tài liệu tại đây (5.44 MB, 138 trang )
RECENT ADVANCES ON
META-HEURISTICS AND
THEIR APPLICATION TO
REAL SCENARIOS
Edited by Javier Del Ser
Recent Advances on Meta-Heuristics and Their Application to Real Scenarios
/>Edited by Javier Del Ser
Contributors
Fernando Francisco Sandoya, Dalessandro Vianna, Igor Carlos Pulini, Carlos Bazilio Martins, Alejandra Cruz-Bernal,
Ikou Kaku, Patrick Siarry, Cédric Leboucher, Hyo-Sang Shin, Stéphane Le Ménec, Antonios Tsourdos, Rachid Chelouah
Published by InTech
Janeza Trdine 9, 51000 Rijeka, Croatia
Copyright © 2013 InTech
All chapters are Open Access distributed under the Creative Commons Attribution 3.0 license, which allows users to
download, copy and build upon published articles even for commercial purposes, as long as the author and publisher
are properly credited, which ensures maximum dissemination and a wider impact of our publications. After this work
has been published by InTech, authors have the right to republish it, in whole or part, in any publication of which they
are the author, and to make other personal use of the work. Any republication, referencing or personal use of the
work must explicitly identify the original source.
Notice
Statements and opinions expressed in the chapters are these of the individual contributors and not necessarily those
of the editors or publisher. No responsibility is accepted for the accuracy of information contained in the published
chapters. The publisher assumes no responsibility for any damage or injury to persons or property arising out of the
use of any materials, instructions, methods or ideas contained in the book.
Publishing Process Manager Natalia Reinic
Technical Editor InTech DTP team
Cover InTech Design team
First published January, 2013
Printed in Croatia
A free online edition of this book is available at www.intechopen.com
Additional hard copies can be obtained from
Recent Advances on Meta-Heuristics and Their Application to Real Scenarios, Edited by Javier Del Ser
p. cm.
ISBN 978-953-51-0913-6
free online editions of InTech
Books and Journals can be found at
www.intechopen.com
Contents
Preface VII
Chapter 1 Using Multiobjective Genetic Algorithm and Multicriteria
Analysis for the Production Scheduling of a Brazilian
Garment Company 1
Dalessandro Soares Vianna, Igor Carlos Pulini and Carlos Bazilio
Martins
Chapter 2 Grasp and Path Relinking to Solve the Problem of Selecting
Efficient Work Teams 25
Fernando Sandoya and Ricardo Aceves
Chapter 3 Meta-Heuristic Optimization Techniques and Its Applications
in Robotics 53
Alejandra Cruz-Bernal
Chapter 4 A Comparative Study on Meta Heuristic Algorithms for Solving
Multilevel Lot-Sizing Problems 77
Ikou Kaku, Yiyong Xiao and Yi Han
Chapter 5 A Two-Step Optimisation Method for Dynamic Weapon Target
Assignment Problem 109
Cédric Leboucher, Hyo-Sang Shin, Patrick Siarry, Rachid Chelouah,
Stéphane Le Ménec and Antonios Tsourdos
Preface
The last decade has witnessed a sharp increase in the dimensionality of different underlying
optimization paradigms stemming from a variety of fields and scenarios. Examples abound
not only in what relates to purely technological sectors, but also in other multiple disci‐
plines, ranging from bioinformatics to finance, economics, operational research, logistics, so‐
cial and food sciences, among many others. Indeed, almost every single aspect driving this
increased dimensionality has grown exponentially as exemplified by the upsurge of com‐
munication terminals for the optimization of cellular network planning or the rising need
for sequence alignment, analysis, and annotation in genomics.
As a result, the computational complexity derived from solving all such paradigms in an
optimal fashion has augmented accordingly, to the extent of igniting an active research
trend towards near-optimal yet cost-efficient heuristic solvers. Broadly speaking, heuristics
resort to experience-based approximate techniques for solving problems when enumerative
alternatives (e.g. exhaustive search) are not efficient due to the high computational complex‐
ity derived therefrom. In particular, meta-heuristics have lately gained momentum, con‐
ceived as heuristics springing from the mimicking of intelligent learning procedures and
behaviours observed in Nature, arts and social sciences. As such, from the advent of geneti‐
cally-inspired search algorithms in mid 70s, a wide portfolio of evolutionary meta-heuristics
and techniques based on the so-called swarm intelligence has been applied to distinct opti‐
mization paradigms: to mention a few, harmony search, memetic algorithms, differential
search, ant colony optimization, particle swarm optimization, cuckoo search, gravitational
search, intelligent water drops, coral reef optimization and simulated annealing, among
many others.
This flurry of activity around meta-heuristics and their application to real scenarios is the
raison d'être of this booklet: to provide the reader with an insightful report on advances in
meta-heuristic techniques in certain exemplifying scenarios. On this purpose, the booklet
comprises 5 chapters, each presenting the application of different meta-heuristics to differ‐
ent scenarios. The first chapter addresses the application of multi-objective genetic algo‐
rithms for optimizing the task scheduling of
garment companies. The approach takes three
conflicting objectives into account: to minimize the total production time, to maximize the
percentage of use of corporate production centers and to minimize the internal production
centers downtime. Next, the second chapter proposes to hybridize the so-called greedy
randomized adaptive search procedure (GRASP) with path relinking for optimally selecting
work teams under maximum diversity criteria, with clear applications to operational re‐
search, academia and politics. The third chapter delves into a thorough review on meta-heu‐
ristics applied to the route finding problem in robotics, with an emphasis on the
combination of genetic algorithms and ant colony optimization as an outperforming scheme
with respect to other existing approaches. On the other hand, the fourth chapter investigates
different meta-heuristic algorithms in the context of multilevel lot-sizing problems, which
hinge on determining the lot sizes for producing/procuring multiple items at different levels
with quantitative interdependencies, so as to minimize the total production costs in the
planning horizon. This chapter also introduces a special variable neighborhood based algo‐
rithm shown to perform satisfactorily for several simulated benchmark instances under di‐
verse scales. Finally, the fifth chapter ends the booklet by outlining a two-step optimization
method for dynamic weapon target assignment problem, a military-driven application
where an allocation plan is to be found to assigning the available weapons in an area to in‐
coming targets. Specifically, the proposed scheme combines different optimization ap‐
proaches such as graph theory, evolutionary game theory, and particle swarm optimization.
The editor would like to eagerly thank the authors for their contribution to this book, and
especially the editorial assistance provided by the InTech publishing process manager, Ms.
Natalia Reinic. Last but not least, the editor’s gratitude extends to the anonymous manu‐
script processing team for their arduous formatting work.
Dr. Javier Del Ser
Technology Manager, OPTIMA Business Area
TECNALIA RESEARCH & INNOVATION
Zamudio, Spain
PrefaceVIII
Chapter 1
Using Multiobjective Genetic Algorithm and
Multicriteria Analysis for the Production Scheduling
of a Brazilian Garment Company
Dalessandro Soares Vianna, Igor Carlos Pulini and
Carlos Bazilio Martins
Additional information is available at the end of the chapter
/>1. Introduction
The Brazilian garment industry has been forced to review its production processes due to
the competition against Asiatic countries like China. These countries subsidize the produc‐
tion in order to generate employment, which reduces the production cost. This competition
has changed the way a product is made and the kind of production. The industry has fo‐
cused on customized products rather than the ones large-scale produced. This transforma‐
tion has been called “mass customization” [1].
In this scenario the Brazilian garment industry has been forced to recreate its production
process to provide a huge diversity of good quality and cheaper products. These must be
made in shorter periods and under demand. These features require the use of chronoanaly‐
sis to analyze the production load balance. Since the production time becomes crucial, the
task
1
allocation must regard the distinct production centers
2
. Most of a product lead time –
processing time from the beginning to the end of the process – is spent waiting for resour‐
ces. In the worse case, it can reach 80% of the total time [2]. So the production load balance is
critical to acquire a good performance.
It is hard to accomplish production load balance among distinct production centers. This
balance must regards the available resources and respect the objectives of the production.
1 Tasks: set of operations taken on the same production phase.
2 Production centers: internal or external production cell composed by a set of individuals which are able to execute
specific tasks.
© 2013 Vianna et al.; licensee InTech. This is an open access article distributed under the terms of the Creative
Commons Attribution License ( which permits unrestricted use,
distribution, and reproduction in any medium, provided the original work is properly cited.
Lindem [3] argues that these scheduling problems are NP-Complete since the search space is
a factorial of the number of variables. These problems may be solved by using exact meth‐
ods. However due to time constraints, heuristics must be used in order to find good quality
solutions within a reasonable time.
Nowadays the ERP (Enterprise Resource Planning) systems used by the Brazilian garment
industry do not consider the finite source of resources and the constraints of the real produc‐
tion environment [3]. Task scheduling is done manually through simple heuristics techni‐
ques like FIFO (First In First Out) and SPT (Shortest Processing Time). Although those
techniques can generate feasible solutions, these ones usually have poor quality.
In real optimization problems, as the problem addressed in this work, is generally desirable
to optimize more than one performance objective at the same time. These objectives are gen‐
erally conflicting, i.e., when one objective is optimized, the others become worse. The goal of
multiobjective combinatorial optimization (MOCO) [4] [5] is to optimize simultaneously
more than one objective. MOCO problems have a set of optimal solutions (instead of a sin‐
gle optimum) in the sense that no other solutions are superior to them when all objectives
are taken into account. They are known as Pareto optimal or efficient solutions.
Solving MOCO problems is quite different from single-objective case, where an optimal sol‐
ution is searched. The difficulty is not only due to the combinatorial complexity as in single-
objective case, but also due to the research of all elements of the efficient set, whose
cardinality grows with the number of objectives.
In the literature, some authors have proposed exact methods for solving specific MOCO
problems, which are generally valid to bi-objective problems but cannot be adapted easi‐
ly to a higher number of objectives. Also, the exact methods are inefficient to solve large-
scale NP-hard MOCO problems. As in the single-objective case, the use of heuristic/
metaheuristic techniques seems to be the most promising approach to MOCO problems
because of their efficiency, generality and relative simplicity of implementation [5] [6] [7].
Genetic algorithms are the most commonly used metaheuristic in the literature to solve
these problems [8].
The objective of this work is to develop a method to carry out the production scheduling of
a Brazilian garment company, placed at Espírito Santo state, in real time, which must regu‐
larly balance the product demands with the available resources. This is done in order to: re‐
duce the total production time; prioritize the use of internal production centers of the
company rather than the use of external production centers; and reduce the downtime of the
internal production centers.
With this purpose, initially a mixed integer programming model was developed for the
problem. Then, we implemented a multiobjective genetic algorithm (MGA) based on the
NSGA-II [4] model, which generates a set of sub-optimal solutions to the addressed prob‐
lem. After we used the multicriteria method Weighted Sum Model – WSM [9] to select one
of the solutions obtained by the MGA to be applied to the production scheduling. The
mixed integer programming model, the MGA developed and its automatic combination
with the multicriteria method WSM are original contributions of this work.
Recent Advances on Meta-Heuristics and Their Application to Real Scenarios2
2. Addressed problem
The production planning process of the Brazilian garment industry may be split into many
phases from demand provision to tasks scheduling at each machine. Tubino [2] says that the
production planning is defined by the demand from the Planning Master of Production
(PMP). This demand is sent to the Material Requirements Planning (MRP) that calculates the
material required. Then it becomes available to the Issuance of Production Orders and Se‐
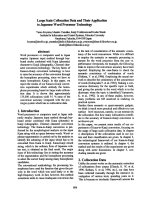
quencing. These steps are depicted at Figure 1.
Demand Prediction
Planning Master of Production (PM P)
Material Requirements Planning (MRP)
Issuance of Production Orders
Sequencing
Figure 1. Production planning.
This work approaches the scheduling phase where a set of tasks has to be distributed among
production centers. As said before, production center is an internal or external production
cell composed by a set of specialized individuals. Each task may be done by a set of produc‐
tion centers and each production center is able to execute many tasks. The objectives of this
work are: i) to minimize the total production time (makespan – time from the beginning of
the first task to the end of the last task); ii) to maximize the use of internal production cen‐
ters – the use of internal production centers does not imply cost overhead
3
since employees'
salary are already at the payroll of the company; iii) to minimize the internal production
centers downtime.
These three objectives have been chosen in order to meet the needs of the analyzed compa‐
ny. Some couple of them are conflicting, i.e., when one has an improvement the other tends
to get worse. Others objectives are not conflicting, but the optimization of one does not guar‐
antee the optimization of the other. As an example of conflicting objectives, we have the ob‐
jectives “to minimize the total production time” and “to maximize the use of internal
production centers”: for minimizing the total production time it is necessary to make the
best use of the available production centers, regardless of whether they are internal or exter‐
3 Except when the company has to pay overtime.
Using Multiobjective Genetic Algorithm and Multicriteria Analysis for the Production…
/>3
nal. The objectives “to minimize the total production time” and “to minimize the internal
production centers downtime” are not conflicting: by decreasing the downtime of the pro‐
duction centers, the total production time also tends to decrease. However, if tasks are allo‐
cated to an internal production center, which together have an execution time shorter than
the total production time, it is possible to arrange them in different ways without changing
the total production time. The objective “to minimize the internal production centers down‐
time” requires the best arrangement of the tasks within each internal production center.
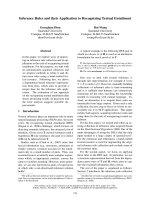
In order to better describe the addressed problem, Figure 2 depicts the steps toward the pro‐
duction of a short. The production process is composed by a set of production stages. Each
stage has a set of operations to be performed. In this work, this set is called task. In this ex‐
ample, there are 6 production stages (scratch, cut, sewing, embroidery, laundry and finish‐
ing). The sewing task lasts 12.54 minutes and is composed by d operations. There are h
production centers qualified to perform the sewing task.
Product
Finishin g
1,09
Laundry
2,12
Scratch
Stage
Tim e Table
1,20
Tim e
Cut
3,34
Sewing
12,54
Embroidery
0,45
Operation 1
Operation 2
O peration d
Sewing Task
Production Center 1
Production Center 2
Production Center h
Figure 2. Example of a production process.
The execution time of a task is the sum of the execution time of its operations. This time is
used during the scheduling, which hides the complexity of the operation distribution inside
a stage. So it can be seen as a classical task scheduling where each production center is a
machine and the operations set of each production stage is a task.
During the scheduling process the following constraints must be respected: i) for each prod‐
uct exists an execution order of tasks, i.e., there is a precedence order among tasks; ii) each
task can only be executed in production centers that are qualified to it, i.e. production cen‐
ters are specialized; iii) employees stop working regularly for lunch and eventually for oth‐
ers reasons like training or health care; iv) depending on the workload it is possible to work
overtime; v) the time spent to go from one to another production center must be considered.
The addressed problem is similar to the flexible job shop problem, in which there is a set of
work centers that groups identical machines operating concurrently; inside a work center, a
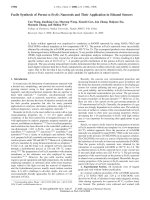
task may be executed by any of the machines available [10]. Figure 3 depicts an example of
adapting the flexible job shop to the addressed problem. In this figure, three products are
made: Product 1 requires tasks T
11
, T
12
, T
13
, T
14
, T
15
and T
16
; Product 2 requires tasks T
21
, T
Recent Advances on Meta-Heuristics and Their Application to Real Scenarios4
22
, T
23
, T
25
and T
26
; Product 3 requires tasks T
31
, T
32
, T
33
, T
34
and T
36
. All tasks are distribut‐
ed among production centers C
1
, C
2
, C
3
, C
4
and C
5
.
In Figure 3 the problem is divided into 2 subproblems: A and B. At subproblem A the tasks
are distributed among the production centers that can execute them. At this step is impor‐
tant to prioritize internal production centers in order to take profit of the company process‐
ing power that is already available. At subproblem B the tasks must be scheduled respecting
the precedence order of tasks.
Production Centers
C3
C4
C1
C2
C5
1 2
Products
Subproblem A
Subproblem A - Choice of production center.
Subproblem B - Organization of tasks.
S
t
e
p
s
3
6 - Finishing
5 - Laundry
1 - Scratch
2 - Cut
3 - Sewing
4 - Embroidery
T11 T21 T31
T12 T22 T32
T13 T23 T33
T14 T34
T15 T25
T16 T26 T36
T11
T31
T12
T22
T32
T13
T23 T33
T14
T34
T15
T25
T16
T26 T36
Subproblem B
T21
Figure 3. Task distribution among the production centers.
Figure 4(1) depicts an example of scheduling for the tasks listed in Figure 3. Note that
the precedence relation among tasks is respected, that is, a task T
ij
, where i means the
product to be made and j the production stage, can be started only after all tasks T
ik
(k
< j) have been finished. The Figure 4(2) shows the downtime (gray arrows) in the pro‐
duction centers. For instance, task T
13
at production center C
5
waits for the task T
12
at
C
3
before starts executing. Figure 4(3) shows that the tasks T
25
and T
31
at production
center C
1
and T
38
at C
5
(black boxes) were ready but had to be frozen because of the
unavailability of the production centers C
1
and C
5
.
Using Multiobjective Genetic Algorithm and Multicriteria Analysis for the Production…
/>5
(1) (2) (3)
Tim e
C3
C2
C5
C1
C4
T11
T21 T31
T12
T22
T32
T13
T23 T33
T14
T34
T15
T25
T16
T26 T36
Tim e
C3
C2
C5
C1
C4
T11
T21
T12
T22
T32
T13
T23 T33
T14
T34
T15
T16
T26
Tim e
C3
C2
C5
C1
C4
T11
T21 T31
T12
T22
T32
T13
T23 T33
T14
T34
T15
T25
T16
T26 T36
Figure 4. Example of tasks scheduling.
The addressed problem is similar to some works found in the literature, like Senthilkumar
and Narayanan [11], Santosa, Budiman and Wiratino [12], Abdelmaguid [13], Dayou, Pu
and Ji [14], Chang and Chyu [15] and Franco [16]. However, these works do not consider
real-time tasks sequencing or are not applied to real problems.
It is important to note that the chronoanalysis method used here is not the focus of this
work. However, in this work, the production time includes tolerance, rhythm and others
variables from the chronoanalysis.
2.1. Mathematical modeling
For this modeling was created a sequencing unit (SU) which defines a time-slice of work.
Each production center has distinct sequencing units, in which tasks are scheduled all day
long. Figure 5 depicts a set of sequencing units that describes the behavior of a particular
production center. The overtime work is treated as a distinct sequencing unit, since they
have particular features like cost.
12
13
14 15 16 17 187
19
8 209 10 11
Hours a day
Center A
Sequencing Units
SU1 SU2 SU3 SU4 SU5 SU6
Worked Hours
Daily Stops
Scheduled Stops
O vertim e
Figure 5. Sequencing units organization.
Recent Advances on Meta-Heuristics and Their Application to Real Scenarios6
This model defines a variable N that indicates the total number of tasks, including an addi‐
tional task that is required for the initialization of the sequencing units.
Below is presented the mixed integer programming model for the addressed problem. The
parameters of the problem are presented, followed by the interval indexes, the decision vari‐
ables and finally by the equations for the three objective functions together with their con‐
straints.
Parameters
NCP – Number of production centers.
NSU – Number of sequencing units.
NJ – Number of tasks to be scheduled.
N – Total number of tasks (N = NJ + 1). The last one is the fictitious task that was added to
the model as the initial task of every sequencing unit.
M – Large enough value.
WL
i
– Workload of task i.
CP
s
– Production center of the sequencing unit s.
Minimum
s
– Starting time of the sequencing unit s.
Time
s
– Amount of time available at sequencing unit s.
CPJ
i
– Set of production centers that can execute the task i.
CI – Set of internal production centers.
PRE
i
– Set of tasks that are a precondition for the execution of task i.
OffSet
c
k
c
l
– Time for going from production center c
k
to c
l
.
Indexes
i, j – Indexes of tasks. i, j ∈ [1, N].
c – Index of production centers. c ∈ [1, NCP].
s – Indexes of sequencing units. s ∈ [1, NSU].
Decision variables
Start
i
– Non-negative linear variable that represents the starting time of task i.
End
i
– Non-negative linear variable that represents the ending time of task i.
WLS
si
– Non-negative linear variable that represents the workload of task i at the sequencing
unit s.
StartS
si
– Non-negative linear variable that represents the starting time of task i at sequenc‐
ing unit s.
Using Multiobjective Genetic Algorithm and Multicriteria Analysis for the Production…
/>7
DT
sij
– Non-negative linear variable that represents the downtime between tasks i and j in
the sequencing unit s.
Y
sij
– Non-negative linear variable that represents the flow i, j of the sequencing unit s.
MkSpan – Non-negative linear variable that represents the time between the end of the last
finished task and the start of the first task.
IntTime – Non-negative linear variable that represents the amount of execution time of tasks
in the internal production centers.
DownTime – Non-negative linear variable that represents the amount of internal production
centers downtime.
Z
ci
=
{
1 if task i is allocated to production center c.
0 otherwise
U
si
=
{
1 if task i is allocated to sequencing unit s.
0 otherwise
X
sij
=
{
1 if the sequence i, j happens in the sequencing unit s.
0 otherwise
Model
. .1 Min MO F kSpan=
(1)
. .2 Max InO F tTime=
(2)
. .3 Min DowO F nTime=
(3)
Subject to:
/
i
MkSpan End i i N³ "¹
(4)
//
s
si
s CP CI i i N
IntTim e WLS
ι
=
åå
(5)
//
s
sij
s CP CI i j j N
DownTime DT
ι
=
å åå
(6)
( ) (1 )
sij sj si si sij
DT StartS StartS WLS M X³ - + - ´-
(7)
/ /,
,/
si si
sij sji sj s j
i CP CPJ i i N CP CPJ
Y Y U s j j N and CP CPJ
Î ¹Î
- = "" ¹ Î
åå
(8)
Recent Advances on Meta-Heuristics and Their Application to Real Scenarios8
,/ ,/
sij sij s i s j
Y M X s i CP CPJ j j N and CP CPJ£ ´ "" Î " ¹ Î
(9)
1
sN
Us= "
(10)
/
1/
i
ci
c c CPJ
Z ii N
Î
="¹
å
(11)
/
1
si
si
s CP CPJ
Ui
Î
³"
å
(12)
,/ ,
si ci s i s
U Z i s CP CPJ c CP£ "" Î =
(13)
/
,/
si
sij sj s j
i CP CPJ
X U s j j Nand CP CPJ
Î
= "" ¹ Î
å
(14)
/,
,/
sj
sij si
j j N CP CPJ
X U s ii N
¹Î
£ "" ¹
å
(15)
/ ,/
si s si s i
StartS Minimum U s CP CPJ i i N³ ´ " Î "¹
(16)
(1 ) , /
si si s s si s i
StartS WLS Minimim Time M U s i i N and CP CPJ+ £ + + ´ - "" ¹ Î
(17)
/,
*,
s si
si ci ci
s CP c CP CPJ
WLS WL Z i c
= Î
= ""
å
(18)
/,
si si s i
WLS M U s CP CPJ i£´ " Î "
(19)
(1 ) / ,
i si si s i
Start StartS M U s CP CPJ i£ + ´- " Î "
(20)
(1 ) / ,
i si si si s i
End StartS WLS M U s CP CPJ i£ + - ´- " Î "
(21)
/
ii
End Start i i N³ "¹
(22)
(1 ) , / , /
sj si si sij s i s j
StartS StartS WLS M X s i CP CPS j j N and CP CPJ³ + - ´ - "" Î " ¹ Î
(23)
12 1 2
12 1 2
(2 ) , ,/ ,/ ,
j i cc ci c j i j j
Start End OffSet M Z Z c c i i N and c CPJ j j N i PRE and c CPJ³ + - ´- - """ ¹ Î " ¹ Î Î
(24)
Using Multiobjective Genetic Algorithm and Multicriteria Analysis for the Production…
/>9
Where:
1. Objective function that aims to minimize the total production time (makespan).
2. Objective function that aims to maximize the use of internal production centers.
3. Objective function that aims to minimize the amount of downtime at the internal pro‐
duction centers.
4. The makespan can be seen as the ending time of the last task.
5. The amount of execution time at the internal production centers.
6. The amount of downtime at the internal production centers.
7. The amount of downtime between tasks i and j in the sequencing unit s.
8. Constrains the flow between tasks i and j.
9. X
sij
= 1 if there is a flow from task i to task j at the sequencing unit s.
10. Asserts that task N belongs to every sequencing unit.
11. Asserts that each task is executed on just one production center.
12. Asserts that each task is executed on at least one sequencing unit.
13. Asserts that a task i can only be executed on a sequencing unit s if the task i is scheduled
to the production center of the sequencing unit s.
14. If the task j is performed in sequencing unit s then there is just one task that immediate‐
ly precedes j in s.
15. If the task j is performed in sequencing unit s then there is at most one task that is im‐
mediately preceded by j in s.
16. Asserts that each task i must be started only after the start of the sequencing unit s
where task i is allocated.
17. Asserts that the maximum available time of the sequencing unit is being respected.
18. Asserts that the required workload of task i is allocated.
19. Asserts that the workload of task i at the sequencing unit s is 0 (zero) if task i is not
scheduled to the sequencing unit s.
20. Asserts that the beginning time of task i, Start
i
, must be lower or equal to the beginning
time of task i at any sequencing unit where it is allocated.
21. Asserts that the ending time of task i, End
i
, must be greater or equal to the ending time
of task i at any sequencing unit where it is allocated.
22. Asserts that the ending time of task i must be at least equal to its beginning.
23. Asserts that the task i starts only after the ending time of the task j that immediately
precedes i in the sequencing unit s.
Recent Advances on Meta-Heuristics and Their Application to Real Scenarios10
24. Asserts that task j only can starts after the ending time of its predecessor tasks. This re‐
striction takes into account the travel time between the production centers.
3. Proposed method
We propose in this work a method that combines multiobjective genetic algorithm and mul‐
ticriteria decision analysis for solving the addressed problem. The multiobjective genetic al‐
gorithm (MGA) aims to find a good approximation of the efficient solution set, considering
the three objectives of the problem. A multicriteria decision analysis method is applied on
the solution set obtained by the MGA in order to choose one solution, which will be used by
the analyzed garment company.
Deb [4] presents a list of evolutionary algorithms for solving problems with multiple objec‐
tives: Vector Evaluated GA (VEGA); Lexicographic Ordering GA; Vector Optimized Evolution
Strategy (VOES); Weight-Based GA (WBGA); Multiple Objective GA (MOGA); Niched Pareto GA
(NPGA, NPGA 2); Non dominated Sorting GA (NSGA, NSGA-II); Distance-based Pareto GA
(DPGA); Thermodynamical GA (TDGA); Strength Pareto Evolutionary Algorithm (SPEA, SPEA
2); Mult-Objective Messy GA (MOMGA-I, II, III); Pareto Archived ES (PAES); Pareto Envelope-
based Selection Algorithm (PESA, PESA II); Micro GA-MOEA (µGA, µGA2); and Multi-Objec‐
tive Bayesian Optimization Algorithm (mBOA).
In this work, we have chosen the NSGA-II [17] evolutionary algorithm since it works with
any number of objectives, which can be easily added or removed. This feature facilitates the
company to adapt to the market demands – the current objectives may not be sufficient in
the future, requiring the company to also focus on other goals –. Besides, there are another
Brazilian garment companies interested in using the proposed method, which may have dif‐
ferent objectives.
The main methods of multicriteria decision analysis are [18]: Weighted Sum Model, Condor‐
cet method, analytic hierarchic process, ELECTRE methods, Promethee method and Mac‐
Beth method.
The Weighted Sum Model – WSM is used in this work due to its simplicity and, mainly, due
to its structure of candidates and voters. In this work, WSM performs as a decision maker by
considering each solution returned by the MGA as a candidate and each objective of the
problem as a voter.
The method proposed in this work is detailed in Section 3.2. But first, in Section 3.1, we de‐
scribe the multiobjective combinatorial optimization, in order to facilitate the understanding
of the proposed method.
3.1. Multiobjective combinatorial optimization
According to Arroyo [19], a Multiobjective Combinatorial Optimization (MOCO) problem
consists of minimizing (or maximizing) a set of objectives while satisfying a set of con‐
Using Multiobjective Genetic Algorithm and Multicriteria Analysis for the Production…
/>11
straints. In a MOCO problem, there is no single solution that optimizes each objective, but a
set of efficient solutions in such way that no solution can be considered better than another
solution for all objectives.
Among the different ways of defining an optimal solution for MOCO problems, Pitombeira
[20] highlights the method proposed by the economist Vilfredo Pareto in the nineteenth cen‐
tury, which introduces the dominance concept. He argues that an optimal solution for a
MOCO problem must have a balance between the different objective functions, so that the
attempt of improving the value of one function implies the worsening of one or more of the
others. This concept is called Pareto optimal.
MOCO aims to find the Pareto optimal set (also known as Pareto frontier) or the best approxi‐
mation of it. However, it is necessary to define a binary relationship called Pareto dominance:
a solution x
1
dominates another solution x
2
if the functional values of x
1
are better than or
equal to the functional values of x
2
and at least one of the functional values of x
1
is strictly
better than the functional value of x
2
[4]. The Pareto optimal set consists of all non-dominat‐
ed solutions of the search space.
Deb [4] says that in addition to finding a solution set near to the Pareto frontier, it is necessa‐
ry that these solutions are well distributed, which allows a broader coverage of the search
space. This fact facilitates the decision making, because, regardless of the weight assigned to
each criterion, a quality solution will be chosen.
3.2. Multiobjective genetic algorithm proposed
As we have already mentioned, the model adopted for the development of the multiobjec‐
tive genetic algorithm (MGA) proposed is the NSGA-II. According to Deb [4], it is an elitist
search procedure, which preserves the dominant solutions through the generations. The
process starts by building a population (P), with nPop individuals (solutions). The popula‐
tions of the next generations are obtained through the application of mutation, selection and
crossover operators. The purpose is to find a diversified solution set near to the Pareto fron‐
tier. With the crowding distance [4], we can qualify the space around the solution, allowing a
greater diversity of the solution set and, thereby, leading more quickly to a highest quality
solution. The crowding distance (d) of an individual in the i
th
position of the population P,
considering r objectives, is given by Equation 25, where f
k
min
and f
k
max
represent, respective‐
ly, the minimum and maximum values in P for the objective function f
k
(1 ≤ k ≤ r). For any
solution set, the solution that brings the highest level of diversity is the one with the greatest
crowding distance.
( 1) ( 1)
( 1) ( 1) ( 1) ( 1)
11 22
max min max min max min
11 22
ii
ii ii
rr
i
rr
ff
ff ff
d
ff ff ff
+-
+- +-
-
= + ++
-
(25)
Section 3.2.1 presents the solution representation used in this work. The steps done by the
MGA proposed, from the building of the initial population to the choice of the solution to be
used by the analyzed garment company, is detailed in Section 3.2.2.
Recent Advances on Meta-Heuristics and Their Application to Real Scenarios12
3.2.1. Solution representation
The solution (individual) is represented by two integer arrays: priorities array and produc‐
tion centers array. Tasks are represented by the indexes of both arrays. The priorities array
defines the allocation sequence of the tasks and the production centers array indicates the
production center responsible for the execution of each task. Figure 6 depicts an example of
the solution representation used in this work, in which the first task to be allocated is the
task 3 – represented by the position (index) with value 1 in the priorities array – and the pro‐
duction center responsible by its execution is the production center 3 – value of the position
3 of the production centers array –; the second task to be allocated is the task 7, which will
be executed in the production center 5; and so on. This representation is based on the repre‐
sentations described in [14] [21] [22] and [23].
Priorities array
1
7
1
2
4
1
3
1
3
4
8
2
5
10
1
6
3
2
7
2
5
8
5
2
9
9
6
10
6
5
Index of tasks
Production centers array
Figure 6. Solution representation.
A task T
i
can only start after the end of the predecessor task T
j
plus the travel time from the
production center responsible by T
i
to the production center responsible by T
j
. Thus, when
a task is selected to be allocated, a recursive search is done in order to allocate the predeces‐
sor tasks of it.
3.2.2. Population evolution
The MGA proposed is described by the flowchart of Figure 7, which starts by building the
initial population and finalizes when the stop criterion is reached. Mutation, selection and
crossover genetic operators are applied in the current population in order to build new indi‐
viduals (offsprings). At the end of each generation, the less evolved individuals are eliminat‐
ed and the evolutionary process continues with the best individuals.
Step 1 – Building the initial population
Two arrays of size N are created for each individual, where N is the number of tasks to be allo‐
cated. The priorities array stores the allocation sequence and the production centers array de‐
termines the production center responsible for each task. These arrays are randomly created.
Step 2 – Generating the offspring population
An offspring population, P
aux
, with nPop individuals is created from P, using the tourna‐
ment selection method [24] and mutation and crossover genetic operators. The tournament
method used in this work randomly selects four individuals from P and the best two are se‐
lected as the parent individuals to be used by the crossover operator.
Using Multiobjective Genetic Algorithm and Multicriteria Analysis for the Production…
/>13
Recent Advances on Meta-Heuristics and their Application to Real Scenarios
13
which will be executed in the production center 5; and so on. This representation is based on 1
the representations described in [14] [21] [22] and [23]. 2
3
Fig. 6. Solution representation. 4
A task T
i
can only start after the end of the predecessor task T
j
plus the travel time from the 5
production center responsible by T
i
to the production center responsible by T
j
. Thus, when a 6
task is selected to be allocated, a recursive search is done in order to allocate the predecessor 7
tasks of it. 8
3.2.2. Population evolution 9
The MGA proposed is described by the flowchart of Figure 7, which starts by building the 10
initial population and finalizes when the stop criterion is reached. Mutation, selection and 11
crossover genetic operators are applied in the current population in order to build new 12
individuals (offsprings). At the end of each generation, the less evolved individuals are 13
eliminated and the evolutionary process continues with the best individuals. 14
15
Fig. 7. NSGA-II algorithm. 16
Step 1 – Building the initial population 17
Two arrays of size N are created for each individual, where N is the number of tasks to be 18
allocated. The priorities array stores the allocation sequence and the production centers 19
array determines the production center responsible for each task. These arrays are randomly 20
created. 21
Step 2 – Generating the offspring population 22
An offspring population, P
aux
, with nPop individuals is created from P, using the tournament 23
selection method [24] and mutation and crossover genetic operators. The tournament 24
Priorities array
1
7
1
2
4
1
3
1
3
4
8
2
5
10
1
6
3
2
7
2
5
8
5
2
9
9
6
10
6
5
Index of tasks
Production centers array
Yes
Not
Step 2 -
Generate a new population of offspring, , based on
aux
Step 3 - Evaluate, group and sort by dominance and crowding
P
aux
Step 4 -Select by elitismnPop
individuals
Step 5 - Select the best individual
Stop criterion reached?
P
P
P
Step 1 -
Generate the initial population
Figure 7. NSGA-II algorithm.
The crossover operator used in this work is based on the variable one-point cut operator
[24]. Figure 8 depicts examples of the crossover (8a and 8b) and mutation (8c and 8d) opera‐
tors developed in this work. As can been seen in Figure 8(a), the priorities array of the off‐
spring individual is composed by the genes of the priorities array of the parent individual
Parent
1
until the cut-point and, from this point, it is composed by the remaining priorities in
the order that they appear in the priorities array of the parent individual Parent
2
. In the pro‐
duction centers array, the crossover method is applied by using the same cut-point and the
production centers array of the offspring individual is composed by the genes of the produc‐
tion centers array of the parent individual Parent
1
until the cut-point and, from this point, it
is composed by the genes of the production centers array of the parent individual Parent
2
, as
can be visualized in Figure 8(b).
The mutation operator is applied at the priorities array as shown in Figure 8(c), where two
genes are randomly selected and their contents are exchanged. The mutation operator acts
in the production center array as shown in Figure 8(d), where a gene (position i) is randomly
selected and replaced by another production center capable of execute the task i. This pro‐
duction center is randomly chosen. The mutation operator is performed on 5% of the genes
of each offspring individual generated by the crossover operator.
Step 3 – Evaluation, sorting and grouping of individuals by dominance and crowding dis‐
tance
The offspring population P
aux
is added to the population P, defining a new population of
2×nPop individuals – nPop individuals from P and nPop individuals from P
aux
–. It is sorted
in ascending order by the dominance level
4
. The crowding distance is used as a tie-breaker,
i.e., when two individuals have the same dominance level, it is chosen the one with the
greatest crowding distance.
4 The dominance level of an individual x is the number of individuals in the population that dominates x; for example,
an individual dominated by only one individual in the population has dominance level of 1.
Recent Advances on Meta-Heuristics and Their Application to Real Scenarios14
Step 4 – Selection of individuals by elitism
The nPop best individuals from the new population (P
aux
added to P) are selected to contin‐
ue the evolutionary process, while the others are discarded.
Step 5 – Selection of the best individual
At the end of the evolutionary process, the MGA returns a set of individuals with domi‐
nance level of 0 (zero), that is, individuals of the current population that no other individual
dominates. This set of individuals represents an approximation of the Pareto frontier.
The Weight Sum Model (WSM) [25] multicriteria decision method is applied for choosing a
solution from the set returned by the MGA that will be used by the analyzed garment com‐
pany. In the WSM method, the candidates are ranked by the preferences of the decision
maker, in which the best candidate for a particular preference receives 1 (one) point, the sec‐
ond one receives 2 (two) points, and so on. The points received for each preference are sum‐
med, and the best candidate is the one with the smallest sum.
Parent
1
Cut-point
( a )
( c )
Before
After
7
7
7
7
9
4
4
4
4
7
1
1
1
1
2
8
8
8
8
3
10
10
10
10
8
3
3
3
9
1
2
2
2
2
4
5
5
5
3
6
9
9
9
6
10
6
5
5
Mutation – priorities array
Crossover – priorities array
Parent
2
Offspring
Selected genes
1
1
Parent
1
Cut-point
( b )
7
7
9
4
4
7
1
1
2
8
8
3
10
10
8
3
1
1
2
4
4
5
6
6
9
10
10
6
5
5
Crossover – production centers array
Parent
2
Offspring
( d )
Before
After
1
1
1
1
3
7
2
2
1
1
2
2
5
5
2
2
6
6
5
5
Mutation – production centers array
Production centers capable of
performing the task {3,7,9,12}
Figure 8. Genetic operators of crossover and mutation.
In this work, the WSM method replaces the grade given by the voters to the candidates.
This replacement ranks each solution returned by the MGA according to each objective.
Figure 9 illustrates the use of the WSM method in this work where four solutions (col‐
umns) must be evaluated according to three objectives (rows). For the first objective, to
Using Multiobjective Genetic Algorithm and Multicriteria Analysis for the Production…
/>15
minimize the total production time (makespan), the solution 3 has the best value, obtain‐
ing the rank 1; the solution 4 has the best second value, obtaining the rank 2; and the
solutions 1 and 2 obtain, respectively, the ranks 3 and 4. The same ranking is done for
the others objectives. After summing the rank obtained for each objective, the solution 1
is chosen because it has the smallest sum.
4. Computational results
All computational experiments were performed on a Dell Vostro 3700 notebook with 1.73
GHz Intel Core I7 processor and 6 Gbytes of RAM memory.
The computation experiments regard to real data that represent the May 2012 production
demand of the analyzed company: 567 products, 1511 production orders, 3937 tasks and 181
production centers.
Makespan
O
b
j
e
c
t
i
v
e
s
Individuals
External centers
Internal centers downtime
Winner
3
1
6
1
2
4
2
7
2
1
1
3
8
4
3
2
4
9
3
4
Figure 9. Weighted sum model.
In the experiments, 12 hours of execution time was established as the stop criterion of the
genetic algorithm. This value was defined because it represents the available time between
two work days. The population size (nPop) and the mutation rate (tx) were empirically set at
nPop=200 individuals and tx=5%.
In the first experiment, we compare the results of the proposed method with the results
manually obtained by the analyzed company at May 2011. Figure 10 depicts the production
deviation of each stage between May 2011 and May 2012, where we can note an increase of
the production at almost all stages.
Recent Advances on Meta-Heuristics and Their Application to Real Scenarios16
Figure 10. Production deviation of each stage (May 2011 x May 2012).
The results obtained by the analyzed company at May 2011 were: 42 production days to exe‐
cute all tasks; 20% of the tasks were performed in internal production centers; and the
downtime rate of the internal production centers was 37%.
In this experiment, five runs of the proposed method were done, obtaining the following
average results: 36 production days to execute all tasks; 32% of the tasks were performed in
internal production centers; and the downtime rate of the internal production centers was
16%. It is worth to mention that the worst results obtained are: 38 production days to exe‐
cute all tasks; 35% of the tasks were performed in internal production centers; and the
downtime rate of the internal production centers was 18%. The obtained results were better
than the ones manually got at May 2011, even considering the increase of the production be‐
tween May 2011 and May 2012 (see Figure 10).
We mean “selected solution” as the solution (individual) of the population of generation g
that would be returned by the proposed method if the genetic algorithm ended at genera‐
tion g. Figures 11, 12 and 13 depict the obtained values for each objective of the selected sol‐
utions during 12 hours of execution. In these figures are also used the average results
obtained after five runs of the proposed method. We can note that only after 8 hours we can
get a good solution - about 40 production days, between 15 and 35% of the tasks performed
in internal production centers and downtime rate of internal production centers near to 18%.
We highlight that the genetic algorithm parameters were adjusted considering an execution
time of 12 hours. A genetic algorithm (GA) that works with a large population takes longer
to found a good solution than a GA with a small population. However, it explores a larger
solution space, thus obtaining better solutions. If a smaller execution time is required for
running the proposed method, we should adjust the GA parameters in order to find good
quality solutions.
Using Multiobjective Genetic Algorithm and Multicriteria Analysis for the Production…
/>17