The impact of water pollution on the socio-economic status of the stakeholders of Ennore Creek, Bay of Bengal (India) docx
Bạn đang xem bản rút gọn của tài liệu. Xem và tải ngay bản đầy đủ của tài liệu tại đây (878.11 KB, 14 trang )
Indian Journal of Science and Technology Vol.2 No 3 (Mar. 2009) ISSN: 0974- 6846
Edu.Sust. Devpt. “Ennore creek” Shanthi & Gajendran
Indian Society for Education and Environment (iSee) Indian J.Sci.Technol.
66
The impact of water pollution on the socio-economic status of the stakeholders of Ennore Creek,
Bay of Bengal (India): Part I
V.Shanthi
1
and N. Gajendran
2
University of Madras,
1
Dept. of Economics, Chellammal Women’s College, Guindy, Chennai-600 005, India.
2
C.A.S. in Botany, University of Madras, Chennai-25.
The holistic nature of human ecology is the study of
human social systems in relation to the total environment
(UNESCO, 1979). Its aim is to understand the pattern of
the interactions between different human situations to
formulate prudent and effective policies for the future. At
the root of human ecology lie two fundamental concerns:
the concern for integrity of the ecosystems of the
biosphere on which mankind’s existence depends and
the concern for the health and well being of the people.
Coastal area is the confluence point of the natural
land based nutrients and the salt based oceans. Coastal
water provides livelihood and also serves as treasure for
genetic stock. Coastal zone occupies 10 % of the marine
area and produces 90 % of total marine food. Coastline
provides seat for atomic and thermal power generations.
Optimum benefit of the coastal water can be achieved by
preserving its natural integrity under unpolluted
atmosphere. It is essential to bring about a joint
management of enforcing agencies of environmental
loss, industrial agencies causing environment pollution
and users of natural resources of the coastal areas. The
concept behind this approach is to evolve eco-
environmental friendly strategies with a participatory
approach of all concerned. Man and the Bio-sphere
Project 11-considers the ecological aspects of urban
systems including water (UNESCO, 1979).
The coastal zone is generally viewed as common
resources available to all. The multiplicity of uses of the
coast and coastal waters are for industry, transport,
recreation, mariculture and fish production and also the
source for non-living resources. The pollution abatement
is the prime concern of everybody involved with the
coastal resources. The central problem in this study of
environmental economics is an understanding of the
coastal resources wherein the society exerts pressure
and also to evolve strategy for use of such resources
economically. Humans use a wide variety of marine
organisms for food, medicines, raw materials, pets and
curios. Coastal resources are valuable natural
endowments that need to be sustainably managed for
present and future generation. Owing to the complexity of
the consequences, the enforcing agencies need
appropriate understandings on ecological balance,
environmental constraints, social conflicts and economic
efficiency.
The fishing community is the link between the sea
and land and adapted to the ecological niche. Through
generations of interactions with the sea and nature, fisher
folks have acquired skill in protecting, preserving and
using the ecosystems sustainable. They developed a
variety of technologies tailored to the specific ecological
niches along the coast. Dislocating or displacing them for
industrial development will totally upset their livelihood,
social structure and economic welfare leading to
perennial conflicts and tensions. Hence, the eco-studies
of the indigenous people are the need of the hour. It is not
only physical environmental impact but also the social
impacts of developmental interventions need to be
assessed.
Of late, the coastal ecosystems are highly degraded
due to high population and industrial growth (Glasby &
Roonwal, 1995; UNEP, 1997). Due to various pollutions
including pesticide poisoning (Sen Gupta
et al
., 1990),
over exploitation of water resources by power plant
industries and the municipal uses and encroachment for
urban developments force the fishing community to the
brink of disappearance. When those natural resources
are imperilled, so too are the livelihoods of the many
people who live and work there. The environmental abuse
and the negligence of the governing body make the
matter worse (Sreenivasan & Franklin, 1975). The
severity of water pollution of Ennore Creek and its coastal
areas makes the ecosystem unsustainable in which some
rare fishes and plants ultimately thrive (NEERI Report,
1995). The affected fishing communities start migrating to
other places for want of a suitable environment in order to
improve their economic status. Together they deteriorate
the skills for the optimal utilisation of coastal resources in
tune with the nature. Thus, the guards of coastal
ecosystem tend to disappear from the scene of
sustainable marine resource utilisation only leaving the
fragile resources at the mercy of profit centered industries
with environmental ignorance.
India has an extensive coastline of nearly 7,527 km
and vast exclusive economic zone (EEZ). It contributes
about 46 per cent of total exploitable living resources of
Indian Ocean. Current approaches to the management of
coastal resources are not capable of sustainable
development and the coastal environments and
resources are being rapidly degraded and eroded in India
(Ramachandran, 2001).
The State of Tamil Nadu is cherished with 950 km
long coastline with Pulicat Lake in the north and
Kanyakumari in the south. Chennai, which is the capital
city of Tamil Nadu, is subjected to industrial development
and population explosion. Environmental degradation is
the major concern and the coastal pollution is expected to
be most significant as the coastal area of the city (~ 75
kms) stretching between with Ennore Power Plant, and
sprinkled with Manali Industrial Complex in the north and
Madras Atomic Power Plants I and II in the south. The
coastal belt is subjected to all kinds of anthropogenic
Indian Journal of Science and Technology Vol.2 No 3 (Mar. 2009) ISSN: 0974- 6846
Edu.Sust. Devpt. “Ennore creek” Shanthi & Gajendran
Indian Society for Education and Environment (iSee) Indian J.Sci.Technol.
67
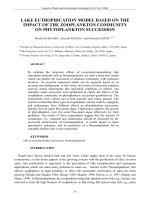
Fig.1 Location map and study area (Ennore Creek
)
pressure. Owing to its ecological importance the narrow
belt forms critical study area for environmental economist,
policy makers and environmental health watch group.
The creeks are comparatively less along Tamil Nadu
coast and the analysis of LandSat and Thematic Mapper
data of April 1983 and December 1983 shows that the
'creeks are dynamically changing due to the seasonal
variations. The study of Ennore and Kovalam creeks are
also dynamically changing during the southwest
monsoon and suffer excessive sedimentation during this
period. The already exiting Jetties near Kalpakkam and
Madras harbour cause excessive sedimentation near
the Kovalam creeks and Ennore creeks. In the Pulicat
backwater, the mouth is silted much (Durariraj, 1988;
Manivel
et al
., 1995).
Ennore creek was once the paradise for mangroves,
reptiles, turtles and rare fishes. The study area is not only
the nature’s gift but also a source for sustaining the
traditional fishermen community settled in this Creek
(Jayaprakash, 2003, Jayaprakash
et al
., 2005). The
Creek, situated in between the Kourtaliar river (fresh
water source) and the Bay of Bengal is intercepted by
Buckingham canal (tidal water body) and has been
supporting the livelihood of many thousands of fishing
families who are the original stakeholders settled in the
nearby villages. Thus, the unique physical landscape and
marshes of Ennore Creek are covered by fresh water and
salt water which provides a rich supply of food that
supports a large variety of animal and plant life
(Suriyanarayana Moorthy & Mohammed Habibullah,
2001). This estuary formed a good source of fisheries,
particularly of mullets and prawns. Studies on the
hydrobiology and fisheries of this water area are therefore
being pursued regularly at the fisheries biological station
at Ennore. At present, the coastal pollution endangers
Ennore Creek by all means.
Ecologically, Ennore Creek is the most strategic
place where many industries started mushrooming in and
around the creek in the late 1970s led to meristamatic
growth affecting the fishing community (Arunagiri
et al
.,
1998). The environmental degradation of the Ennore
Creek is structurally different from the problem of
pollution of the metropolitan city of Chennai. This narrow
creek is one among the most polluted creeks along the
Eastern Coast, which is not only receiving worldwide
attention, but also one of the areas demanding intensive
research. The ecologically sensitive Ennore is
surrounded by the water body of Pulicat Lake in the
northern boundary of Tamil Nadu, realizing the quantum
of flow occurring in this region, the Buckingham canal
was constructed to connect Northern coast line of
Chennai City with its Southern coastline. The biodiversity
of this study area and the people who depend on them
was once inseparably embedded with the ecosystem
(Sanjeeva Raj; CReNIEO p.1). However, at present they
have been separated by the effluents of industries
leading to the degradation of the bio-diversity and
impoverishing livelihood and hygienic conditions of the
fishing community.
The high pollution load in Ennore Creek has
drastically changed the ecosystem (Jayapaul Azariah
et
al
., 1997). The recent construction of Ennore satellite port
is changing the coastal morphology in and around the
Ennore area. Ennore creek is placed on the eco-
pathological time bomb and the ecological jewel is
running short of time for redemption. A scientific
approach is needed to understand the complexity of the
degradation and also to evolve a suitable strategy to
Indian Journal of Science and Technology Vol.2 No 3 (Mar. 2009) ISSN: 0974- 6846
Edu.Sust. Devpt. “Ennore creek” Shanthi & Gajendran
Indian Society for Education and Environment (iSee) Indian J.Sci.Technol.
68
preserve the ecological treasure, the ecological pathology
of Ennore deserves for immediate attention.
Statement of the problem
Ennore Creek becomes the pollution point in Bay of
Bengal which influences the marine resources and
productivity of the region. This coastal belt in the
neighboring areas of the city is viewed as dumping sites
for industrial effluents and disposing domestic waste
(Arunagiri
et al
., 1998). The natural wealth of the creek is
now being eroded to mere sewage channel
(Jayaprakash, 2003).
The Ennore Thermal Power Plant uses the river waters
as coolant and lets out the warm water, in the Ennore
Creek. Extensive deposition of sand bar is taking place in
the mouth of the creek and the northern surrounding region
of the coastal sites (Kee-Chai-Chang, 2000). The
discharge of the hot coolant water and flyash has
created an algal bloom, which gets entangled with
fishing nets and damages them. The hot cooler water
from the plant discharged into the Buckingham Canal
where the discharges enter the sea there is no sign of
marine life (Sanjeevaraj, 2001).
The Central Pollution Control Board in collaboration
with State Pollution Control Board identified Manali at the
Ennore Industrial complex as one of the problem area in
the country. There is an immediate danger of breaking
the homeostasis due to the over loading pollutants
spewing out continuously from Manali industrial
complexes and Ennore Thermal Power stations (SPIC-
SMO, 1990). Ennore Creek is placed on the eco-
pathological time bomb and the ecological jewel is
running short of time for redemption. The stakeholders of
these common property resources have been facing
problems in the wake of increasing anthropogenic
pollution. Particularly, the fisher folks, the engineering
force of transforming the aquatic productivity into
sustainable protein food for malnourished people, are
facing fish shortage and health hazards. The
economically handicapped fisher folks are slowly
poisoned maimed and are marching steadily towards the
economic death trap. The once rich ecological site is the
answer for various vexing questions in the realm of
ecology, pollution, industrialisation, fishing community
and the struggle of economic planners for sustainability.
Scope of the study
The area of the study is the Ennore Creek which is
situated close to the northern boundary of Chennai City.
Ennore Creek traditionally influences the livelihood of the
stakeholders inhabited near the creek. A preliminary field
investigations and interactions with local population
indicated the quantum of environmental and health risk
associated with it. The severity of the environmental
degradation of Ennore creek could reflect upon the health
and living conditions of the stakeholders of the area.
There have been several incidents and studies which
indicate pollution induced fish killing and health hazards
among the fisherfolk of Ennore. Many respondents during
preliminary investigations felt that the highly polluted
Ennore Creek spoils the feature of the fishing products.
Some had apprehension about the migration potential of
fishes throughout the belt. There have been
encroachments for new constructions which would
replace traditional fisher folk. There were occasional
strong protests released by fisher folk over the Ennore
Power Plant after witnessing thermal water killing the fish.
The agitations also led to manpower loss and economic
loss. In the back drop of the strong ecological pressure
exerted on the coastal resources particularly on the
livelihood of fishing folk, the study has been undertaken
to examine the socio-economic conditions of fishermen in
Ennore Creek.
Objectives
To understand the socio economic profile of fishing
community and to identify various factors that affect the
coastal environmental health and the livelihood of the
fishing community a survey has been planned. The broad
objective of the study is to examine the socio-economic
conditions of the stakeholders in Ennore Creek; while the
supplementary objectives centered on the analysis of the
impact of water pollution & the creek environment on the
health and income of stakeholders of Ennore Creek.
Hypotheses of the study
1. There is an influence of environmental factors on the
prevalence of disease and the working days lost due to
sickness of the stakeholders in Ennore Creek.
2. There exists a significant reduction in fish yield for
over the years due to environmental degradation of
Ennore Creek, thereby the fisher folks become poorer.
Methodology
The study has been undertaken using both primary
and secondary data. The secondary data have been
received from books, journal, news reports, working
paper and the projects of various research institutions like
Madras Institute of Development Studies, Madras School
of Economics, Tamil Nadu Pollution Control Board,
Central Marine Fisheries Research Institute, Anna
University, National Institute of Ocean Technology,
Department of Fisheries, Zoological Survey of India,
M.S.Swaminathan Research Foundation, Tamil Nadu
Water and Drainage Board, CReNIEO, NEERI, BOB
Programme etc.
The primary data has been collected through field
survey. A questionnaire has been designed to collect a
comprehensive profile of socioeconomic conditions of
households of the fisher folk and their traditional skills.
Since the fishing communities are illiterate, a personal
survey has been conducted and additional information
have been elicited from individuals and groups. The
primary data collected from the field have been
meticulously entered into the computer for processing
and tabulation. Special camps and programmes have
been conducted to bring the hidden skills of the fisher folk
to the fore.
Indian Journal of Science and Technology Vol.2 No 3 (Mar. 2009) ISSN: 0974- 6846
Edu.Sust. Devpt. “Ennore creek” Shanthi & Gajendran
Indian Society for Education and Environment (iSee) Indian J.Sci.Technol.
69
It is observed that the polluted Ennore creek is the
most important reason for the deteriorating living
conditions of the stakeholders. In order to study the socio-
economic impact of water pollution of the Ennore Creek
on the socio-economic status of the stakeholders, it has
been decided to draw 350 sample households from 8
villages located at the banks of Ennore Creek. Thus 350
sample households have been drawn on the basis of the
proportion of total population in the selected villages.
Keeping in view of the nature of the problem, social
and environmental situation and the objectives of the
present study, it has been decided to use descriptive-
diagnostic study. In order to ascertain the inclusiveness
of each area random sampling method has been
adopted. A list of households has been obtained by the
Tamil Nadu Civil Supplies Corporation records. The
interview schedule was considered to be the appropriate
one for the purpose. Then the main instrument used in
collecting the data has been the structured schedule,
which has to be filled through interview schedules. Out of
the 350 schedules administered for the study only 306
schedules have been complete without any errors.
Tools and Methods
The study makes uses of simple ratios, averages and
Correlation Analysis. The elicited data have been
subjected to analysis by using step wise multiple
regression and factor analysis. In order to verify the
impact of water pollution on the socio-economic status of
the stakeholders, a factor analysis model has been run by
taking appropriate descriptive variables.
Limitations
The poor socio-economic conditions of the sample
households are not only due to the water pollution and
the poor environment of the households in the study area
but also there are many other personal and familial
reasons influence their status. But effort has been made
to isolate the socio economic status of households due to
water pollution and poor living environment.
Ennore Creek (Fig.1)
Demography
Ennore Creek is located in Thiruvallur district of Tamil
Nadu with the geographical coordinates of North Latitude
13
o
10’ and East Longitude 80
o
20’. The zone that
surrounds the Ennore comprises lagoons, with salt
marshes and backwaters, which are submerged under
water during high tide and form an arm of the sea with the
opening to the Bay of Bengal at Ennore Creek. The total
area of the creek is 2.25 sq km which lies 20 km away
from Chennai in Northward direction. The creek is nearly
400 m wide and is elongated in northeast- southwest
direction and merges with the backwater bodies. Its north-
south trending channels connecting it to the Pulicat lake
to the north and to the distributaries of Kosasthaliyar
River in the south. The channel, which connects the creek
to Pulicat, is marked as Kosasthaliyar in the Survey of
India Topo sheets. The depth of the creek ranges from 1-
2 m and is shallow near the mouth. The north-western
part merges with the tidal flats. Once the flourished
mangrove swamp is now noticed as degraded patches in
the fringes. The area experiences rainfall mainly from South
East and North West Monsoons. The annual rainfall is about
1200 mm per annum. The temperature ranges from 25
0
C to
40
0
C. The soil is of Loamy and Alluvial types.
Existing studies
The creek once encompassed with rich biodiversity of
vegetation types and associated fauna contribute an
excellent green belt that would be totally wiped out by the
petrochemical complex. Industries pump their effluents
into the Ennore Creek, the natural wealth is eroded to
mere sewage channel and the biological productivity of
the coast has come down (Jayaprakash, 2002). The
recent construction of Ennore satellite port is changing
the coastal morphology in and around the Ennore area
(Kasinathapandian, 2002, 2008). There is a need to
assess the impact of the modern technology and the
market on the health and livelihood of fisher folk. They
can equip themselves with the necessary education and
protective measures (Kee Chai Chang & Roy, 1997).
According to Masilamani
et al
. (1999), heavy economic
loss has been incurred because of the mismanagement
of the coastal water. The various chemicals and physical
method used to control the flora and fauna in cooling
channels of the power plants reduce the precious marine
bio- diversity. As the Ennore thermal power plant uses the
creek water as coolant and lets out the warm water the
sand bar is dredged periodically to keep it open.
Industries at Ennore Creek
The Ennore Industrial Complex is located adjacent to
Manali Industrial Complex. It includes pharmaceuticals,
chemicals, fertilizers; automotive manufacturing unit and
a coal fired thermal electricity station-ETPS. Apart from
this, NCTPS came to existence at a latter stage.
Pharmaceutical and Agro Chemical Division India (ICI)
: It
is a large pharmaceuticals and chemical complex, which
releases liquid effluent with spent chemicals. The
organic constituents of this waste stream are treated in
an activated sludge system and discharged to the sea.
Ennore Thermal Power Station (ETPS)
: Ennore Thermal
Plant generates 420 KLD of trade effluent from
demineralising plant (DM) and 38,400 KLD of trade
effluent as ash slurry. The effluent is treated and
discharged into Buckingham canal. Ash slurry hitherto
pumped into the sea is presently let into ash dykes
constructed in the 230 acres area at 1.25 km western
side of the plant. The unit is pumping seawater at the rate
of 17, 60,000 kiloliters per day for condenser cooling from
Ennore Creek. After condenser cooling, the hot water is
discharged into the creek. In order to reduce the thermal
pollution and also to overcome the difficulty in getting the
cooling water due to sand dune formation at the mouth of
the creek, the unit has a provision for five cooling towers
to recycle the cooling water. The plant also takes sea
water as coolant and discharges hot water back to the
sea. About 8,000 tons of coal is burnt every day when all
Indian Journal of Science and Technology Vol.2 No 3 (Mar. 2009) ISSN: 0974- 6846
Edu.Sust. Devpt. “Ennore creek” Shanthi & Gajendran
Indian Society for Education and Environment (iSee) Indian J.Sci.Technol.
70
units are in service and as this contains about 40 per cent
ash, a total quantity of 3,200 tons of ash has to be
disposed off every day. Fly ash is the major pollutant,
which is captured by the air pollution control system in
slurry form and discharged into the sea. The plant also
takes sea water as coolant and discharges hot water back
to the sea.
North Chennai Thermal Power Station (NCTPS)
: North
Chennai Thermal Power Station generates 55,800 kilo
litter per day (KLD) of trade effluent from DM plant
regeneration, boiler blow-down and ash slurry. Ash slurry
is discharged into ash dykes constructed in an area of
1000 acre. The unit was given consent to discharge
cooling water into sea whereas the unit discharges the
cooling water into Buckingham canal which joins with
Ennore Creek. The fishermen in this area have made a
complaint against the discharge. The Tamil Nadu
Pollution Control Board (TNPCB) has directed the unit to
stop the discharge of cooling water into Buckingham
canal. In this connection, Tamil Nadu Electricity Board
has engaged Central Water and Power Research Station
(CWPRS), Pune for a study (CPCB, 1995). CWPRS has
recommended having open pre cooling channel having
width up to 130m for about 2.5 Km, after flowing through
the existing hot water channel for about 2km, along the
compound wall totalling a distanced of 4.5 km to Ennore
Creek and thereby mixing with the creek water. The
intention was to bring down the thermal pollution.
Manali
The Manali New Town and the Manali Industrial
Complex are part of ‘Manali’, an industrial town adjoining
Ennore Creek both hazardous and non-hazardous
industries are located here. The Manali New Town is
drained by Kosastalayar River while the Manali Industrial
Complex releases the industrial effluents in the
Buckingham Canal. Manali Industrial Complex comprises
about 13 major industrial units of which 8 of them are
classified as large scale industries. Tamil Nadu Pollution
Control Board has classified these industries as Red
Industries. It includes crude oil refinery, petrochemical,
heavy chemical, fertilizers, pharmaceuticals and chlorine-
alkali production.
Crude Oil Refining
: Madras Refinery Limited (MRL) is a
public limited company, which processes the imported
crude containing a sulphur level of 1.8-2.5 per cent by
weight. The atmospheric distillation unit fractionates the
crude into overhead product, Heavy naphtha cut,
Superior kerosene cut, Diesel cut and atmospheric
residue.
The Chennai Petroleum Corporation
: exists since 1963,
processing imported crude of 2.8 Million metric tons per
annum (MMTPA) in Refinery I and 1.5 MMTPA in
Refinery II and indigenous crude 2.2 of MMTPA in
refinery II. Thus the total processing capacity of Refinery I
and II is 6.5 MMTPA. By refining the crude oil the unit
produces LPG, petrol feed stock, motor spirit, light
aromatic naphtha, aviation turbine fuel, superior
kerosene, linear alkyl benzene, high speed diesel oil, lube
oil base stock, fuel oil, low sulphur heavy stock, bitumen,
sulphur, carbon block feed stock and wax. After
treatment, about 60 per cent of the effluent is reused
internally for green belt development, civil works and fire
hydrant system and remaining (40 per cent) per unit is
discharged into Buckingham canal.
The dispersion of emission from point source of fuel
firing in various heater furnaces to heat the crude oil or
intermediate products forming feed to various processing
units. Fugitive emissions are primarily from intermittent or
continuous leakage or evaporation of volatile organic
carbon (VOC) from processing or storage area. The
ambient air quality shows sulphur dioxide and nitric oxide
were within the standards in all 8 sampling stations
whereas sulphur dioxide exceeded in 3 sampling stations.
Chemical Production
: The Madras Petrochemical plant
produces transformer oils, petroleum jelly and other
petroleum products. Liquid waste from the petroleum
plant is treated in DCDA (Double Contact Double
Adsorption) system, which produces acid sledge
(Sreenivasan & Franklin, 1975). The sledge is presently
being stored in a large lagoon on site.
Southern Petrochemicals Industries Corporation
(SPIC):
is a heavy chemical division a chlorine-alkali plant, which
uses sodium chloride from seawater to produce caustic
soda, hydrochloric acid, liquid and gaseous chlorine,
hydrogen and ammonium chloride.
Organics Ltd
.: The unit produces 1000 tons of Polyols
and 650 tons of propylene glycol per Month. It also
produces 175 Tons of by product propylene dichloride per
month, dipropylene glycol 80 tons per month,
Tripropylene glycol 10 Tons per month and propylene
oxide 1000 tons per month. It utilizes 20 KLD of water for
domestic purpose, 500 KLD for cooling and 4800 KLD for
process. It generates 15 KLD of sewage and 4500 KLD of
trade effluent. Sewage is treated and disposed through
septic tank and dispersion trench arrangement. Trade
effluent is generated from process, floor washing, boiler
blow down and DM plant regeneration. The treated trade
effluents are discharged into the sea along with Manali
Petro Chemical Limited effluent.
Indian Organic Chemical Plant
: It produces a variety of
organic chemicals for commercial purposes. Dried sludge
from the treatment units are currently being used as
manure for on-site forestry plantation.
Tamil Nadu Petro Products (TNPP) Ltd
:
The unit
generates 100 KLD of sewage and 310 KLD of trade
effluent. Sewage is treated in the sewage treatment plant
consisting of screen pit, oil removal tank, collection tank,
equalization tank, aeration tank, settling tank and sludge
drying bed Trade effluent is discharged into sea. The unit
also generates non mercury bearing brine sludge from
salt purification. It is disposed as land fill. The unit also
generates mercury bearing waste. It is stored in
impervious pit within the premises. Although the normal
Indian Journal of Science and Technology Vol.2 No 3 (Mar. 2009) ISSN: 0974- 6846
Edu.Sust. Devpt. “Ennore creek” Shanthi & Gajendran
Indian Society for Education and Environment (iSee) Indian J.Sci.Technol.
71
route of effluent discharge is to be Buckingham canal, the
effluent was being used on site for irrigation.
Manali Petro Chemicals
: The unit produces propylene
oxide and propylene glycol 520 Tons/Month. The unit
utilizes 50 KLD of water for domestic purpose, 1800 KLD
for cooling and 5150 KLD for process. It generates 15
KLD of sewage and 3400 KLD of trade effluent. Sewage
is treated and disposed through septic tank and soak pit
arrangement. The treated trade effluent is discharged into
sea at a distance of 600 m inside from seashore.
Kothari Sugar Chemicals
: The unit generates 14 KLD of
sewage and 320.5 KLD of trade effluent. Sewage is
treated in the septic tank and the over flow is treated with
trade effluent in the effluent treatment plant. Stacks of
adequate height are provided for discharge of emission
from flare, boiler, oil heater and D.G. Sets. The unit
generates no solid waste. This plant discharges effluent
into the sea, along with the liquid effluent produced by the
UB petro plant.
Cetex
: It produces methyl ethyl ketone as main product
and secondary butyl ether heavy fractions dimmer
fraction and sulphuric acid as by product. The unit utilizes
6 KLD of water for domestic purpose 495 KLD for cooling
and process. It generates 5KLD of sewage and 70 KLD of
trade effluent. The unit generates ETP sludge. The
sludge yielded by the treatment of wastewater, containing
spent chemicals and consists largely of calcium sulphate
(gypsum) is currently disposed off by landfill on the plant
premises and liquid waste high in total dissolved solids
(salts) is discharged via pipeline to the sea. National
Aromatics reuses the treated sewage effluent with the
installation of a tertiary treatment system and the final
effluent is to be discharged into the sea.
Indian Organic Chemicals
: Produces Polyester stable
fiber 2500 tons per month and polyester filament yarn
1250 tons per month as main product and methanol 700
tons per month as by product. The unit utilizes 195 KLD
of water for domestic purpose, 1205 KLD for cooling and
200 KLD for process. It generates 175 KLD of sewage
and 1350 KLD of trade effluent. Trade effluent is
generated from water treatment plant, cooling tower
bleed off, boiler blow down and polymerization recovery
plant
Fertiliser Plant
:
Madras Fertilisers Limited (MFL) unit produces
ammonia, urea, NPK Complex Fertilizer and Bio-fertilizer.
The unit utilizes 1,350 KLD of water for domestic, 28,260
KLD for cooling and 1,350 KLD for process. It generates
360 KLD of sewage and 8,400 KLD of trade effluent.
Treated effluent is discharged into Red Hills lake surplus
channel, which is flowing adjoining to the unit. The unit
generates calcium carbonate sludge and spent catalyst
as hazardous waste. The liquid waste contains ammonia
phosphate, urea, fluoride and suspended solids are
discharged to sea through Buckingham canal.
The pollutants that affect the creek can be grouped
based on the source of origin: They are domestic pollution,
institutional and commercial pollution and other public
utility services. Waste water obtained from the domestic
usages such as washing, bathing, cleaning and other
public utility services form the domestic pollution.
Institutional and Commercial Pollution is the mass
discharge of sewage from educational institutions,
medical centres, public services, lodges, theatres etc.
Industrial pollution is due to industrialisation, there is a
large production of waste water and solid waste. This
water is not disposed safely. Industries dispose the
effluent, through canal and rivers, directly into the sea.
Toxic pollutants discharged into the marine environment
results in such deleterious effects as harm to living
resources, hazards to human health, hindrance to marine
activities including fishing impairment or quality of sea
water and reduction of amenities. Hazardous waste is
termed as a type of waste which is hazardous or toxic to
humans and affects the environment directly. The
industries in the Manali industrial complex have been
identified by the TNPCB as Red Industries.
The status of coastal environment at Ennore and its
surroundings
Central Pollution Control Broad (CPCB) (1994), has
identified the Ennore Creek as the major source of
pollution covering Greater Chennai Coastal Zone in Bay
of Bengal. GCCZ could be taken from Palar river estuary
in the south to Pulicat lake mouth in the north, a distance
of about 100 km. This coastal belt once boasted of the
second largest beach and one of the second longest
beaches and one of the finest coastal stretches in the
world. Now this coast is turning out to be the one of the
unsightly overburdened and polluted in the world.
A notification issued under The Environment
Protection Act 1986 has listed those industries, which
need environmental clearance. It includes industries
like petrochemical complexes, petroleum refineries,
cement, thermal Power station, fertilizer, dyes, paper
etc. The Central Pollution Control Board in
collaboration with the State Pollution Control Board
identified Manali as one of the problem areas in the
country. The Manali is spread over an area of 800
hectares with a number of industries of which ETPS,
SPIC, Heavy chemicals, MRL. Madras Petroleum
Limited. Kothari Industrial Corporation Limited, EID
Parry and MFL are major polluting ones.
According to Akila Dinakar (2003), the major
industrial belts cause health hazards in the neighbouring
areas. Children and adults alike in Manali suffer from
respiratory and skin ailments. The effluents are
discharged into the Buckingham Canal and Ennore Creek
polluted the water and killed marine life including crab
and prawns.
The areas located near Ennore creek include
different levels of waste generating industries:
1. Low solid waste generating industries: It is noted that
the most of the centrally located industries namely:
Additives Ltd., Manali Petrochemicals Ltd., Balmer Lawrie
Indian Journal of Science and Technology Vol.2 No 3 (Mar. 2009) ISSN: 0974- 6846
Edu.Sust. Devpt. “Ennore creek” Shanthi & Gajendran
Indian Society for Education and Environment (iSee) Indian J.Sci.Technol.
72
Ltd., Tamil Nadu Petroproducts Ltd., Sriram Fishes Ltd.,
and Madras Flourine Ltd., had been identified as low solid
waste generating industries because the solid waste
generated from them is less than 100 Kg per year.
2. Moderate solid waste generating industries: It is
evident that two areas have been delineated as moderate
solid waste generating industries. These industries
namely US Petroproducts Ltd., and Madras Refinery Ltd.,
have been identified as moderate solid waste generating
industries. The solid waste generated from these
industries 100 to 1000 Kg per year.
3. High solid waste generating industries: It is noted that
the only centrally located industry namely MFL has been
found to be maximum solid waste producing industries.
More than 1000 Kg per year of solid waste are produced
from this industry because it has been identified as high
solid waste producing industry.
According to Vivekananandan and Rajagopalan
(1999), Ennore Creek is one such marginal marine body
that has been contaminated by huge amounts of
untreated effluents from both point and non point
resources. The depletion of fish stock has also reflected
in the decline of fish catch by artisan fishes and their
income. In fact, the catches from the artisan sector in
India have decreased from 870000 tons in 1971 to
297000 in 1997. The catch rate has reduced from 9.5
tons /craft/year 1971 to 3.9 tons/ craft/ year in 1997. The
contribution of artisan fishing sector to the total marine
fish production has decreased from 78 % to a mere 11
per cent. Thus, 75 % of the fishers produce only 11 % of
the total marine production. There are about 0.5 million
coastal artisan fishers, which are about 75 % of the total
active marine fishers. The steep declining growth of
marine fishery is mainly attributed to over exploitation
and general marine environmental degradation
especially in the coastal areas. This has immediate
effect on the income of coastal fishers.
Sanjeeva Raj (2000a,b)
opined that the impact of the
hot water discharge from the North Chennai Thermal
Power Station extended up to Pulicat. With industrial
pollution building up “the creek has turned into a septic
tank”. The construction of sea walls for the Ennore
satellite port has already started showing environmental
results in terms of coastal erosion and accretion
Swahilya (2004). According to the study conducted in
the MRL revealed that total dissolved solids at Ennore
Creek, point of confluence of the canal and the sea
water was found to be 37,100 mg/l. Similarly high levels
of sodium chlorides, sulphates, calcium and salinity
were also observed in the area indicating the sea water
intrusion. BOD value was high at discharge point in the
canal. At Ennore Creek, BOD at 20
0
C and COD were
found very high. Tests indicated that total coliform, fecal
coliform,
E.coli
, fecal streptococci were all present at all
the above stations throughout the study period
indicating the bacterial contamination (MRL, 1999).Due
to pollution in the water near the city coast the catch and
the income of fish worker has reduced to Rs.40 from 50
per day, ever lower than what the construction workers
get in Chennai City (NEERI, 1998). The Creek carries
high load of chromium contamination (Kamala Kannan
et al
., 2007)
The fly ash and hot coolant water from the NCTPS
as well as the sea erosion have led to decrease in fish
catch. It is feared that Tiger Prawn and crap threadfin
fish and bhetki, which were found in plenty some years,
have become scarce. The current fish stock is far below
the carrying capacity of the lake. Even at a low rate of
about 200 kg of seafood per hectare. Pulicat lagoon
system ought to carry about 10000 tonnes of seafood.
But according to experts the lagoon in most parts carries
hardly 5 % of its capacity (Report, 2000).
The Central Pollution Control Board estimated the
total waste generation in the coastal regions of Tamil
Nadu and published in 1996. It reported that the solid
waste generated in the coastal areas was to the tune of
7,191 tons per day. While, the effluents generated were
24, 66,114 m
3
per day. Arunagiri
et al
. (1998) concluded
that Many rivers and water channels including
Buckingham canal and Korataliyar river are no longer
able to receive and assimilate effluents because they
have fallen below minimum levels of flow.
Ennore Island and the villages on it are threatened
by pollution as evidenced from GIS studies conducted
by Anna University, Chennai. The land use changes,
shore line changes and changes in water spread were
prepared from base maps of 1974 and imageries of
1990 and 1998. Thematic maps were prepared from all
identified activities and the impact of all water qualities
were executed in different thematic layers in GIS. The
point where the Ennore Creek connects the Pulicat lake,
the water temperature in this region was 4
0
C more than
that of normal water temperature of the lake. This was
because of the thermal discharge from NCTPS which is
located southern side of the Pulicat lake. The effect was
observed for a distance of 500m in the lake. Moreover,
the mean annual rainfall in this region is around 120cm
with the two-third of rainfall occurring during northeast
monsoon period from October to December). This was
because of low rainfall and the high sediment rate
(15mm/yr) contributed by the Buckingham canal which
confluence at the south central side of the lake
(Kasinatha Pandian, 2002).
The Madras Refinery Ltd discharges it’s treated
effluents through the Buckingham canal and the Madras
Fertilisers Ltd., through the Red Hills surplus channel,
both reaching the Ennore Backwater. It was found that
the treated effluents had a nutritive effect, improving the
phytoplankton population at times to bloom to the
proportions of very high concentrations of phosphates up
to 37 ppm. A large number of diatom species in Ennore
backwater was also reported (Sreenivasan
et al
., 1975).
Indian Journal of Science and Technology Vol.2 No 3 (Mar. 2009) ISSN: 0974- 6846
Edu.Sust. Devpt. “Ennore creek” Shanthi & Gajendran
Indian Society for Education and Environment (iSee) Indian J.Sci.Technol.
73
0
10
20
30
40
50
60
Number of households
(in percentage)
1 – 3 3 – 6 6 – 9 9 – 12 12 – 15 15 and
above
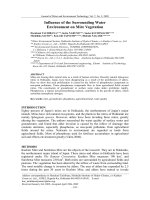
Fig.
2
. Time (h) taken in each tri
p
Hou
r
The socio-economic condition of the fisher folk of
Ennore Creek became so miserable and was the focal
point in the debate of the
daily news magazine.
Goutam Ghosh (2003), a
Freelance writer for “The
Hindu”, visited NCTPS and
observed that the livelihood
of the fisher folk of the
Ennore Creek was affected
by the hot water released by
the power plant.
According to
Ramakrishnan (2002), the
coastal erosion has become
a perennial for the people
living along the Royapuram-
Ennore coast. Over the years
350 hectares of land have
been lost. Apart from that
hundreds of homes, even the
places of worship and
Panchayat roads have
disappeared. A main cause
cited for the sea erosion of
North Chennai is due to the
construction and deepening
of the Chennai harbour. This
forces the North-bound
currents to curve in-land,
eating away the coastal
structures The 6 m beach
erosion is well known at
Thiruvottiyur displacing fisher folk, highways and temples
etc. Beach erosion has started just north of it at the
Kattupallikuppam but has escalated at Koraikuppam
(Sundarraman, 1999).
From the extensive review of the literature, it is clear
that the Ennore Creek area has been subjected
to various pollutions. In fact, it receives world-
wide attention as it becomes an important point
polluting source in the Bay of Bengal. In spite of
this, the social and economic characteristics of
the stakeholders, such as fishermen, have not
been thoroughly worked out.
The effect of pollution on stake-holders in
Ennore and the neighbourhood
They are 306 samples households, spread
in eight villages in and around in Ennore Creek.
The samples are drawn on the basis of the
population of the respective villages. The
classification of the sample households spread
in eight villages according to the category of
fishing and non-fishing community is shown in
Table 1.
More than one–fourth (27.1 %) of the sample
households are drawn from Sathiyavani Muthu Nagar. It
is followed by Ulaganathapuram and Thazangankuppam
in the percentage of 14.7 % and 12.1 % respectively. All
other villages have a
sample size ranging from
6.2 to 10.5 % respectively.
All the households
selected are not
homogeneous and they
are classified fishermen
community and non-
fishermen community for
the sake of analytical
convenience. It is found
that 220 of the 306
households (71.9 per cent)
are from the fishermen
community and the
remaining 28.1 % are non-
fishermen community.
All the households
selected from Ennore
kuppam are fishing
community and in all the
villages except
Ulaganathapuram are
dominated by fishing
communities. In
Ulaganathapuram 57.8 %
of the selected households
belong to non-fishing
community. In all other
villages non-fishing
community ranges from
34.9 % in Sathyavanimuthu Nagar to 2.3 % in
Mugathuvarakuppam. It is observed that fishing
communities are found to be heavily concentrated in
areas close to the Ennore Creek and adjoining coastal
areas.
Fishing trips
Sea and the water ways provide infinitive opportunity
for the fishermen. But it involves physical exertion;
Table 1. Sample households
Fishermen Community
Name of the Village
Yes No
Total
Nettukuppam
23
(74.2)
[10.5]
8
(25.8)
[9.3]
31
(100.0)
[10.1]
Kattukuppam
21
(67.7)
[9.5]
10
(32.3)
[11.6]
31
(100.0)
[10.1]
Sivanpadaiveedi
26
(81.3)
[11.8]
6
(18.8)
[7.0]
32
(100.0)
[10.5]
Ennore Kuppam
28
(100.0)
[12.7]
0
(.0)
[.0]
28
(100.0)
[9.2]
Mugathuvarakuppam
17
(89.5)
[7.7]
2
(10.5)
[2.3]
19
(100.0)
[6.2]
Thazangkuppam
33
(89.2)
[15.0]
4
(10.8)
[4.7]
37
(100.0)
[12.1]
Ulaganathapuram
19
(42.2)
[8.6]
26
(57.8)
[30.2]
45
(100.0)
[14.7]
Sathyavani Muthu
Nagar
53
(63.9)
[24.1]
30
(36.1)
[34.9]
83
(100.0)
[27.1]
Total
220
(71.9)
[100.0]
86
(28.1)
[100.0]
306
(100.0)
[100.0]
Source: Field Survey; Nos: in the parenthesis indicate
column % & in the brackets indicate row %
Indian Journal of Science and Technology Vol.2 No 3 (Mar. 2009) ISSN: 0974- 6846
Edu.Sust. Devpt. “Ennore creek” Shanthi & Gajendran
Indian Society for Education and Environment (iSee) Indian J.Sci.Technol.
74
therefore they cannot make many trips often
for fishing. The number of fishing trips made by
the fishermen households vary from one to
more than 7 per week. The details are given in
the Table 2.
It is found from the survey that 33.3 % of
the households involved in fishing make 4
trips per week. This is the mode of their
frequency distribution. Only 8.5 % of the
households make one trip every day and only
16.4 % of the fishing households make more
than six trips per week. It is found from the
survey that the urgency of earning income
persuade them to have more trips.
Time taken for fishing
It is generally perceived that time taken
for fishing is directly proportional to fish yield.
The time taken for fishing by different
fishermen households are shown in Fig.2.
More than half of the households (53.6 %)
take 9 to 12 h for each trip. Only 8.5 %
households spend more than 12 h for fishing
in each trip. It is surprising to note that 6
households spend 1 to 3 h per trip for fishing.
It is reported by them that they use the
traditional methods for fishing and they delimit
the area closer to the coast. On an average
they spend 9.78 h per trip for fishing. The time
taken for fishing in each trip does not reveal
the real income generating capacity of the
fishing households. Therefore, they were
asked about the number of days they spent for fishing in
the last week of the survey. They reported frequencies
are given in Table 3. It is found that only 14.4 % of those
fishing households spend all the days in a week for
fishing. However, 3.9 per cent of the fishing households
spent only a single day for fishing. More than two fifths
(43.8) of the fishing households spend four days in a
week for fishing. Fishing is a laborious task that requires
a lot of physical exertion. Hence, it is difficult to fish all the
days in a week. Due to the urge for earning more income
some households engaged in fishing all the days in a
week.
The availability of fish is not uniform throughout the
year. In some months they get better fish catch while in
others less. The number of months they spend for fishing
every year is shown in Table 4. More than half of the
fishing households opined that they spend eight to ten
months for fishing in every year. Only 2 per cent fishing
households spend more than 10 months in a year for
fishing. Such households use catamaran and do not use
any fishing boats for fishing. The remaining households
spend less than eight months in a year for fishing which
range from the minimum of 1 to 2 months to the
maximum of 6 to 8 months. The respondents were asked
about the reasons for not fishing in all the months in a
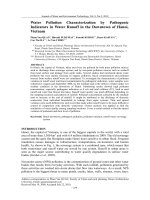
year. Their replies are represented in Fig.3.
It came to be known that Moratorium is the
least important reason for non- fishing by the
fishermen community. Therefore, it can be
inferred that almost all the fishermen
households are using the area closer to the
coast. Moreover they are not using any
mechanized boats. Fish non availability is the
reason cited by 63.4 % of the fishing
community. According to them in addition to
fierce competition in fishing the industrial
development of the area also plays a vital role
for the non availability of fish.
Value of the fish caught
Three fourth (76.5 %) of the fishing
community households get total value of fish
catch in every trip less than Rs.400 but there
are 9.8 per cent fishing households earning
more than Rs.1000 in every trip. The
households with lower value of fish catch are
the majority when compared to the
households with high value of fish catch.
Encircling net is the most popular type of
net used for fishing by the fishing community.
It accounts for 75.8 per cent of the total nets
used by the fishing households. The other
nets in the order of preferences are line
fishing; bonding and direct catch by hand are
in the percentages of 9.8, 7.2 and 5.2
respectively.
The respondents were asked about the
trend in fish catch over the years. No one was
opined that the fish catch increased over the years. Nine
out of every ten respondents replied that the quantity of
fish catch decreased while only 7.8 % replied that it is
constant over the years. In order to assess the awareness
the respondents were asked about the reason for less fish
catch. The details are furnished in Table 4. Pollution was
the reason for low fish catch by 58.8 % of the fishing
community. It is followed by over fishing and soil erosion
in the percentages of 25.5 and 2.6 respectively. Other
reasons occupy only less number of respondents
because the above cited two reasons are very familiar for
them.
Sources of pollution
The sources of pollution of coastal areas according to
the respondents are shown in Table 5. The main source
of pollution is the existence of Ennore Thermal Power
Station and EID Parry’s. These projects discharge
effluents and spread the pollutants in the atmosphere,
which causes ultimately the pollution of river and coastal
area. This reason is given by 25.5 % of the respondents.
All other reasons cited as small scale leather industries,
petrochemicals, Manali industrial effluents and hot water
discharges are in the percentages of 15,13.1,5.1and 7.8
respectively. The fishermen adopt some strategies to
overcome less fish catch: 86.6 % of the fishing
households sought for deep fishing as a method to
Table 2. Number of
fishing trips in a week
No:
Fishermen
community
1
13
(100.0)
[8.5]
2
20
(100.0)
[13.1]
3
24
(100.0)
[15.7]
4
51
(100.0)
[33.3]
5
20
(100.0)
[13.1]
6
4
(100.0)
[2.6]
7
20
(100.0)
[13.1]
14
1
(100.0)
[.7]
Total
153
(100.0)
[100.0]
Legend as per Table 1
Indian Journal of Science and Technology Vol.2 No 3 (Mar. 2009) ISSN: 0974- 6846
Edu.Sust. Devpt. “Ennore creek” Shanthi & Gajendran
Indian Society for Education and Environment (iSee) Indian J.Sci.Technol.
75
0
10
20
30
40
50
60
70
Nu m be r o f
households (in
percentage)
Moratorium Off season Fish non-
availability
Paadu
Reasons
Fig.3. Reason for not fishi
n
g
overcome the shortage of fish catch. More
than one fourth of the fishermen households
suggested working overtime as the strategy.
Job satisfaction
Fishing is a traditional occupation of a
particular community. This occupational
change does not include the fishing
occupation. In this scenario the respondents
were asked about their job satisfaction with
fishing. It is interesting to see that 15.3 % of
the fishing households are not satisfied with
fishing. Still there are 49.7 % households who
still love the fish occupation. Reasons for
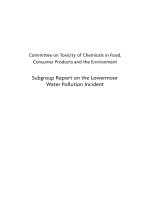
dissatisfaction of fishing are shown in Fig.4. It
can be understood that some of the reasons
are close to less fish catch and some of the
reasons are related to their health. Of the two
reasons the reason for dissatisfaction towards
the quantity of fish catch dominates. It
accounts for 69.7 % of the total households.
Health reasons accounts for 30.3 % of the
fishing households who were not satisfied with
fishing.
Water is an essential prerequisite for the
existence of life, sanitation, human health and
overall development of human beings. Fresh
and marine water give food, access to potable
water which are major contributors to general
community health. Instead, polluted
water breeds mosquitoes, flies, rodents
and other disease carrying vectors.
The Ennore Creek and its adjoining
environment are polluted because of
effluents from many polluting industries,
hot water and fly ash from the Thermal
Power Plants and the remains of Manali
Refineries Limited etc. The quality of
water in the Ennore Creek is not fit for
the living organisms because of the
absence of oxygen content in the water.
The stakeholders of the Ennore Creek
have been subjected to various
diseases such as skin problems, tropical
diseases, infectious diseases, diarrhoea and
vaccine preventive diseases. By examining
the 306 sample households it was found that
140 (41.79 %) of them have members
affected by some of the diseases. The
numbers of sick persons vary from household
to household. It ranges from a minimum of 1
to the maximum of 3. The particulars are
given in Table 6.
The illness of members in the sample
households for the past one year from the
date of survey is identified and they are
classified under eight broad heads of
diseases such as cough, TB and wheezing,
skin diseases, typhoid, malaria, eye diseases,
cancer and others. Cough, TB and wheezing
is the most popular disease in the Ennore
Creek. This category of disease was found
among 40.8 % of the total sick persons. Skin
diseases are the second most categories of
diseases among sick person. It accounts for
29.5 % of the sick persons. The diahorreal
disease like typhoid accounts for 5.5 %. From
this it is clear that polluted water in the Ennore
Creek is mainly responsible for the diseases
like skin irritation, Typhoid, Malaria etc. There
are sizable numbers of members of the
sample households have been affected by air
pollution from the neighbouring industries.
Therefore diseases like cough, TB, wheezing and Asthma
are widely prevalent among the sick members in Ennore
Creek. There is 3.5 % of sick persons reported with
problems of eye diseases and opined polluted water in
Ennore Creek was the cause.
Reason for bad health
In order to assess the awareness of the sick persons
about their reasoning of the cause of diseases, they were
asked about the major reason for their sickness. Nearly
Table 3. Days spend fo
r
fishing in the last week
Days
1
6
(100.0)
[3.9]
2
7
(100.0)
[4.6]
3
23
(100.0)
[15.0]
4
67
(100.0)
[43.8]
5
22
(100.0)
[14.4]
6
6
(100.0)
[3.9]
7
22
(100.0)
[14.4]
Total
153
(100.0)
[100.0]
Legend as per Table 1
23.7
19.7
22.4
21.1
2.6
2.6
7.9
0
5
10
15
20
25
Number of households (in percentage)
Not getting fishes higher level
No steady income
High pollution decreases fish catch
Sensitive fishes vanishes
Over fishing
Costly fishes not available
Too much strain
Fig.4. Reason for dissatisfaction of fisher folk
Not getting fishes higher level
No steady income
High pollution decreases fish catch
Sensitive fishes vanishes
Over fishing
Costly fishes not available
Too much strain
Fig.4. Reason for dissatisfaction of fisher folk
Indian Journal of Science and Technology Vol.2 No 3 (Mar. 2009) ISSN: 0974- 6846
Edu.Sust. Devpt. “Ennore creek” Shanthi & Gajendran
Indian Society for Education and Environment (iSee) Indian J.Sci.Technol.
76
three fifth of the sick persons (38.8 %)
have given river water pollution as the
most important reason for their bad
health. It is followed by industrial
pollution, which accounts for 25.1 per
cent of the total sick persons. Pollution
due to chemical effluents and other
reasons were cited by 15.2 % and 11.9
% of the sick persons respectively.
Sewage pollution and oil pollution
account for only 3.5 and 5.5 %
respectively of the sick person. From this
it is clear that the people of Ennore
Creek feel that the fly ash from the
thermal power station and the polluted
water of the Ennore Creek and its
coastal area are mainly responsible for
the diseases of a majority of the sick
persons (Plate 1).
Working days lost
The number of working days lost
due to the sickness of the sick members
was elicited from the response. It is
found that 255 of the 343 sick people seek
medical help in their attempt to cure the
illness. In this process they have lost some of
their working days. The number of working
days lost due to sickness ranged from 1 to 9
working days in the last month of the survey.
It is surprising to see that 22.4 % of the sick
persons sought medical assistance that has
lost 8 or more than 8 working days in that
month. However, nearly 60 per cent of the
sick persons have lost less than five working
days due to sickness. The average wage lost
due to sickness is computed as Rs.467.
Household income
Though Ennore Creek area has
agriculture land only 4 of the 306 households
generate income from agricultural activities.
In addition to that 13 households receive
income from other assets. The total average
monthly household income is finally arrived
at and the frequency distribution of the
monthly household income is given in Table
7. It is interesting to note that only 5.9 per
cent of the households generate income less
than Rs.2000. However, 19.3 % generate
income of Rs.10000 or more per month. The
middle income group is Rs.6000 to 8000. But
49 per cent of the households have income
less than the modal class.
Null hypothesis (Ho)
There is no influence of environmental
factors on the working days lost due to
sickness of the stakeholders in Ennore
Creek.
Alternative hypothesis (Ha)
There is the influence of
environmental factors on the working
days lost due to sickness of the
stakeholders in Ennore Creek.
The houses of the respondents
situated in and around Ennore area are
subjected to the influences of various
environmental factors like water
pollution, air pollution and the degraded
living environment. The influence of
these factors on their life and there by
the productivity are analysed with the
help of multivariate analysis. The
determination of the working days lost
of the sick persons is multidimensional
in nature. In order to analyze the
multidimensionality of the correlates of
working days lost, as many as six
predictor variables and the criterion
variable (Working Days Lost) are
subjected to correlation analysis by
using Karl Pearson’s product moment
correlation.
Out of the six variables entered the
predictor variable of working days lost, came
out highly correlated with working days lost
of the sick persons with high Beta values.
The selected variables among others include
skin irritation and accepted the presence of
water pollution, type of fuel used for cooking,
type of family, average quantity of water
used for drinking and cooking and the
expenditure on consumption. The correlation
Matrix indicated the high degree of
correlation of .622 between working lost and
the type of fuel used for cooking purpose. All
the other set of variables show a less degree
of positive and negative correlation. The
coefficient of correlation between the number
of working days lost and the type of fuel used
for cooking reveals that not alone the indoor
pollution is responsible for these sickness but
it is an index of poor socio economic set up
of the household in Ennore Creek.
Summary of the findings
All the households selected from Ennore
kuppam and all the villages except
Ulaganathapuram were dominated by fishing
community. In Ulaganathapuram 57.8 % of
the households belonged to non-fishing
community. In all other villages non-fishing
community ranged from 34.9 % in
Sathyavanimuthu Nagar to 2.3 % in
Mugathuvarakuppam.
It is found that 49 % of the fishing
community used Ennore estuary alone for
Table 4. Reason for less fish catc
h
Reason
Pollution
90
(100.0)
[58.8]
Soil erosion
4
(100.0)
[2.6]
Shallowing of
creek
19
(100.0)
[12.4]
Over fishing
39
(100.0)
[25.5]
Others
1
(100.0)
[.7]
Total
153
(100.0)
[100.0]
Legend as per Table 1
Table 5. Source o
f
pollution
Source
ETPS, EID
42
(100.0)
[27.5]
No cleanness in
river
9
(100.0)
[5.9]
Oil effect
12
(100.0)
[7.8]
Ash
16
(100.0)
[10.5]
Domestic and
sewage waste
10
(100.0)
[6.5]
Manali industrial
effluents
9
(100.0)
[5.9]
Petrochemicals
20
(100.0)
[13.1]
Small scale
leather industries
23
(100.0)
[15.0]
Hot water
discharge
12
(100.0)
[7.8]
Total
153
(100.0)
[100.0]
Legend as per Table 1
Indian Journal of Science and Technology Vol.2 No 3 (Mar. 2009) ISSN: 0974- 6846
Edu.Sust. Devpt. “Ennore creek” Shanthi & Gajendran
Indian Society for Education and Environment (iSee) Indian J.Sci.Technol.
77
fishing while 21.6 % depended on sea alone. However,
29.4 % of the fishing households use both Ennore estuary
and sea for their fishing. Hence, the degradation of
Ennore estuary and sea coast had a
severe impact not only on their
livelihood but also on their ability to
perform different functions.
One third (33.3 %) of the
households involved in fishing make 4
trips per week. This was the mode of
their frequency distribution. Only 8.5
% of the households made one trip
every day and only 16.4 % of the
fishing households made more than
six trips per week. More than half of
the households (53.6 %) took 9 to 12
hours for each trip. Only 8.5 %
households spend more than 12
hours for fishing in each trip. Some of
the fishing households used the
traditional methods for fishing
because of low capital and they
delimited the area closer to the coast
for fishing.
No one opined the trend of
increase of fish catch over the years.
Nine out of every ten respondents
replied that the quantity of fish catch
decreased while only 7.8 % replied
that it was constant over the years.
Pollution was the reason cited for low
fish catch by 58.8 % of the fishing
community. It was followed by over
fishing and soil erosion in the
percentages of 25.5 and 2.6
respectively.
Cough, TB and wheezing were the most common
diseases in the Ennore Creek. These diseases were
found among 40.8 % of the total sick persons. Skin
diseases were the second most categories of diseases. It
accounted for 29.5 % of the sick persons. The diahorreal
disease accounted for 5.5 %. It is clear that polluted water
in the Ennore Creek was mainly responsible for the
diseases like skin irritation, Typhoid, Malaria etc. There
were sizable numbers of members of the sample
households who have been affected by air pollution from
the neighbouring industries.
Nearly three fifth of the sick persons (38.8 %) had
given river water pollution as the most important reason
for their bad health. It is followed by industrial pollution,
which accounted for 25.1 % of the total sick person.
Pollution due to chemical effluents and other reasons
were cited by 15.2 % and 11.9 % of the sick persons
respectively. Sewage pollution and oil pollution accounted
for only 3.5 and 5.5 % respectively of the sick person.
From this it is clear that the people of Ennore Creek feel
that the fly ash from the thermal power station and the
polluted water of the Ennore Creek and its coastal area
were mainly responsible for the diseases.
With regard to income generation, 45.3 % earned an
income between Rs.2000 and
Rs.4000. Another one third (27%)
earned an income between Rs.4000
and Rs.6000. Thus more than two
third of the respondents earn between
Rs.2000 and Rs.6000. 59.5 per cent
had earning members other than the
respondents. Among them 43.4 %
earned less than Rs.2000 per month.
It is interesting to note that only 5.9 %
of the households generated income
less than Rs.2000. The modal income
group is Rs.6000 to 8000. But 49 % of
the households had income less than
the modal class.
1. This study is centred upon a key
factor i.e., identification of an
ecologically important but
anthropogenic vulnerable site.
Ennore creek, once cherished
ecological richness but is now
heading towards a premature
ecological death. It happens with
a short span of 3 decades (after
the industrialization of Ennore) in
spite of the stringent law and in
front of the hapless stack-holders.
Ennore Creek was the sole
livelihood for these thousands of
fisher families.
2. The study also attempts to play
back the whole scenario in the
Ennore Creek and correlate the
ecological plunder with the economic loss.
3. The study is able to diagnose the penury and poverty
of the stockholder to its root of environment
degradation.
4. The study suggests environmental restoration as a
long-term strategy to find a cure for the ailing-health
and income –loss of the innocent fisher folk.
5. The study also forewarns those organizations and
agencies concerned with environmental up keeping
acting in war-foot manner to restore this ecological
jewel from its brim of destruction.
6. At this crucial juncture, the collective opinion of stake-
holders drawn by this study will be helpful to those
administrators and conservationists concerned with
the coastal resources. The analysis gives a clear
picture that in spite of the ecological wealth loss, the
fisher folk still hope to make both ends on their own, if
further disturbance to the environment could be
stopped. They do not want to compromise the
ecological conservation with any other incentive as a
measure for their livelihood. The law-enforcing
Table 6. Diseases and the frequency o
f
sick members
Diseases
No: sick
persons
%
Cough, TB,
Wheezing
140 40.8
Skin disease 101 29.4
Typhoid 19 18.4
Malaria 8 2.3
Asthma 21 6.1
Eye disease 12 3.5
Cancer 3 0.1
General fever 39 11.4
Total 343 100.0
Source: Field survey
Table 7. Total average monthly
household income
Income (Rs.) Frequency %
Below 2000 18 5.9
2000-4000 65 21.2
4000-6000 67 21.9
6000-8000 68 22.2
8000-10000 29 9.5
10000 above 59 19.3
Total 306 100.0
Source: Field survey
Indian Journal of Science and Technology Vol.2 No 3 (Mar. 2009) ISSN: 0974- 6846
Edu.Sust. Devpt. “Ennore creek” Shanthi & Gajendran
Indian Society for Education and Environment (iSee) Indian J.Sci.Technol.
78
authorities should take clue from such positive
situation and extend all possible help to the ailing
fisher-folk so that the traditional life style is restored in
an environmentally congenial atmosphere.
7. The study also highlights the environmental
pathology of Ennore Creek worth to control in utmost
care as it could spread to other areas and to the
remaining population of the metropolitan too.
8. When crucial economic judgment needs to be passed
to make choice on ‘industrial economy’ or
‘environmental safeguard for fisher folk’, the study
strongly supports environmental preservation as a
long term economic gain to the nation. In fact,
industry is for the welfare of human need. Moreover,
industries meet the short term needs but their
ecological consequences are a long term loss.
Certainly, the ailing fisher folk and their migration
from the strategic ecological site only boomerang with
the impending ecological epidemics. Fisher folks are
the vanguards in protecting the coastal wealth for
thousands of years from ecological destruction and
from unscrupulous elements. They are the indicators
of coastal wealth and its up keeping.
9. Through this study the researcher brings out the fact
that how Ennore Creek need to be exploited for the
long-term benefit to mankind, especially for fisher
folk, which has been mishandled for the short term
industrial needs.
10. The study also emphasizes the fact that the real
wealth which we can pass on to future generation
depends on how much pristine pure environment we
leave for them. In this context, the conclusion of this
study also supports the importance of environmental
economy over industrial economy.
11. The study also made plans for an alternate use of
coastal resources in tune with environmental hygiene
in supportive of additional income to the
nation/coastal folk, in particular. The recent
devastation by Tsunami only emphasizes the need to
protect the fisher folk and mangroves for the benefit
of the entire nation.
References
1. Akila Dinakar (2003) Government should accord
priority to Environmental Issues.
The Hindu
, Sunday,
June.
2. Arunagiri
et al
. (1992) Modelling of pollution level in
Ennore Creek. Project Report.
Anna University,
Madras.
3. Azariah J
et al
. (1997) Biomanagement of biogeo
resources.
Bioethics In India
. pp: 16-19.
4. Central Pollution Control Board (CPCB) (1994)
Industry- specific pollution control status in problem
areas Manali and Digboi. Volume II. Programme
Objective Series: Probes/59/94-95, pp: 1-38.
5. Durariraj S (1988) Application of remote data for
costal zone mapping – A case study of the part of east
coast of Tamil Nadu. M.Tech. Thesis, Anna
University, Madras, p.138.
6. Glasby Y and Roonwal GS (1995) Marine Population
in India: An emerging problem.
Curr. Sci
. 68, 495-
497.
7. Goutham Ghosh (2003) Is it a fair deal?
The Hindu
,
Jan 23 & Jan 27.
8. Jayaprakash M (2003) Geochemical Assessment of
Heavy Metal Pollution in Ennore Creek. North of
Chennai. Ph.D.Thesis, Madras University, Chennai.
9. Jayaprakash M, Srinivasalu S, Jonathan MP and
Mohan V (2005) A baseline study of physico-
chemical parameters and trace metals in water of
Ennore Creek, Chennai, India.
Marine Pollution
Bullettin
. 50 (5), 583-589.
10. Kamala Kannan S, Lee KJ, Krishnamoorthy R,
Purusothaman A, Shanthi K and Rajeshwara Rao
(2007) Aerobic chromium reducing
Bacillus cereus
Plate 1. Skin infection of fishing folk and oil floa
t
at the mouth of Ennore creek where Buckingham cana
l
meets
Indian Journal of Science and Technology Vol.2 No 3 (Mar. 2009) ISSN: 0974- 6846
Edu.Sust. Devpt. “Ennore creek” Shanthi & Gajendran
Indian Society for Education and Environment (iSee) Indian J.Sci.Technol.
79
isolated ffrom the heavy metal contaminated Ennore
Creek sediment, North of Chennai, Tamilnadu, South
East India
. Res.J.Microbiol
. 2(2), 130-40.
11. Kasinathapandian P (2002) Coastal dynamics of
north Chennai coast, southeast India. Ph.D. Thesis,
Anna university, Chennai.
12. Kee Chai Chang and Rathin Roy (1997) coastal
environments under threat - Demographic issues and
the perceptions of fisher folk.
FAO Fact file
. pp: 5-16.
13. Kee-Chai-Chang (2000) Evolving self financing
scheme for fisheries management.
Bay of Bengal
Programme
, Report-76, Chennai, pp: 197-210.
14. Manivel M, Manikiam B, Kumaran Raju D and Moses
Edwin J (1995) Study of ecosystem development
along Coramandal coast of Tamil Nadu using remote
sensing techniques.
GISdevelopment.net. AARS,
Poster Session 3
.
15. Masilamani JG, Nandakumar,K, Satpathy KK,
Jesudos KS, Azariah J and Nair KVK (1999)
Fluctuations of marine fouling community in different
parts of the cooling water systems of Madras Atomic
Power Station. In: Workshop on Forestry, Forest
Products and Coastal Population. Feb 10-12, p. 36.
16. MRL Report (1999) Rapid environmental assessment
study of 3, MMTPA, refinary expansion project.
Manali, Chennai, pp.182.
17. NEERI (1995) Coastal aquaculture, Report. p: 7.
18. NEERI (1998) Environmental Impact Assessment
Studies for Proposed Development of Petrochemical
estate for establishment petrochemical project at
Ennore phase II. Sponsor TIDCO, Chennai. pp: 6-10.
19. Purvaraj R and Ramesh R (2000) Human impacts on
methane emission from mangrove systems in India.
Regional Environ. Change
. 1 (2), 86-97.
20. Ramachandran S (2001) Coastal environment and
management in India: an overview. Report. Anna
University, Chennai.
21. Ramakrishnan T (2002) Government dithers as the
Ennore coast faces further erosion.
The Hindu
,
September 3.
22. Report (2000) Environment profile of Thiruvallur
district. Director of Environment, Tamil Nadu.
23. Sanjeeva Raj PJ (2000a) Save Pulicat lake
ecosystem.
Business Line
, July 03, pp: 2-3.
24. Sanjeeva Raj PJ (2000b): “Save Pulicat ecosystem”,
CRENIEO
, pp. 1-5.
25. Sen Gupta
et al.
(1990) State of the marine
environment in the South Asian Seas Region.
UNEP,
Regional Seas Reports and Studies
. No: 123. p:19.
26. SPIC-SMO (1990) Republic of India, Government of
Tamil Nadu Report. pp: 3-17.
27. Sreenivasan R and Franklin T (1975) Effects of
disposal of effluents from petrochemical complex on
Ennore Backwaters.
Bulletin of the Department of
Marine Science
,
University of Cochin
, 7, 273-280.
28. Sundararaman TM (1999) Dirty beaches.
The Hindu
,
4
th
Jan.
29. Suriyanarayana Moorthy M and Mohammed
Habibullah (2001) Ichyofauna of Ennore Estuary.
Convergence.
3 (1-4), 60-64.
30. Swahilya (2004)
The Hindu,
Nov 28
th
.
31. UNEP (1997) Global Environment Outlook 1. Global
State of the Environment Report. pp: 8-12.
32. Vivekanadan E and Rajagopalan M (1999)
Management strategies for sustaining coastal fish
stocks and fishing communities. In: Workshop on
Forestry, Forest Products and Coastal Population.
Feb. 10-12, p. 57.