Modular Wetlands Impact on Water Quality in Oceanside Harbor pptx
Bạn đang xem bản rút gọn của tài liệu. Xem và tải ngay bản đầy đủ của tài liệu tại đây (373.57 KB, 9 trang )
Modular Wetlands Study In Oceanside Harbor
Modular Wetlands Impact on Water Quality in Oceanside Harbor
September 2008
Prepared by:
Michael Alberson and Tim Klein
Geosphere Consultants, Inc.
1150 Hamilton Lane
Escondido, CA 92029
88-02205-A
___________________________________________________________________________________
Project Manager: _____________________________
Michael Alberson,
CPSWQ, CPESC, CESSWI, REA
Modular Wetlands Study In Oceanside Harbor
Background
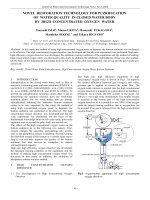
The location of Modular Wetland unit that the sampling and analysis was completed is the boat
washing area in Oceanside Harbor in Oceanside, California. Oceanside Harbor is heavily used with
dozens of boats being washed down daily in a small area where the septic tank disposal area is also
located (fig. 1).
Figure 1: (top) Modular Wetlands Linear; (bottom) Oceanside Installation
2
Modular Wetlands Study In Oceanside Harbor
The wash water is typically potable water that is used to wash the boats, soap is not allowed
but many waste products enter the wash off water and into the storm drains (figure 2),
which is treated by the device being tested – Modular Wetlands Storm Water Filtration
System(MWS)before being directly discharged into Oceanside Harbor.
Figure 2: Left posted signage, Right Washing area with soap being used.
The pollutants contained in the wash water can include sand, sewage waste, plant materials, oil
grease, diesel, dead fish, paper products, soap products and petroleum products. Samples analyzed
from 2007-2008 show multiple instances of Total Coliform above 1,600,000 MPN/100ml, Fecal
Coliform above 18,755 MPN/100ml, and Enterococcus above 24,196 MPN/100ml, all of which are
above the action level determined by the City of Oceanside. The action levels are 160,000
MPN/100m for Total Coliform, 18,755 MPN/100m for Fecal Coliform and 17,820 MPN/100m for
Enterococcus for the City of Oceanside.
Before the Modular Wetlands Device was installed, the boat wash water was treated by
StormCeptor vaults installed in 2003. After installation, bacteria levels still exceeded action levels.
Further attempts to reduce bacteria levels resulted in a pilot study conducted by the City of
Oceanside. According to the Bacterial Reduction Pilot Program – Oceanside Harbor, XTEX AM
antimicrobial fabric filters were installed on the separator vaults in addition to more frequent
cleaning of the boat wash out separation vaults and drains as part of the study.
While monitoring results showed an initial reduction in bacteria levels, the product did not display
long-term effectiveness. The antimicrobial fabric showed a decrease in performance as sediment
and hydrocarbon levels from run off increased.
3
Modular Wetlands Study In Oceanside Harbor
4
In response to the need for an all encompassing treatment device to deal with trash, debris (organic
and non organic) solids, sediment, total suspended solids (“TSS”), metals (dissolved/particulate),
nutrients (dissolved/particulate), oils, hydrocarbons, polycyclic aromatic hydrocarbons (“PAH”),
and pathogenic bacterium contaminants, the City of Oceanside authorized the installation of the
Modular Wetlands Device in April of 2008. The peak treatment capacity of the device is estimated
to occur approximately six months from time of installation when the plants in the wetland
chamber are mature.
Advanced Treatment Device Description
Introduction
Described as a structural/LID hybrid, the Modular Wetland System – Linear is a revolutionary
stormwater treatment system. This treatment system utilizes an innovative combination of
physically passive and natural biological treatment processes, including the use of a breakthrough
filter media, BioMediaGREEN, which acts as a pre-treatment media filter for the enhanced 4th
generation sub-surface flow wetland. These features combined with other various treatment and
flow control technologies has lead to a system that maximizes pollutant removal and minimizes
maintenance.
Testing Environment and Test Procedures
The Modular Wetlands device to be tested is located in a non typical situation. Unlike a storm event
that typically contains higher concentration during the first 2 hours our site has a fairly consistent
flow of wash water that is estimated to be consistent through out the day. For this reason,
composite samples were taken over a two hour period. The intent of the sampling was to establish a
composite pollutant sample. This was done by dividing all of the containers and bottles to be filled
for testing into ten equal parts. The grab sample was taken and then the appropriate amount was
measured and placed in each of the composite sample bottles. A total of 20 samples were taken
over the course of 120 minutes, ten from the inlet located in the front chamber of the MWS (Figure
3) and 10 from the outlet located in the third cell or discharge area (Figure 4). This yielded two
composite samples for each sampling event. To validate the event mean concentrations, flow data
was obtained by a flow meter that measured gallons used in the entire boat wash area. The flow
meter allowed use to accurately determine the amount of wash water flowing into the Modular
Wetlands Device. The flow meter was not installed until approximately July 3 so no flow data was
available prior to the installation. Electronic readings were taken for pH, TDS, Conductivity,
Temperature, Oxidation Reduction Potential (ORP), and Turbidity. Bacteria was not anticipated to
be effected until the plants roots had extended to the bottom of the MWS, that is why bacteria
sampling was not started until July. Bacteria analysis for Fecal Coliform, enterococcus, and E.coli
were conducted by Weston Solutions. Analysis for TSS, Copper, Lead, Zinc, N-Nitrates, and TPH
were conducted by DTEK Laboratories. All of the samples where collected by Geosphere
Consultants staff and who prepared a chain of custody for all samples.
Modular Wetlands Study In Oceanside Harbor
Figure 3 Inflow changer Figure 4: Outflow
Testing Problems
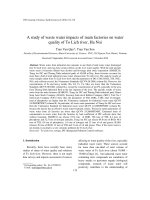
Testing began on May 30, 2008 approximately eight weeks after the installation of the device.
Plants being used in the system are Vetiver grass, a fast growing plant with large root bundles. The
initial plants where only 8 to 10 inches high with about the same amount of root mass below the
surface.
Photo taken April 8, 2008 Photo taken August 8, 2008 Photo taken September 29, 2008
This meant that the plants were doing little in the beginning to clean the inflow. In the beginning
it was not known if the plants would survive such a harsh environment. But after five months the
plants have proven that they are a plant well designed for this environment. Some benefits about
these plants are that they produce no seed, have no rhizomes, and can only reproduce by physically
moving a piece of the plant. At five months, the plants are three feet in height and the root systems
are now reaching the bottom of the wetland chamber (see photos above).
Two key problems were identified that have a direct impact on test results. The first is, even
though signs are posed, boat enthusiasts continually use soap products to clean there boats which
goes directly into the inlet of the MWS. This will cause an increase in a variety of pollutants. The
second problem is that the septic dump sites are directly above the inlet for the MWS. During
testing, our staff observed, on several occasions, that septic waste was being discharged directly to
the drain and into the MWS. Because of the improper use of the septic dumping sites we
anticipated that the bacterial counts would have a high degree of variability. We had sufficient
data from the City of Oceanside to show that bacteria levels were high, knowing that the MWS
5
Modular Wetlands Study In Oceanside Harbor
6
would not be effective against bacterial until the plants had matured. Plant roots where observed in
the bottom of the MWS in early August and testing began August 15.
Summary of Test Results
The test results are provided at the conclusion of this report. A total of ten composite samples were
taken over a four month period. The field measurements were taken on each of the grab samples
that where used to make up the composite sample. The field data showed that the system had
positive impact on pH and Turbidity. pH was consistently on the alkaline side ranging from 6.07 to
8.56 with an average of 7.64. In six of the nine tests, pH was reduced an average of 0.1 to 0.2 and
where readings were on the acidic side at the inlet, the pH was increased after going through the
MWS as much as 0.5 closer to neutral.
Turbidity entering the system averaged 23.3 ntu and was high as 48.4 ntu. Water exiting the
system showed a marked improvement in clarity averaging 8.4 ntu and was low as 0.34 ntu. The
MWS reduced the turbidity at an average of 62%.
Positive outcomes indicate the system is working very well in reducing copper, zinc, total
suspended solids (TSS), and total petroleum hydrocarbons (TPH). It is anticipated that as the
system matures the plants will play a larger role in reducing pollutants. Copper, lead and zinc levels
where entering the system in very low concentration. Copper ranges from 0.06mg/l to 0.02 mg/l,
Lead was < 0.10mg/l, and zinc ranged from 0.11 to 0.38. The outlet levels for copper ranged from
<0.02 to 0.03, this is an average reduction of 52.7%. Lead was entering at concentration below the
detectable limit of <0.10 mg/L and exiting the system at <0.10 mg/L, therefore no removal
efficiency could be established. Zinc level was also low at the inlet ranging from 0.11 to 0.38. The
zinc leaving the system was greatly reduced down to levels of <0.05 to a high of 0.06. Zinc
reductions averaged 79%. TSS was significantly reduced by MWS. A particle size analysis was
performed on the influent end of the system; 82% of the particles where less than 15 microns in
size. TSS entered the inlet with levels ranging from 22 to 92 mg/L; the outlet levels ranged form
0.13 to 17. TSS reductions averaged of 81.9%. TPH, which includes gasoline, diesel and motor
oil, were present in the inlet water and could be visibly seen. Average reduction of gasoline was
42.5%. Reduction of diesel and motor oil was 100% during one sample; there where no influent
concentrations during other sample periods. The nitrate-n seemed to have a significant reduction in
the range of 69% to 83% in four out of the five test run. Average nitrate-n reductions where 76.1%.
Testing was performed for three different bacteria: fecal coliform, e.coli, and enterococci. One set
of samples where taken on 7/7/2008. The results are very promising with an 84% reduction in fecal
coliform, 79% for enterococci, and 70% for E. coli. Overall there still appears to be a significant
lowering of the bacteria levels due to the MWS. As the system matures, it is felt that bacteria
levels should reduce even further.
Conclusion
With the testing that has been done to date we can show that the MWS has the ability to
significantly reduce copper, zinc, total suspended solids(TSS), turbidity, and Total petroleum
Modular Wetlands Study In Oceanside Harbor
7
hydrocarbons (TPH), bacteria, and nutrients from Stormwater. It also has a positive impact on pH
making the water more neutral. As the system’s plants mature, it is anticipated these removal rates
will stabilize.
8/1/2008
Particle Size (Microns) Particle Count/100ml Particle Size (Microns) Pececent of Total
5-15 1,220,000.00 5-15 82.2%
15-25 131,300.00 15-25 8.8%
25-50 129,800.00 25-50 8.7%
50-100 2,240.00 50-100 0.2%
>100 360.00 >100 0.0%
1483700.00
Particle Distribution Particle Distribution
TSS - Particle Size Distribution
0.0%
10.0%
20.0%
30.0%
40.0%
50.0%
60.0%
70.0%
80.0%
90.0%
5-15 15-25 25-50 50-100 >100
Particle Size ( Microns)
Percent of Total
5/30/2008 5/30/2008
Nitrate-N TSS Copper Lead Zinc TPH-Gasoline TPH-Diesel TPH-Motor Oil
0.00 43.00 0.03 0.10 0.36 0.14 0.00 0.43
0.00 3.00 0.02 0.10 0.05 0.00 0.00 0.00
6/12/2008 6/12/2008
Nitrate-N TSS Copper Lead Zinc TPH-Gasoline TPH-Diesel TPH-Motor Oil
0.00 40.00 0.06 0.10 0.18 0.00 0.00 0.50
0.00 0.13 0.03 0.10 0.05 0.00 0.00 0.00
6/14/2008 6/14/2008
Nitrate-N TSS Copper Lead Zinc TPH-Gasoline TPH-Diesel TPH-Motor Oil
0.00 22.00 0.04 0.10 0.11 0.00 0.00 0.00
0.00 4.00 0.02 0.10 0.05 0.00 0.00 0.00
6/20/2008 6/20/2008
Nitrate-N TSS Copper Lead Zinc TPH-Gasoline TPH-Diesel TPH-Motor Oil
0.00 68.00 0.04 0.10 0.11 0.00 0.00 0.00
0.00 4.00 0.02 0.10 0.05 0.00 0.00 0.00
7/7/2008 7/7/2008
Nitrate-N TSS Copper Lead Zinc TPH-Gasoline TPH-Diesel TPH-Motor Oil Fecal Coliforms Enterococci E.coli
0.97 92.00 0.02 0.10 0.25 0.00 0.00 0.00 50,000.00 250.00 2,851.00
0.16 17.00 0.02 0.10 0.05 0.00 0.00 0.00 8,000.00 52.00 860.00
7/18/2008 7/18/2008
Nitrate-N TSS Copper Lead Zinc TPH-Gasoline TPH-Diesel TPH-Motor Oil
0.93 52.00 0.10 0.23 0.00 0.00 0.00
0.28 17.00 0.10 0.05 0.00 0.00 0.00
8/1/2008 8/1/2008
Nitrate-N TSS Copper Lead Zinc TPH-Gasoline TPH-Diesel TPH-Motor Oil
<0.05 35.00 0.04 0.10 0.38 0.00 2.65 6.13
0.07 5.00 0.02 0.10 0.06 0.00 0.00 0.00
8/15/2008 8/15/2008
Nitrate-N TSS Copper Lead Zinc TPH-Gasoline TPH-Diesel TPH-Motor Oil
0.85 32.00 0.02 0.10 0.23 1.29 0.00 0.06
0.17 6.00 0.02 0.10 0.05 0.65 0.00 0.00
8/28/2008 8/28/2008
Nitrate-N TSS Copper Lead Zinc TPH-Gasoline TPH-Diesel TPH-Motor Oil
0.92 27.00 0.04 0.10 0.18 0.55 0.00 0.39
0.21 18.00 0.02 0.10 0.05 0.49 0.00 0.00
Average Inlet 0.74 43.67 0.04 0.10 0.24 0.22 0.29 0.83 50000.00 250.00 2851.00
Average Outlet 0.18 8.24 0.02 0.10 0.05 0.13 0.00 0.00 8000.00 52.00 860.00
% Change -76.1 -81.1 -52.8 0.0 -79.2 -42.5 -100.0 -100.0 -84.0 -79.2 -69.8