Water quality and pollution status of Chambal river in National Chambal sanctuary, Madhya Pradesh pdf
Bạn đang xem bản rút gọn của tài liệu. Xem và tải ngay bản đầy đủ của tài liệu tại đây (791.4 KB, 10 trang )
Journal of Environmental Biology
September, 2008
O
n
l
i
n
e
C
o
p
y
O
n
l
i
n
e
C
o
p
y
O
n
l
i
n
e
C
o
p
y
O
n
l
i
n
e
C
o
p
y
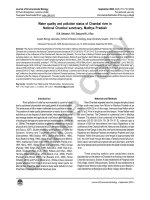
Water quality and pollution status of Chambal river in
National Chambal sanctuary, Madhya Pradesh
D.N. Saksena*, R.K. Garg and R.J. Rao
Aquatic Biology Laboratory, School of Studies in Zoology, Jiwaji University, Gwalior - 474 011, India
(Received: February 04, 2006; Revised received: July 15, 2006; Accepted: September 09, 2006)
Abstract: The physico-chemical characteristics of Chambal river water in National Chambal sanctuary (Madhya Pradesh) have been studied. The stretch of
Chambal river contained in the National Chambal sanctuary (located at 25
0
23’-26
0
52’N, 76
0
28’-79
0
15’ E) is extending up to 600 km downstream from Kota
(Rajasthan) to the confluence of the Chambal with Yamuna river (Etawah). The river flow in Madhya Pradesh spans up to approximately 400 km. Three
sampling stations viz., Station A-near Palighat, district Sheopurkalan, Station B-near Rajghat, district Morena and Station C-near Baraighat, district Bhind
were established for the collection of water samples during April, 2003 to March, 2004. The water quality parameters namely transparency (12.12 - 110 cm),
colour (transparent-very turbid), turbidity (1-178 TNU), electrical conductivity (145.60-884 µS cm
-1
), total dissolved solids (260-500 mgl
-1
), pH (7.60-9.33),
dissolved oxygen (4.86-14.59 mgl
-1
), free carbon dioxide (0-16.5 mgl
-1
), total alkalinity (70-290 mgl
-1
), total hardness (42-140 mgl
-1
), chloride (15.62-80.94 mgl
-1
),
nitrate (0.008-0.025 mgl
-1
), nitrite (0.002-0.022 mgl
-1
), sulphate (3.50-45 mgl
-1
), phosphate (0.004-0.050 mgl
-1
), silicate (2.80-13.80 mgl
-1
), biochemical oxygen
demand (0.60-5.67 mgl
-1
), chemical oxygen demand (2.40-26.80 mgl
-1
), ammonia (nil-0.56 mgl
-1
), sodium (14.30-54.40 mgl
-1
) and potassium (2.10 mgl
-1
-6.30
mgl
-1
) reflects on the pristine nature of the river in National Chambal sanctuary. On the basis of various parameters studied, Chambal river in this stretch can
be placed under the category of oligosaprobic. The water quality analysis, indicated that the river water in the sanctuary area is pollution free and can serve
as a good habitat for many aquatic animals including endangered species.
Key words: Chambal river, Water quality, Pollution status, Sanctuary area
PDF of full length paper is available with author (*)
Introduction
River pollution in India has now reached to a point of crisis
due to unplanned urbanization and rapid growth of industrialization.
The entire array of life in water is affected due to pollution in water.
The problem of water quality deterioration is mainly due to human
activities such as disposal of dead bodies, discharge of industrial
and sewage wastes and agricultural runoff which are major cause
of ecological damage and pose serious health hazards ( Meitei et
al., 2004a). The degree of pollution is generally assessed by studying
physical and chemical characteristics of the water bodies (Duran
and Suicnz, 2007). Studies related to water pollution of rivers like
Godavari, Krishna and Tungbhdra (Mitra, 1982), Cauvery
(Somashekar, 1985; Batcha, 1997), Jhelum (Raina et al., 1984),
Kosi (Bhatt and Negi, 1985), Morar (Kalpi) (Saksena and Mishra,
1991), Alaknanda (Tiwari et al., 1991), Brahamani (Panda et al.,
1991; Mitra, 1997), Betwa (Datar and Vashishtha, 1992), Ganga
(Pandey, 1985; Singh et al., 1999; Sahu et al., 2000; Rao et al.,
2000), Godavari (Rao et al., 1993; Rafeeq and Khan, 2002),
Yamuna (Meenakshi et al., 2002; Anand et al., 2006), Pachin
(Hussain and Ahmed, 2002), Irai (Sawane et al., 2004), Tansa
(Shaikh, 2004) and Purna (Meitei et al., 2004a,b) have received
greater attention from time to time and during recent years. An
attempt has, therefore, been made to study water pollution in river
Chambal in National Chambal Sanctuary area.
Materials and Methods
River Chambal originated near the Janapao temple at about
24 km south-west away from Mhow iin Madhya Pradesh at an
elevation of 854.35 m. At the origin, there are three Nallah which
are 1.6 to 2.4 km in length around the temple. These Nallah meet
the river Chambal. The Chambal is a perennial river in Madhya
Pradesh. The stretch of river contained in the National Chambal
sanctuary (25
o
23’-26
o
52’N, 76
o
28’-79
o
15’ E) extends upto a
distance of 600 km downstream from Kota (Rajasthan) to the
confluence of the Chambal with the Yamuna river (Etawah) a major
tributary of river Ganga. In fact, this river forms the boundary between
Rajasthan and Madhya Pradesh and Madhya Pradesh and Uttar
Pradesh. Within the sanctuary (river length of approximately 600
km), the river flows through the areas of deeply eroded alluvium.
Stony rapid, sand banks and gravel bars are abundant, and there
are many steeps banks and bends where the depth of water exceeds
10 m.
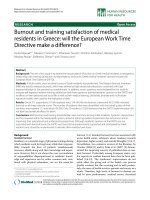
Three sampling stations were established almost
equidistantly on the stretch of Chambal river flowing in the National
Chambal sanctuary. Station-A was established at Palighat (near
Pali village, district Sheopurkalan), Station-B was established at
Rajghat (near Morena road bridge, district Morena) and Station-C
was established at Baraighat (near Barai village, district Bhind).
Journal of Environmental Biology September 2008, 29(5) 701-710 (2008)
©Triveni Enterprises, Lucknow (India) For personal use only
Free paper downloaded from: www. jeb.co.in Commercial distribution of this copy is illegal
Journal of Environmental Biology
September, 2008
O
n
l
i
n
e
C
o
p
y
O
n
l
i
n
e
C
o
p
y
O
n
l
i
n
e
C
o
p
y
O
n
l
i
n
e
C
o
p
y
Saksena et al.
Beyond this station river Chambal joins to the river Yamuna at
Pachnada (Fig. 1). The water samples were collected from all the
three sampling stations established on Chambal river from April,
2003 to March, 2004. The monthly samples of subsurface water
were collected during first week of each month in the early hours of
the day i.e. between 7 am to 9 am Utmost care was taken to avoid
spilling of water and air bubbling at the time of sample collection.
Iodine treated polyethylene double stoppard bottles were used for
collection of sample. Some of the physico-chemical characteristics of
water including water temperature, depth, color, transparency, flow
rate, pH, dissolved oxygen, free carbon dioxide, total alkalinity,
total hardness, chloride, calcium and magnesium were determined
at the sampling stations, while other parameters including turbidity,
electrical conductivity, total dissolved solids, nitrate, nitrite, sulphate,
phosphate, silicate, biochemical oxygen demand, chemical oxygen
demand, ammonia, sulphide, sodium and potassium were analyzed
in the laboratory within 4 to 6 hr of collection. The physico-chemical
characteristics of water were analyzed according to the methods of
APHA (2005) and Trivedy and Goel (1984).
Results and Discussion
The physico-chemical characteristics provide a fair idea of
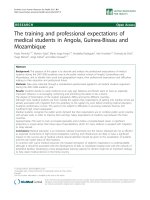
the water quality in any water body. The result of the physico-
chemical characteristics of Chambal river water are summarized in
Table 1 and shown in Fig. 2 to 27.
Temperature is basically important for its effects on certain
chemical and biological reactions taking place in water and aquatic
organisms (Shrivastava and Patil, 2002). It depends upon the
season, time of sampling and also upon the temperature of effluents
which are being added in to the river. Mean annual water
temperature in Chambal river was given in Table 1. The low water
temperature was recorded in winter, while highest was recorded in
summer. Similar seasonal variation in water temperature was
recorded by Batcha (1998) in river Cauvery, Singh et al. (1999) in
river Ghaghara, Nath and Srivastava (2001) in river Narmada,
Shrivastava and Patil (2002) in river Tapti and Meitei et al. (2004a)
in river Purna.
Transparency or light penetration depends on the intensity
of sunlight, suspended soil particles, turbid water received from
catchment area and density of plankton etc. (Mishra and Saksena,
1991; Singh, 1999; Kulshrestha and Sharma, 2006). Transparency
of a river water is also affected due to total solids partly or fully
decomposed organic matters, silts and turbulence caused by the
currents, waves, human and cattle activities (Singh et al., 1999).
Seasonal impact was also seen on water transparency indicating
higher values during winter and summer seasons, whereas lower
values are evident in monsoon season. The transparency values
were less in monsoon season due to high current which erodes the
bank of the river and due to turbid flood water, suspended matter
Fig. 1: National Chambal Sanctuary, Madhya Pradesh
702
Journal of Environmental Biology
September, 2008
O
n
l
i
n
e
C
o
p
y
O
n
l
i
n
e
C
o
p
y
O
n
l
i
n
e
C
o
p
y
O
n
l
i
n
e
C
o
p
y
Water quality and pollution status of Chambal river
Table - 1: Analysis of physico-chemical parameters of Chambal river
Station-A (Palighat) Station-B (Rajghat) Station-C (Baraighat)
Sl. Parameter Unit Range of variation Mean and standard Range of variation Mean and standard Range of variation Mean and standard
No. deviation deviation deviation
Min. Max. Min. Max. Min. Max.
1 Water temperature
0
C 17.60 31.00 26.47 ± 4.09 17.90 33.00 26.75 ± 4.44 18.10 32.10 26.69 ± 4.33
2 Transparency cm 15.50 100.00 67.66 ± 33.93 12.12 106.20 78.13 ± 34.50 17.00 110.00 82.48 ± 35.38
3 Flow rate cm sec
-1
12.50 36.00 19.70 ± 7.58 6.00 45.00 19.80 ± 12.09 6.10 46.00 29.68 ± 11.83
4 Colour V.T Transp. - Transp. V.T - Transp. V.T. -
5 Depth m 3.32 9.26 6.27 ± 2.25 3.40 5.88 4.79 ± 0.75 1.47 8.38 2.97 ± 2.40
6 Turbidity NTU 1.60 86.30 20.15 ± 24.92 1.35 178.00 29.80 ± 53.38 1.00 107.00 19.70 ± 29.82
7 Electrical conductivity µS cm
-1
145.60 403.20 283.00 ± 91.98 100.00 666.40 370.60 ± 179.99 168.00 884.00 408.33 ± 248.69
8 Total dissolved solids mgl
-1
270.00 460.00 325.58 ± 61.13 260.00 450.00 315.58 ± 59.90 260.00 500.00 307.33 ± 64.64
9 pH - 7.90 9.33 8.24 ± 0.38 8.10 8.92 8.30 ± 0.23 7.60 8.98 8.36 ± 0.34
10 Dissolved oxygen mgl
-1
4.86 10.33 7.66 ± 1.64 5.06 11.75 7.88 ± 2.03 5.37 14.59 8.22 ± 2.71
11 Free carbon dioxide mgl
-1
Nil 3.30 1.63 ± 0.57 Nil 6.60 3.02 ± 1.70 Nil 16.50 2.81 ± 5.46
12 Total alkalinity mgl
-1
72.50 275.00 145.83 ± 63.88 70.00 270.00 159.30 ± 60.32 75.00 290.00 171.04 ± 62.97
13 Total hardness mgl
-1
42.00 94.00 74.96 ± 16.95 52.00 134.00 104.31 ± 26.45 62.00 140.00 106.54 ± 26.12
14 Chloride mgl
-1
15.62 59.64 29.41 ± 15.14 16.33 39.76 28.87 ± 7.29 18.46 80.94 42.16 ± 23.68
15 Calcium mgl
-1
9.61 31.26 22.50 ± 5.73 17.63 44.08 27.98 ± 7.61 19.23 34.46 24.95 ± 5.07
16 Nitrates mgl
-1
0.008 0.024 0.014 ± 0.004 0.012 0.025 0.016 ± 0.003 0.010 0.021 0.0155 ± 0.003
17 Nitrites mgl
-1
0.002 0.022 0.014 ± 0.005 0.006 0.020 0.011 ± 0.003 0.010 0.017 0.012 ± 0.002
18 Sulphates mgl
-1
8.50 40.40 27.07 ± 8.85 14.00 42.00 31.11 ± 9.34 3.50 45.00 24.60 ± 13.59
19 Phosphates mgl
-1
0.005 0.030 0.018 ± 0.006 0.006 0.050 0.023 ± 0.012 0.004 0.045 0.018 ± 0.009
20 Silicates mgl
-1
2.80 13.80 8.03 ± 2.95 4.00 13.50 7.36 ± 2.43 3.80 12.60 7.00 ± 2.88
21 BOD mgl
-1
0.81 3.24 1.76 ± 0.83 1.01 5.67 2.12 ± 1.37 0.60 3.24 1.87 ± 0.78
22 COD mgl
-1
24.40 26.80 10.98 ± 6.76 4.00 22.50 11.60 ± 5.79 4.00 17.60 8.33 ± 4.60
23 Ammonia mgl
-1
Nil 0.56 0.09 ± 0.16 Nil 0.56 0.151 ± 0.14 Nil 0.54 0.15 ± 0.18
24 Sulphides mgl
-1
Nil 0.14 0.015 ± 0.00 Nil 0.28 0.058 ± 0.040 Nil 0.28 0.035 ± 0.00
25 Magnesium mgl
-1
2.43 8.28 461.00 ± 1.84 1.70 20.17 8.64 ± 5.79 1.08 14.13 10.92 ± 4.89
26 Sodium mgl
-1
15.20 52.80 4.56 ± 9.95 26.80 48.80 38.00 ± 6.30 14.30 54.40 39.02 ± 11.55
27 Potassium mgl
-1
3.10 6.10 4.22 ± 1.03 3.40 6.10 4.89 ± 0.97 2.10 6.30 4.51 ± 1.41
Transp. = Transparent, V.T. = Very turbid. n = 12
703
Journal of Environmental Biology
September, 2008
O
n
l
i
n
e
C
o
p
y
O
n
l
i
n
e
C
o
p
y
O
n
l
i
n
e
C
o
p
y
O
n
l
i
n
e
C
o
p
y
Station-A Station-B
Station-C
Saksena et al.Saksena et al.Saksena et al.
Fig. 4: Flow rate
0
10
20
30
40
50
A M J J A S O N D J F M
Months
cm /sec.
Fig. 2: Water temperature
0
5
10
15
20
25
30
35
A M J J A S O N D J F M
Months
0
C
Fig. 3: Transparancy
0
20
40
60
80
100
120
A M J J A S O N D J F M
Months
cm
Fig. 5: Depth
0
2
4
6
8
10
A M J J A S O N D J F M
Months
cm
Fig. 6: Turbidity
0
50
100
150
200
A M J J A S O N D J F M
Months
NTU
Fig. 8: Total dissolved solids
0
100
200
300
400
500
600
A M J J A S O N D J F M
Months
mgl
-1
Fig. 7: Electrical conductivity
0
200
400
600
800
1000
A M J J A S O N D J F M
Months
µS/cm
Fig. 9: pH
0
1
2
3
4
5
6
7
8
9
10
A M J J A S O N D J F M
Months
Fig. (2-9): Results of physico-chemical characteristics of river Chambal
Fig. 3: Transparency
704
µ
µ
µ
µS cm
-1
cm sec.
-1
Journal of Environmental Biology
September, 2008
O
n
l
i
n
e
C
o
p
y
O
n
l
i
n
e
C
o
p
y
O
n
l
i
n
e
C
o
p
y
O
n
l
i
n
e
C
o
p
y
Station-A Station-B
Station-C
Water quality and pollution status of Chambal riverWater quality and pollution status of Chambal riverWater quality and pollution status of Chambal river
Fig. 10: Dissolved oxygen
0
2
4
6
8
10
12
14
16
A M J J A S O N D J F M
Months
mgl
-1
Fig. 11: Free carbon dioxide
0
2
4
6
8
10
12
14
16
18
A M J J A S O N D J F M
Months
mgl
-1
Fig. 12: Total alkalinity
0
50
100
150
200
250
300
350
A M J J A S O N D J F M
Months
mgl
-1
Fig. 13: Total hardness
0
20
40
60
80
100
120
140
160
A M J J A S O N D J F M
Months
mgl
-1
Fig. 14: Cloride
0
10
20
30
40
50
60
70
80
90
A M J J A S O N D J F M
Months
mgl
-1
Fig. 15: Calcium
0
10
20
30
40
50
A M J J A S O N D J F M
Months
mgl
-1
Fig. 16: Nitrate
0
0.005
0.01
0.015
0.02
0.025
0.03
A M J J A S O N D J F M
Months
mgl
-1
Fig. 17: Nitrite
0
0.005
0.01
0.015
0.02
0.025
A M J J A S O N D J F M
Months
mgl
-1
Fig. (10-17): Results of physico-chemical characteristics of river Chambal
Fig. 14: Chloride
705
Journal of Environmental Biology
September, 2008
O
n
l
i
n
e
C
o
p
y
O
n
l
i
n
e
C
o
p
y
O
n
l
i
n
e
C
o
p
y
O
n
l
i
n
e
C
o
p
y
Saksena et al.Saksena et al.Saksena et al.
Station-A Station-B
Station-C
Fig. (18-25): Results of physico-chemical characteristics of river Chambal
Fig. 18: Sulphate
0
10
20
30
40
50
A M J J A S O N D J F M
Months
mgl
-1
Fig. 19: Phosphate
0
0.01
0.02
0.03
0.04
0.05
0.06
A M J J A S O N D J F M
Months
mgl
-1
Fig. 20: Silicate
0
2
4
6
8
10
12
14
16
A M J J A S O N D J F M
Months
mgl
-1
Fig. 21: Biochem ical oxygen demand
0
1
2
3
4
5
6
A M J J A S O N D J F M
Months
mgl
-1
Fig. 22: Chemical oxygen dem and
0
5
10
15
20
25
30
A M J J A S O N D J F M
Months
mgl
-1
Fig. 23: Amm onia
0
0.1
0.2
0.3
0.4
0.5
0.6
A M J J A S O N D J F M
Months
mgl
-1
Fig. 24: Sulphide
0
0.05
0.1
0.15
0.2
0.25
0.3
A M J J A S O N D J F M
Months
mgl
-1
Fig. 25: Magnesium
0
5
10
15
20
25
A M J J A S O N D J F M
Months
mgl
-1
706
Journal of Environmental Biology
September, 2008
O
n
l
i
n
e
C
o
p
y
O
n
l
i
n
e
C
o
p
y
O
n
l
i
n
e
C
o
p
y
O
n
l
i
n
e
C
o
p
y
and dissolved particles. High value of transparency was recorded
in late post monsoon and winter months as has also been observed
by Singh et al. (1999), Nath and Srivastava (2001) and Shaikh
and Yeragi (2004). Flow rate of water bodies generally depends
upon the amount of water available and on its depth. Mean annual
flow rate in Chambal river was found to be minimum (6.0 cm sec
-1
)
at Station-B in the month of February and maximum (46.00 cm sec
-1
)
at Station-C in the month of September.
The colour of river water was very much turbid in monsoon
season and except for monsoon season, the colour of water was
transparent. The minimum depth (1.47 m) of river water was
recorded at Station-C in the month of March while maximum depth
(9.26 m) was recorded in the month of August at Station-A. The
minimum turbidity (1.00 NTU) was recorded at Station-C in the
month of March and maximum turbidity (178.00 NTU) was recorded
at Station-B in the month of August.
Conductivity is the measure of capacity of a substance or
solution to conduct electrical current through the water. In the present
study, lowest conductivity value (145.60 µS cm
-1
) was observed at
Station-A in the month of September and highest value of conductivity
(884 µS cm
-1
) was observed at Station-C in the month of May. Total
dissolved solids are composed of carbonates, bicarbonates,
chlorides, sulphates, phosphates and nitrates of Ca, Mg, Na, K,
and Mn and organic matter, salts and others particles (Mishra and
Saksena, 1991). Minimum total dissolved solids (260 mgl
-1
) were
recorded at Station-B and Station-C, while maximum value (500
mgl
-1
) was recorded at Station-C in the month of September.
Ellis (1937) has observed that a pH range of 6.7 to 8.4 is
suitable for the growth of aquatic biota. The water in Chambal River
was always alkaline throughout the period of study. Alkaline pH was
also observed by Shaikh and Yeragi (2004) in river Tansa during
whole study period, while Varma (1998) have observed acidic
nature of water of Subernarekha river due to discharge of copper
industrial effluents in this river. The minimum pH value (7.60) was
recorded at Station-C in the month of October and maximum pH
(9.33) was recorded at Station-A in the month of June.
Dissolved oxygen is one of the important parameter in water
quality assessment. Its presence is essential to maintain variety of
forms of biological life in the water and the effect of waste discharge
in a water body is largely determined by the oxygen balance of the
system. Dissolved oxygen is regulator of metabolic activities of
organisms and thus governs metabolism of the biological community
as a whole and also acts as an indicator of trophic status of the water
body (Saksena and Kaushik, 1994). Oxygen is generally reduced
in the water due to respiration of biota, decomposition of organic
matter, rise in temperature, oxygen demanding wastes and inorganic
reductant such as hydrogen sulphide, ammonia, nitrites, ferrous
iron, etc. (Sahu et al., 2000). Inorganic reducing agents such as
hydrogen sulphide, ammonia, nitrite, ferrous iron and certain
oxidizable substances also tend to decrease dissolved oxygen in
water. Tarzwell (1957) has suggested that a minimum of 3 mgl
-1
dissolved oxygen is necessary for healthy fish and other aquatic
life. In the present study, the minimum value of dissolved oxygen
was recorded as 4.86 mgl
-1
at Station-A in the month of August and
maximum recorded as 14.59 mgl
-1
at Station-C in the month of
November. This level of oxygen in the river should be able to
support good fauna and flora. Similar observation was recorded by
Singh and Rai (1999) in river Ganga, Hiware and Jadhav (2001)
in river Manjar, Rafeeq and Khan (2002) in river Godavari. The
pH, alkalinity and free carbon dioxide are interrelated in aquatic
ecosystems. Most of the free carbon dioxide
in water comes from
the decomposition of organic matter and from respiration of organisms
(Singh, 1999). In polluted water, the free carbon dioxide is generally
high. In Chambal river, free carbon dioxide
ranged from non
traceable amount at all stations to the maximum value of 16.50 mgl
-
1
at Station-C in the month of August. Good oxygen saturation and
low free carbon dioxide indicate no pollution load in the river at all
Stations.
Ganapati (1943) attributed that the changes in the values of
bicarbonates are associated with the rate of photosynthetic activity.
Klein (1959), Shrivastava and Patil (2002) suggested that the
alkalinity is directly related to the abundance of phytoplankton which
dissociate bicarbonate into carbonates and carbon dioxide. The
carbon dioxide, thus, released is used in photosynthesis. George
et al. (1966) have opined that with a pH range of 7.0 to 9.0 in water
bodies, the bicarbonates concentration remains high. The lowest
level of total alkalinity in the Chambal river was 70.0 mgl
-1
at Station-B in
the month of October and highest level was 290.0 mgl
-1
at
Water quality and pollution status of Chambal riverWater quality and pollution status of Chambal riverWater quality and pollution status of Chambal river
Station-A Station-B
Station-C
Fig. (26-27): Results of physico-chemical characteristics of river Chambal
707
Fig. 26: Sodium
0
10
20
30
40
50
60
A M J J A S O N D J F M
Months
mgl
-1
Fig. 27: Potassium
0
1
2
3
4
5
6
7
A M J J A S O N D J F M
Months
mgl
-1
mgl
-1
Journal of Environmental Biology
September, 2008
O
n
l
i
n
e
C
o
p
y
O
n
l
i
n
e
C
o
p
y
O
n
l
i
n
e
C
o
p
y
O
n
l
i
n
e
C
o
p
y
Station-C in the month of June. Similar seasonal variations have
been recorded by Singh and Rai (1999) in river Ganga at Varanasi.
Cation of calcium, magnesium, iron and manganese
contribute to the hardness of water (Shrivastava and Patil, 2002).
Barrett (1953) has reported that the hard waters are more productive
than the soft water from fisheries point of view. The minimum value
of total hardness in the river was 42.00 mgl
-1
at Station-A in the
month of June and maximum value was 140.0 mgl
-1
at Station-C in
the month of November.
Chloride concentration in water indicates the presence of
organic waste in water, primarily of animal origin (Thresh et al.,
1949). It increases with ammonical nitrogen which also owes itself
mostly to animal excreta. Chloride in Chambal river varied from
15.62 mgl
-1
at Station-A in the month of August to 80.94 mgl
-1
at
Station-C in the month of May. The chloride concentration was quite
low in this river which reflects that there is very less amount of
organic waste of animal origin and practically no discharge of
municipal and industrial wastes. The calcium is one of the most
abundant substances of natural water being present in high quantities
in the rocks. The disposal of sewage and industrial wastes are also
important sources of calcium. The calcium level in the river varied
from 9.61 to 44.08 mgl
-1
during April to March.
Alderfer and Lovelace (1977) believed that inorganic
nitrogen above 0.03 mgl
-1
stimulates algal growth to such an extent
that water may not be suitable for human consumption. In the river
under study, nitrate from to 0.008 mgl
-1
at Station-A in the month of
March to 0.025 mgl
-1
at Station-B in the month of October was
recorded. Nitrate-N was found to be quite low during the present
investigation which reflects that the river does not receive any waste
water. Nitrite in the river varied from 0.002 mgl
-1
at Station-A in the
month of March to 0.022 mgl
-1
at Station-A in the month of October,
2003. Sulphate in the river varies from minimum of 3.50 mgl
-1
at
Station-C
to maximum of 45.00 mgl
-1
at Station-C in the month of
March.
Major source of phosphate in water are domestic sewage,
agriculture effluents and industrial waste waters. The high
concentration of phosphate is, therefore, indicative of pollution. In
Chambal river, phosphate was recorded from 0.004 mgl
-1
at Station-C
in the month of September to 0.050 mgl
-1
at Station-B in the month of
October. Sinha et al. (1998) have reported higher phosphate content
in lower stretch of Ganga river during monsoon season.
Silica is quite abundant on the earth but silicates remain
meager in water. The major source of dissolved silica in river is the
weathering of rocks and mineral in the catchments area. Silicate is an
essential nutrient for growth of diatoms that are important food to fishes
(Nath and De, 1998; Nath and Srivastava, 2001; Johnson, 2004).
In Chambal river, silicates fluctuated from 2.80 mgl
-1
to 13.80 mgl
-1
.
Biochemical oxygen demand (BOD), a pollution indicator,
showed its level in river from 0.60 mgl
-1
at Station-C to 5.67 mgl
-1
at
Station-B. Low BOD content indicated that the riverine stretch was
free from organic pollution. Fokmare and Musaddiq (2002)
recorded high value of biochemical oxygen demand (BOD) as
20.00 mgl
-1
in river Purna and said that this river is highly polluted
due to organic enrichment, decay of plants and animal matter in
the river. Chemical oxygen demand (COD) gives us a reliable
parameter for judging the extent of pollution in water (Shrivastava
and Patil, 2002). COD is the measure of the oxygen required for
chemical oxidation of organic matter. In this river, maximum value
of COD (26.80 mgl
-1
)
at Station-A during May and minimum value
(2.40 mgl
-1
) at Station- A in July have been recorded. This also
provides a direct measure of state of pollution in water bodies
(Kulshrestha and Sharma, 2006).
Table - 2: Comparison of physico-chemical parameters of Chambal river with that of Indian standards
IS-2296: 1974
S. No. Parameters Present study on
Public water supply Fish culture Irrigation
Chambal river
1 Turbidity (NTU) 1.00-178.00 10(IS: 10500:1991)
2 Electrical conductivity (µS cm
-1
) 100.00-884.00 1000.00
3 Total dissolved solids (mgl
-1
) 260.00-500.00 500 2100.00
4 pH 7.6-9.33 6.00-9.00 6.00-9.00 5.50-9.00
5 Dissolved oxygen (mgl
-1
) 4.86-14.59 >4.00 >3.00
6 Free carbon dioxide (mgl
-1
) 0.00-16.50 6.00
7 Total alkalinity (mgl
-1
) 70.00-290.00 200-600 (IS-10500:1991)
8 Total hardness (mgl
-1
) 42.00-140.00 300-600 (IS-10500:1991)
9 Chlorides (mgl
-1
) 15.62-80.94 600.00 600.00
10 Calcium (mgl
-1
) 9.61-44.08 74-200 (IS-10500:1991)
11 Nitrates (mgl
-1
) 0.008-0.025 50.00
12 Nitrites (mgl
-1
) 0.002-0.022 0.020
13 Sulphates (mgl
-1
) 3.50-45.00 200-400 (IS-10500:1991) 1000.00
14 BOD (mgl
-1
) 0.60-5.67 3.00
15 Ammonia (mgl
-1
) 0.00-0.56 1.20
16 Sodium (mgl
-1
) 14.30-54.40 200
Saksena et al.Saksena et al.Saksena et al.708
Journal of Environmental Biology
September, 2008
O
n
l
i
n
e
C
o
p
y
O
n
l
i
n
e
C
o
p
y
O
n
l
i
n
e
C
o
p
y
O
n
l
i
n
e
C
o
p
y
The presence of ammonia is an evidence of sewage inflow
to a water body. However, free ammonia serves as an indicator of
aquatic pollution was generally absent or found in traces during
most occasions in Narmada river (Nath and Srivastava, 2001).
Chambal river had a range of ammonia concentration between nil
at all stations to 0.56 mgl
-1
at Station-A and B in the month of February,
2004. Ammonia in present case indicates no pollution at various
stations in the river. Sulphide indicates the amount of organic matter
present in water, degradable by sulphur bacteria. Chambal river
water, however, showed a range from untraceable amount of sulphide
at all stations to a maximum value of 0.28 mgl
-1
at Station-B and C in
the month of March.
Magnesium in Chambal river varies from 1.70 to 20.17
mgl
-1
during the period of study. Sodium is one of the important
cation occurring naturally. Sodium concentration in irrigation water
and soil is of great interest as high sodium contents makes soil hard
to plough and unsuitable for seedling emergence. Chambal water
had sodium concentration from 14.30 mgl
-1
at Station-C in the month
of August to 54.40 mgl
-1
at Station-C in the month of June and
potassium level from 2.10 mgl
-1
at Station-C in the month of August to
6.30 mgl
-1
at Station-B in the month of December, suggesting their
moderate but harmless concentration.
On the basis of various parameters studied, Chambal
river in this stretch can be placed under oligosaprobic. When
various parameters of our study are compared with that of Indian
standards (IS,1974, 1991) for public water supply, fish culture
and irrigation, it was revealed that all such parameters are well
within the limits (Table 2). The water characteristics considered
for the study indicate that the river water in the National Chambal
Sanctuary is pollution free and can serve as a good habitat for
many aquatic animals including endangered species.
Acknowledgments
We are thankful to the University Grants Commission, Delhi
for financial support Under SAP-DRS-I (No. F03-07.2002 SAP-II)
to School of Studies in Zoology, Jiwaji University, Gwalior (M.P.).
We also extend our gratitude to the Coordinator, DRS-SAP and the
Head, School of Studies in Zoology for providing all necessary
facilities for conducting this research work.
References
Alderfer, R.G. and K. Lovelace: In: Handbook of water and quality management
planning (Ed.: J.L. Pavoni). Von Nastard, New York (1977).
Anand, Chetna, Pratima Akolkar and Rina Chakrabarti: Bacteriological water
quality status of river Yamuna in Delhi. J. Environ. Biol., 27, 97-101
(2006).
APHA: Standard methods for examination of water and wastewater. 21
st
Edn., Washington, DC (2005).
Barrett, P.H.: Relationship between alkalinity and absorption and regeneration
of added phosphorus in fertilized trout lakes. Trans Am. Fish. Soc., 82,
78-90 (1953).
Batcha Anvar, S.M.: Studies on hydrography and domestic pollution problems
in the north bank of river Cauvery. J. Environ. Pollut., 5, 69-71 (1998).
Bhatt, S.D. and U. Negi: Hydrology and phytoplankton population in river
kosi of western Himalaya (U.P.). Ind. J. Ecol., 122, 141-146 (1985).
Datar, M.O. and R.P. Vashishtha: Physico-chemical aspects of pollution in
river Betwa. Ind. J. Environ. Protect., 12, 577-580 (1992).
Duran, Mustafa and Menderes Suicmez: Utilization of both benthic
macroinvertebrates and physicochemical parameters for evaluating
water quality of the stream Cekerek (Tokat, Turkey). J. Environ. Biol.,
28, 231-236 (2007).
Ellis, M.M.: Detection and measurement of stream pollution. U.S. Bur. Fish.
Bull. Washington, 22, 367-437 (1937).
Fokmare, A.K. and M. Musaddiq: A study of physico-chemical characteristics
of Kapsi lake and Purna river waters in Akola district of Maharastra,
India. Nat. Environ. Pollut. Technol., 1, 261-263 (2002).
Ganapati, S.V.: An ecological study of a garden pond containing abundant
zooplankton. Proc. Ind. Acad. Sci., 17, 41-58 (1943).
George, M.G., S.Z. Qasim and S.Q. Siddiqi: A limnological survey of the
river Kali with reference to fish mortality. J. Environ. Hlth., 8, 262-269
(1966).
Hiware, C.J. and B.V. Jadhav: Biological studies of Manjar river near Kallam,
district Osmanabad, Maharastra, India. J. Aqua. Biol., 16, 11-13 (2001).
Hussain, M.F. and I. Ahmed: Variability in physico-chemical parameters of
Pachin river (Itanagar). Ind. J. Environ Hlth., 44, 329-336 (2002).
IS: Tolerance Limits for Inland Surface Waters Subject to Pollution (IS-2296:
1974), ISI New Delhi, India (1974).
IS: Tolerance Limits for Inland Surface Waters Subject to Pollution (IS-1055:
1991), ISI New Delhi, India (1991).
Johnson, M.E.C.: Silica content of two Hyderabad lakes, Andhra Pradesh,
India. J. Aqua. Biol., 19, 61-62 (2004).
Klein, L.: River Pollution. Vol. I. Chemical Analysis. I. Causes and Effects.
Butterworth and Company, London (1959).
Kulshrestha, H. and S. Sharma: Impact of mass bathing during Ardhkumbh
on water quality status of river Ganga. J. Environ. Biol., 27, 437-440
(2006).
Meenakshi, V.K. Garg, K. Yadava, R. Gupta and M. Malik: Water quality
monitoring of western Yamuna canal from Tajewala to Haiderpur treatment
plant, Delhi. Res. J. Chem. Environ., 6, 21-23 (2002).
Meitei, N.S., V. Bhargava and P.M. Patil: Water quality of Purna river in Purna
town, Maharastra state. J. Aqua. Biol., 19, 77-78 (2004a).
Meitei, N.S., P.M. Patil and A.B. Bhosle: Physico-chemical analysis of
Purna river for potability. J. Aqua. Biol., 19, 103-105 (2004b).
Mishra, S.R. and D.N. Saksena: Pollutional ecology with reference to physico-
chemical characteristics of Morar (Kalpi) river, Gwalior (M.P.). In:
Current trends in limnology (Ed.: Nalin K. Shastree). Narendra Publishing
House Delhi, India. pp. 159-184 (1991).
Mitra, A.K.: Chemical characteristics of surface water at selected gauging
stations in the river Godavari, Krishna and Tungabhadra. Ind. Environ.
Hlth., 24, 165-179 (1982).
Mitra, A.K.: Impact of waste water inflow on water quality of river Brahamani.
Ind. J. Environ. Hlth., 39, 257-264 (1997).
Nath, D. and D.K. De: Preliminary studies on the changes in the physico-
chemical characteristics of Hooghly estuary in relation to tides. J.
Inland Fish. Soc. India, 30, 29-36 (1998).
Nath, D. and N.P. Srivastava: Physico-chemical characteristics of Narmada
for the stretch Sandia to Mola in M.P. state in the context of construction
of reservoirs on the river or its tributaries. J. Inland Fish. Soc. India,
33, 17-24 (2001).
Panda, R.B., B.K. Sahu, B.K. Sinha and A. Nayak: Characterization of
Brahmini river water. Ind. J. Environ. Hlth., 33, 252-256 (1991).
Pandey, N.C.: Pollution of river Ganga in U.P. with specific reference to
Varanasi. Civic affairs. 32, 52-59 (1985).
Rafeeq, M.A. and A.M. Khan: Impact of sugar mill effluents on the water
quality of the river Godavari near Kandakurthi village, Nizamabad
district, Andhra Pradesh. J. Aqua. Biol., 17, 33-35 (2002).
Raina, V., A.R. Shah and S.R. Ahmed: Pollution studies on river Jhelum I. An
assessment of water quality. Indian J. Environ. Hlth., 26, 187-201
(1984).
Rao, K.S., D. Pandmrathy and Babu Ram: Monitoring the quality of Godavari
waters during and after the 1991 Pushkaram at Rajamundry. Pollut.
Res., 12, 191-195 (1993).
Water quality and pollution status of Chambal riverWater quality and pollution status of Chambal riverWater quality and pollution status of Chambal river 709
Journal of Environmental Biology
September, 2008
O
n
l
i
n
e
C
o
p
y
O
n
l
i
n
e
C
o
p
y
O
n
l
i
n
e
C
o
p
y
O
n
l
i
n
e
C
o
p
y
Rao, R.J., B.K. Sahu, S.K. Behra and R.K. Pandit: Biomonitoring of pollution
in the Ganga river Uttar Pradesh. In: Pollution and biomonitoring of
Indian rivers (Ed.: R.K. Trivedy). ABD Publication, Jaipur, India. pp.
187-193 (2000).
Sahu, B.K., R.J. Rao, S.K. Behara and R.K. Pandit: Effect of pollutants on the
dissolved oxygen concentration of the river Ganga at Kanpur. In:
Pollution and biomonitoring of Indian rivers (Ed.: R.K. Trivedy). ABD
Publication, Jaipur, India. pp. 168-170 (2000).
Saksena, D.N. and S. Kaushik: Trophic status and habitat ecology of entomo-
fauna of three water bodies at Gwalior, Madhya Pradesh. In: Perspective
in entomological research (Ed.: O.P. Agrawal). Scientific Publishers,
Jodhpur (1994).
Sawane, A.P., P.G. Puranik and A.M. Bhate: Assessment of water quality of
river Irai (District Chandrapur) on the basis of seasonal fluctuations in
dissolved oxygen and biochemical oxygen demand. J. Ecophysiol.
Occup. Hlth., 4, 17-21 (2004).
Shaikh, N. and S.G. Yeragi: Some physico-chemical aspects of Tansa river
of Thane district, Maharastra. J. Aqua. Biol., 19, 99-102 (2004).
Shrivastava, V.S. and P.R. Patil: Tapti river water pollution by industrial
wastes: A statistical approach. Nat. Environ. Pollut. Tech., 1, 279-283
(2002).
Singh, B.N. and S. Rai: Physico-chemical studies of Ganga river at Varanasi.
J. Environ. Pollut., 6, 43-46 (1999).
Singh, H.P.: Limno-chemistry of river Ganga and some of its major tributaries.
J. Inland Fish. Soc. India, 31, 31-35 (1999).
Singh, H.P., L.R. Mahaver and J.P. Mishra: Limnochemical characteristics
of river Ghaghara in U.P. J. Inland Fish. Soc. India, 31, 28-32 (1999).
Sinha, M., D.K. De and B.C. Jha: The Ganga environment and fisheries.
CIFRI, Barrackpore. pp. 142 (1998).
Somashekar, R.K.: Studies on water pollution of river Cauvery: Physico-
chemical characteristics. Intl. J. Environ. Stud., 23, 115-124 (1985).
Tarzwell, C.M.: In: Biological problems in water pollution. U.S. Deptt. of
Health Education and Welfare. P.H.S. pp. 246-272 (1957).
Thresh, J.C., J.F. Beale and E.V. Suckling: The examination of water and
water supplies (Ed.: E.W. Taylor). London (1949).
Tiwari, N.C., G. Sagar, D. Tiwari and H.R. Singh: Monitoring the water
pollution in snow feed river Alaknanda Rudraprayag at Chamoli. Environ.
Ecol., 9, 202-206 (1991).
Trivedy, R.K. and P.K. Goel: Chemical and biological methods for water
pollution studies. Environmental Publications Karad, India (1984).
Varma, C.M.: Chemical and biological evaluation of an industrially polluted
river. J. Environ. Pollut., 5, 181-187 (1998).
Saksena et al.Saksena et al.Saksena et al.710