Báo cáo khoa học: Kinetics of inhibition of acetylcholinesterase in the presence of acetonitrile doc
Bạn đang xem bản rút gọn của tài liệu. Xem và tải ngay bản đầy đủ của tài liệu tại đây (401.52 KB, 16 trang )
Kinetics of inhibition of acetylcholinesterase in the
presence of acetonitrile
Markus Pietsch, Leonie Christian, Therese Inhester, Susanne Petzold and Michael Gu
¨
tschow
Pharmaceutical Chemistry I, Pharmaceutical Institute, University of Bonn, Germany
Acetylcholinesterase (AChE, EC 3.1.1.7) is a serine
hydrolase [1], which belongs to the a ⁄ b hydrolase
family [2,3]. The enzyme hydrolyses a broad range of
ester and amide substrates, showing the highest speci-
ficity for acetylselenocholine, acetylthiocholine (ATCh)
and acetylcholine (ACh) [4]. Substrate cleavage
proceeds via a two-step mechanism: acylation of the
enzyme, followed by deacylation involving a water
molecule [5–7]. This process is mediated by the cata-
lytic triad Ser200–His440–Glu327 (Torpedo californica
AChE, TcAChE, numbering [8]) located within the
active site at the bottom of a 20 A
˚
deep gorge. Sub-
strate binding is facilitated by another component of
the active site, the anionic site, which is characterized
by several conserved aromatic residues, such as Trp84
and Phe330. These residues have been shown to inter-
act with the quaternary ammonium groups of ACh or
ATCh via cation–p interactions [7–12]. Further
stabilization of the quaternary moiety arises from an
electrostatic interaction with the acidic side-chain of
Glu199 [7,12]. A second substrate-binding site, the
peripheral anionic site (PAS), lies essentially on the
Keywords
acetylcholinesterase; enzyme kinetics;
gallamine triethiodide; hyperbolic mixed-type
inhibition; tacrine hydrochloride
Correspondence
M. Pietsch, School of Chemistry & Physics,
The University of Adelaide, Adelaide, SA
5005, Australia
Fax: +61 8 8303 4358
Tel: +61 8 8303 5360
E-mail:
(Received 15 August 2008, revised 10
January 2009, accepted 11 February 2009)
doi:10.1111/j.1742-4658.2009.06957.x
The hydrolysis of acetylthiocholine by acetylcholinesterase from Electro-
phorus electricus was investigated in the presence of the inhibitors tacrine,
gallamine and compound 1. The interaction of the enzyme with the sub-
strate and the inhibitors was characterized by the parameters K
I
, a¢, b or b,
K
m
and V
max
, which were determined directly and simultaneously from
nonlinear Michaelis–Menten plots. Tacrine was shown to act as a mixed-
type inhibitor with a strong noncompetitive component (a¢ % 1) and to
completely block deacylation of the acyl-enzyme. In contrast, acetylcholin-
esterase inhibition by gallamine followed the ‘steric blockade hypothesis’,
i.e. only substrate association to as well as substrate ⁄ product dissociation
from the active site were reduced in the presence of the inhibitor. The rela-
tive efficiency of the acetylcholinesterase–gallamine complex for the cataly-
sis of substrate conversion was determined to be 1.7–25% of that of the
free enzyme. Substrate hydrolysis and the inhibition of acetylcholinesterase
were also investigated in the presence of 6% acetonitrile, and a competitive
pseudo-inhibition was observed for acetonitrile (K
I
= 0.25 m). The interac-
tion of acetylcholinesterase with acetonitrile and tacrine or gallamine
resulted in a seven- to 10-fold increase in the K
I
values, whereas the princi-
pal mode of inhibition was not affected by the organic solvent. The deter-
mination of the inhibitory parameters of compound 1 in the presence of
acetonitrile revealed that the substance acts as a hyperbolic mixed-type
inhibitor of acetylcholinesterase. The complex formed by the enzyme and
the inhibitor still catalysed product formation with 8.7–9.6% relative
efficiency.
Abbreviations
ACh, acetylcholine; AChE, acetylcholinesterase; AD, Alzheimer’s disease; AP2238, 3-(4-{[benzyl(methyl)amino]methyl}phenyl)-6,7-dimethoxy-
2H-2-chromenone; ATCh, acetylthiocholine; Ab, amyloid-b; MeCN, acetonitrile; Nbs
2
, 5,5¢-dithiobis(2-nitrobenzoic acid); PAS, peripheral
anionic site; Tc, Torpedo californica.
2292 FEBS Journal 276 (2009) 2292–2307 ª 2009 The Authors Journal compilation ª 2009 FEBS
surface of AChE [8] and consists of five residues,
Tyr70, Asp72, Tyr121, Trp279 and Tyr334, clustered
around the entrance of the active site gorge [13–17].
PAS binds ACh transiently as the first step in the cata-
lytic pathway, enhancing the catalytic efficiency by
trapping the substrate on its way to the active site, and
allosterically modulates catalysis [7,12,18–22].
The principal physiological function of AChE,
mediated by the active site of the enzyme, is the rapid
hydrolysis of the neurotransmitter ACh at cholinergic
synapses and neuromuscular junctions, resulting in
the termination of the nerve impulse. In addition to
this ‘classical’ function, several ‘nonclassical’ activities
of AChE have been reported, which are associated
with PAS [9,21,23,24]. AChE is involved in neurite
growth [25], haematopoiesis and osteogenesis [26],
and acts as an adhesion protein in synaptic develop-
ment and maintenance [9]. AChE has also been
shown to promote the pathophysiological assembly of
the amyloid-b (Ab) peptide into amyloid fibrils
in vitro [27,28] and in vivo [29,30], with complexes of
AChE and Ab displaying an enhanced neurotoxicity
in comparison with fibrils formed by Ab alone
[31–33]. AChE has been found to be associated with
amyloid plaques and neurofibrillary tangles, two
hallmarks of Alzheimer’s disease (AD), and may con-
tribute to their development [34–36]. A third charac-
teristic symptom of AD is the decrease in cholinergic
neurons, which causes a loss of cholinergic neuro-
transmission and may be responsible for the common
signs of memory failure [37,38]. This ‘cholinergic
hypothesis’ provided the rationale for the current
major therapeutic approach to AD: the inhibition of
the catalytic function of AChE, thereby increasing the
bioavailability of ACh at the synaptic cleft, resulting
in an improvement in cholinergic neurotransmission
and cognitive function [38–40].
With regard to the involvement of PAS in the pro-
cesses of AD, the use of PAS inhibitors and dual-site
inhibitors of AChE allows for the inhibition of the cat-
alytic activity of the enzyme and also lowers the inci-
dence of Ab fibril assembly [33,41,42]. Prototypes of
AChE inhibitors known to bind at the active site, PAS
or both sites simultaneously are tacrine, gallamine and
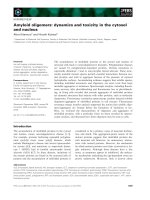
donepezil (Fig. 1), respectively. The crystal structures
of each complexed with AChE have been published
[10,41,43]. In a previous study, we described 7-benzyl-
5,6,7,8-tetrahydro-2-isopropylamino-4H-pyrido[4¢,3¢:4,5]-
thieno[2,3-d][1,3]thiazin-4-one (compound 1) (Fig. 1),
which inhibits AChE in the submicromolar range.
Kinetic analysis and structural similarities between
donepezil, AP2238 (Fig. 1) and compound 1 suggest
that these substances act as dual-site inhibitors of
AChE and bind along the active site gorge [42–44].
On the basis of these results, we performed a detailed
kinetic study with the prototype inhibitors tacrine and
gallamine, as well as compound 1. The interaction of
the inhibitors with AChE from Electrophorus electricus
was characterized using the kinetic models of AChE
inhibition, shown in Scheme 1 [45,46] and Scheme 3
[47], as well as the simplified model for hyperbolic
mixed-type inhibitors (Scheme 2), i.e. general modifiers
[48–50]. The analysis presented herein allowed for the
simultaneous determination of the kinetic parameters
K
I
, a¢, b or b, K
m
and V
max
directly from nonlinear
Michaelis–Menten plots. Recently, the interaction of
gallamine and tacrine with AChE was found to be
dependent on the presence of acetonitrile (MeCN) [51],
a cosolvent frequently used in AChE inhibition assays
[44,51–54]. In our ongoing investigations, this finding
Tacrine hydrochloride
N
NH
2
x HCl
Gallamine triethiodide
O
O
O
N
N
N
3 I
S
N
N
S
O
H
N
1
N
Donepezil
O
O
O
N
AP2238
O O
O
O
Fig. 1. Inhibitors of AChE.
M. Pietsch et al. Inhibition kinetics of acetylcholinesterase
FEBS Journal 276 (2009) 2292–2307 ª 2009 The Authors Journal compilation ª 2009 FEBS 2293
was analysed in detail by determining the effect of
MeCN on the kinetic parameters of AChE inhibition.
Results and Discussion
Characterization of AChE inhibition and
estimation of the inhibitory parameters
The inhibition of AChE from E. electricus by tacrine,
gallamine and compound 1 was determined spectro-
photometrically in a coupled assay with the substrate
ATCh and 5,5¢-dithiobis(2-nitrobenzoic acid) (Nbs
2
).
Inhibition studies were performed in the absence and
presence of 6% v ⁄ v MeCN at various concentrations of
both the substrate [S] and the inhibitor [I]. For compar-
ison, IC
50
values were initially determined at a sub-
strate concentration of 500 lm by plotting the rates
versus [I]. The inhibitory constants obtained for tacrine
(IC
50
= 0.047 ± 0.001 lm, no MeCN; IC
50
= 0.34 ±
0.02 lm, 6% MeCN) and gallamine (IC
50
= 1100 ±
60 lm, no MeCN; IC
50
= 2930 ± 140 lm,6%
MeCN) were in good agreement with results from a
previous study [51]. In the case of compound 1, AChE
inhibition was only determined in the presence of 6%
MeCN because of a lack of solubility in the absence of
an organic cosolvent. As the enzyme was not
completely inhibited at high concentrations of
compound 1, residual activity at infinite concentration
of the inhibitor (v
[I] ޴
) had to be considered. Using
Eqn (15) (see Experimental procedures), values of
IC
50
= 0.58 ± 0.02 lm and v
[I] ޴
= 0.094 ± 0.004
(relative to the activity without inhibitor v
0
) were deter-
mined, which confirmed previously reported data [44].
To characterize the inhibition of AChE, a kinetic
model was considered (Scheme 1), which is analogous
to that introduced by Barnett and Rosenberry [45] and
Szegletes et al. [46]. In this model, the substrate S
binds to the enzyme E to form an initial enzyme–sub-
strate complex, also called Michaelis complex ES [55].
This complex proceeds to an acylated enzyme interme-
diate EA, with the acylation rate constant k
2
, under
simultaneous formation of the first product P
1
. The
acyl-enzyme is then hydrolysed with the deacylation
rate constant k
3
to give the second product P
2
and the
free enzyme, which enters a new catalytic cycle. If
ATCh is used as substrate, thiocholine and acetate are
formed as P
1
and P
2
, respectively. The Michaelis con-
stant K
m
and the maximal velocity V
max
, which can be
experimentally determined, are expressed by Eqns (1)
and (2), respectively [56,57]:
K
m
¼
k
ÀS
þ k
2
k
S
1 þ
k
2
k
3
¼
K
S
1 þ
k
2
k
3
ð1Þ
V
max
¼
k
2
½E
0
1 þ
k
2
k
3
ð2Þ
where [E]
0
is the total enzyme concentration and K
S
is
the dissociation constant of ES. The parameter k
cat
is
equal to the quotient V
max
⁄ [E]
0
[46]. For the hydrolysis
of ATCh by AChE from E. electricus, values of the
rate constants k
2
(1.23 · 10
6
min
)1
) and k
3
(9.3 · 10
5
min
)1
) have been obtained previously by
direct measurements of the acetyl-enzyme. As k
2
is
only about 1.3 times larger than k
3
, both constants are
rate influencing [58].
An inhibitor I can bind to each of the three enzyme
species to form a binary enzyme–inhibitor complex EI,
or the ternary complexes ESI and EAI with the
E
+
+
I
S
ESI
ES E
+ P
2
EI + P
2
EI
k
S
k
2
k
3
k
S2
ak
2
bk
3
k
SI
+
S
+
I
k
–I
k
I
k
–S
k
–SI
EA
EAI
+
I
k
–AI
k
AI
k
–S2
H
2
O
H
2
O
+
P
1
P
1
+
Scheme 1. Kinetic model of AChE inhibition.
E
+
+
I
S
ES
EI + P
2
E + P
2
EI
k
S
k
I
k
AI
k
2
k
3
bk
3
P
1
k
–I
k
–S
EA
EAI
+
I
k
–AI
H
2
O
H
2
O
+
Scheme 3. Kinetic model of AChE inhibition excluding the for-
mation of ESI.
E
+
+
I
S
ESI'
ES'
E + P
EI + P
k
P
EI
K
S
K
I
+
S
α
'
K
s
α
'
K
I
β
'
k
P
+
I
Scheme 2. Simplified kinetic model of the general modifier
mechanism.
Inhibition kinetics of acetylcholinesterase M. Pietsch et al.
2294 FEBS Journal 276 (2009) 2292–2307 ª 2009 The Authors Journal compilation ª 2009 FEBS
enzyme–substrate complex and the acyl-enzyme,
respectively [46]. The EI complex is capable of bind-
ing S, and catalyses product formation via ESI and
EAI, with the parameters a and b describing the fac-
tors by which k
2
and k
3
are altered. As a general
steady-state solution for the reaction rate v in
Scheme 1 (based on extension of the Michaelis–Men-
ten expression) is too complex for useful comparison
with experimental data [45,46,48,59], a virtual equilib-
rium has been assumed for all reversible reactions in
Scheme 1 (i.e. k
)S
) k
2
, k
)S2
) ak
2
, k
)SI
) k
2
,
k
)SI
) ak
2
, k
)AI
) k
3
, k
)AI
) bk
3
) [45,46,59]. The
resulting expression for v is given by Eqn (3) with the
dissociation constants K
X
expressed by the quotients
k
)X
⁄ k
X
.
A direct analysis of AChE inhibition using Eqn (3)
is not possible, as contributions from the inhibition of
both acylation and deacylation complicate the interpre-
tation of the data. In addition, estimates for a and b
are not separately available. Therefore, the parameters
a and b were introduced to facilitate calculation. At
saturating concentrations of I, these parameters are
expressed by Eqns (4) and (5), respectively [46]:
a ¼
aK
I
K
SI
¼
aK
S
K
S2
ð4Þ
b ¼
ab k
2
þ k
3
ðÞ
ak
2
þ bk
3
ð5Þ
Under these conditions, i.e. [I] ޴, S exclusively
binds to the EI complex and is converted to the pro-
ducts via ESI and EAI. The reaction rate, v
[I] ޴
,ata
given substrate concentration is defined by a combina-
tion of Eqns (3–5):
v
½I!1
¼
bV
max
½S
b
a
K
m
þ½S
ð6Þ
The kinetic parameters K
I
, a and b are usually deter-
mined by linearization of the Michaelis–Menten equa-
tion (Eqn 3) on the basis of the Lineweaver–Burk plot
and replotting of the slopes and intercepts obtained
(after normalization) [46,59]. However, it was shown
that an iterative nonlinear optimization based on the
hyperbolic expression for v is, in general, more advan-
tageous, as this method includes no transformation of
the primary data, lower standard deviations and less
bias in parameter estimates compared with algorithms
using linearized plots [60]. To apply such a nonlinear
optimization, we simplified the kinetic model outlined
in Scheme 1 to that of the general modifier mechanism
(Scheme 2) [48]. In this model, ES and EA are not
considered separately, but summed in a complex ES¢
that includes all enzyme–substrate intermediates. In an
analogous manner, ESI¢ represents the complexes of I
with the substrate-bound enzyme and the acyl-enzyme
[14]. The dissociation constants of S from these binary
and ternary complexes are K
S
= k
)S
⁄ k
S
and
a¢K
S
= k
)S2
⁄ k
S2
, respectively [49]. Both ES¢ and ESI¢
are capable of product formation (with P being both
thiocholine and acetate [14]), governed by the catalytic
constants k
P
and b¢k
P
, respectively. The parameter b¢
reflects the efficiency of hydrolysis of ESI¢ compared
with that of ES¢. This type of inhibition (b¢ >0) is
referred to as hyperbolic inhibition, as the shape of a
reciprocal velocity 1 ⁄ v versus [I] plot is hyperbolic. In
contrast, a value of b¢ = 0 causes a linear dependence
of 1 ⁄ v on [I], and thus the inhibition is called linear
[49,50]. The dissociation constant of EI is K
I
= k
)I
⁄ k
I
[49] and thus defined as in Scheme 1, whereas a¢K
I
reflects a composite of constants for inhibitor binding
to the enzyme–substrate complex and the acyl-enzyme
[14]. The factor a¢ corresponds to the ratio of a¢K
I
and
K
I
. As the overall equilibrium constant for the forma-
tion of ESI¢ must be the same regardless of a path via
ES¢ or EI, the same factor a¢ must be included in the
model [49,61]. Derivation of the general velocity equa-
tion for the system in Scheme 2 can be performed
assuming a rapid equilibrium or steady-state condition.
The first method gives a relatively simple expression,
whereas the steady-state approach results in a very
complex expression containing squared [S] and [I]
terms. However, the steady-state velocity equation
simplifies to the same form as the rapid equilibrium
velocity equation when pseudo-equilibrium conditions
prevail (i.e. k
)S
) k
P
), as, in this case, the Michaelis
constant K
m
=(k
)S
+ k
P
) ⁄ k
S
substitutes for K
S
=
k
)S
⁄ k
S
in the velocity equation [49,61,62]. In addition,
v ¼
V
max
½S
K
m
1 þ
Â
I
Ã
K
I
1 þ
a
Â
I
Ã
K
SI
0
B
B
@
1
C
C
A
þ½S
k
3
k
2
þ k
3
1þ
Â
I
Ã
K
SI
1 þ
a
Â
I
Ã
K
SI
0
B
B
@
1
C
C
A
þ
k
2
k
2
þ k
3
1 þ
Â
I
Ã
K
AI
1 þ
b
Â
I
Ã
K
AI
0
B
B
@
1
C
C
A
0
B
B
@
1
C
C
A
ð3Þ
M. Pietsch et al. Inhibition kinetics of acetylcholinesterase
FEBS Journal 276 (2009) 2292–2307 ª 2009 The Authors Journal compilation ª 2009 FEBS 2295
K
m
has been found to be similar to K
S
for several sub-
strates of AChE [63]. For the purposes of the present
study, a rapid equilibrium and an irreversible character
of the catalytic step were assumed. Under these condi-
tions, the Michaelis–Menten equation for the general
type of inhibition shown in Scheme 2 is as follows:
v ¼
V
max
½S
K
m
1 þ
Â
I
Ã
K
I
1 þ
b
0
Â
I
Ã
a
0
K
I
0
B
B
@
1
C
C
A
þ½S
1 þ
Â
I
Ã
a
0
K
I
1 þ
b
0
Â
I
Ã
a
0
K
I
0
B
B
@
1
C
C
A
ð7Þ
At saturating concentrations of I, the products are
exclusively formed from ESI¢ with a rate constant b¢k
P
.
Under these conditions, the rate v
[I] ޴
can be
expressed by Eqn (8) [44,49]:
v
½I!1
¼
b
0
V
max
½S
a
0
K
m
þ½S
ð8Þ
As the rate v
[I] ޴
must be the same, regardless of
whether the model in Scheme 1 or 2 is applied, Eqns (6)
and (8) can be set as equal. Therefore, the parameters a
and b in Eqn (6) can be expressed by means of a¢ and b¢
as follows: b = b¢ and a = b¢⁄a¢ = b ⁄ a¢. In addition,
the value K
I
is equally defined in both kinetic models
(Schemes 1 and 2); thus, all three parameters character-
izing the inhibition according to the kinetic model in
Scheme 1, i.e. K
I
, a and b, can be determined on the
basis of the simplified model depicted in Scheme 2. This
methodology was applied to the inhibition of AChE by
gallamine (in the absence of MeCN) and compound 1
(with 6% MeCN). The PAS inhibitor gallamine (with-
out MeCN) has already been reported to follow the
kinetic model in Scheme 1 [46], whereas inhibition by
compound 1 was found not to be complete at saturating
concentrations of I, i.e. v
[I] ޴
and therefore b are
greater than zero.
For inhibitors attacking the active site of AChE and
containing a positively charged quaternary nitrogen
atom, it has been reported that they act not only by
binding to the free enzyme at the same site as the sub-
strate, but also by adding to the acyl-enzyme. However,
these compounds do not inhibit through attachment to
the Michaelis complex [47,55,64–66]. An example of
such an inhibitor is tacrine, which has been shown to
occupy the anionic binding site of TcAChE by being
sandwiched between the aromatic rings of Trp84 and
Phe330, mainly through p–p interactions and cation–p
interactions. In addition, a direct hydrogen bond is
formed between the acridinic protonated nitrogen of the
inhibitor and the carbonyl oxygen of His440 [10]. Crys-
tallographic studies on AChE complexed with ACh and
ATCh, as well as the nonhydrolysable substrate ana-
logue 4-oxo-N,N,N-trimethylpentanaminium [7,12],
revealed that these compounds also interact with Trp84
and Phe330 (TcAChE numbering [8]). Thus, it is unli-
kely that tacrine binds to the Michaelis complex, i.e. no
ternary complex ESI is formed. However, in the crystal
structure of AChE with tacrine, the immediate vicinity
of the catalytic serine is not occupied by the inhibitor
[10], and thus tacrine is probably able to bind to the EA
complex [67]. Under these conditions, the kinetic model
in Scheme 1 can be simplified to that shown in
Scheme 3. As I does not interact with ES to form ESI,
the value of the dissociation constant K
SI
in Scheme 1
becomes very large and the quotient K
I
⁄ K
SI
is virtually
zero. Equation (4) reveals that the ratios K
I
⁄ K
SI
and
K
S
⁄ K
S2
are equal, and thus the dissociation constant K
S2
must also become very large (i.e. the formation of ESI
does not occur via binding of S to EI). An identical
model as depicted in Scheme 3 has been used by Krupka
and Laidler [47] to explain AChE inhibition caused by
the interaction of I with E and EA. The Michaelis–Men-
ten equation for this type of inhibition is obtained by
simplification of Eqn (3) with K
SI
޴:
v ¼
V
max
½S
K
m
1þ
Â
I
Ã
K
I
þ½S
k
3
k
2
þk
3
þ
k
2
k
2
þk
3
1þ
Â
I
Ã
K
AI
1þb
Â
I
Ã
K
AI
0
B
B
@
1
C
C
A
0
B
B
@
1
C
C
A
ð9Þ
At saturating concentrations of I, the rate v
[I] ޴
is
equal to zero when calculated using Eqn (9). This means
that the kinetic model in Scheme 3 and Eqn (9) are only
applicable if complete inhibition occurs.
In analogy with the kinetic model in Scheme 2, the
dissociation constant K
AI
, obtained from Scheme 3,
was termed a¢K
I
with a¢ corresponding to the ratio of
a¢K
I
and K
I
. Additional rearrangement of Eqn (9)
results in the following expression for v:
v ¼
V
max
½S
K
m
1 þ
Â
I
Ã
K
I
þ½S
1 þ
Â
I
Ã
1 þ
bk
3
k
2
a
0
K
I
1 þ
k
3
k
2
1 þ b
Â
I
Ã
a
0
K
I
0
B
B
B
B
B
B
B
@
1
C
C
C
C
C
C
C
A
ð10Þ
Equation (10) was used to analyse AChE inhibition by
tacrine in the absence and presence of 6% MeCN.
In the present study, we applied an iterative nonlinear
optimization based on the hyperbolic Michaelis–Menten
Inhibition kinetics of acetylcholinesterase M. Pietsch et al.
2296 FEBS Journal 276 (2009) 2292–2307 ª 2009 The Authors Journal compilation ª 2009 FEBS
Eqn (7) (with b¢ = b) and Eqn (10) to calculate the
parameters K
I
, a¢, b (Eqn 7) or b (Eqn 10), K
m
and V
max
simultaneously from plots of rate versus [S] in the
presence of various inhibitor concentrations. However,
provisional estimates of the kinetic parameters were
necessary prior to the computer-assisted iterative deter-
mination [60]. To obtain such estimates for K
m
and
V
max
, we determined these parameters separately for
each set of data (tacrine without MeCN, tacrine with
MeCN, gallamine without MeCN, gallamine with
MeCN, and compound 1 with MeCN) in the absence of
inhibitor. The data were analysed by a nonlinear regres-
sion according to Eqn (11), which represents a simplifi-
cation of Eqn (3) with [I] = 0:
v ¼
V
max
½S
K
m
þ½S
ð11Þ
Using this method, the following values of K
m
and
V
max
were calculated for the five sets of data: tacrine,
no MeCN: K
m
= 101 ± 14 lm, V
max
= 110 ± 3%;
tacrine, 6% MeCN: K
m
= 684 ± 41 lm, V
max
=
229 ± 5%; gallamine, no MeCN: K
m
= 135 ±
19 lm, V
max
= 116 ± 3%; gallamine, 6% MeCN:
K
m
= 671 ± 20 lm, V
max
= 235 ± 3%; compound
1, 6% MeCN: K
m
= 606 ± 32 lm, V
max
= 229 ±
4%. (The rate of the AChE-catalysed hydrolysis of
500 lm ATCh, corrected by the value of the nonenzy-
matic hydrolysis, was set to 100% in all experiments.)
Provisional estimates for K
I
, a¢ and b in Eqn (7)
(b¢ = b) were obtained by analysing the data of the
AChE inhibition studies with the specific velocity plot
developed by Baici [61]. This method is advantageous
over the commonly used Lineweaver–Burk plot or the
similar Hanes–Woolf plot [49], as it always gives linear
plots, independent of whether the inhibition is linear
or hyperbolic. The type of inhibition can be obtained
by simple inspection of the specific velocity plot
(Eqn 12), and linear replots permit the calculation of
K
I
, a¢ and b [61]. On the basis of Eqn (12), the quo-
tient of the rate without inhibitor and the rate in the
presence of inhibitor, v
0
⁄ v
I
, was plotted against
r ⁄ (1 + r), with r being equal to [S] ⁄ K
m
(Doc. S1,
Fig. S1A,B, see Supporting information):
v
0
v
I
¼
1
a
0
K
I
À
1
K
I
Â
I
Ã
1 þ
b
Â
I
Ã
a
0
K
I
r
1 þ r
þ
1 þ
Â
I
Ã
K
I
1 þ
b
Â
I
Ã
a
0
K
I
ð12Þ
To obtain provisional estimates for K
I
, a¢ and b in
Eqn (10), we developed a graphical method based on
Eqn (13), which is similar to the specific velocity plot
(Doc. S1, Fig. S2A,B, see Supporting information):
v
0
v
I
¼
1 þ
Â
I
Ã
1 þ
bk
3
k
2
a
0
K
I
1 þ k
3
k
2
1 þ
b
Â
I
Ã
a
0
K
I
À 1 þ
Â
I
Ã
K
I
0
B
B
B
B
B
B
B
B
B
B
@
1
C
C
C
C
C
C
C
C
C
C
A
r
1 þ r
þ 1 þ
Â
I
Ã
K
I
ð13Þ
Investigations of AChE inhibition by tacrine, in the
absence and presence of 6% MeCN, on the basis of
the modified specific velocity plot (Eqn 13, data not
shown) indicated a mixed-type inhibition that tended
to noncompetitive inhibition in both cases with K
I
=
0.038 lm, a¢ = 0.91 and K
I
= 0.25 lm, a¢ = 1.0,
respectively. The value b was determined to be equal
to –0.004 for the enzyme–inhibitor interaction, both
with and without MeCN. As b < 0 cannot be defined
by the mechanism in Scheme 3, b was set to zero for
the calculation of the kinetic parameters by Eqn (10).
AChE inhibition by gallamine without MeCN and
compound 1 in the presence of 6% MeCN, analysed
according to Eqn (12) (Fig. S1A, see Supporting infor-
mation), was found to follow a hyperbolic mixed-type
inhibition with a¢ > 1 and b > 0. This is shown for
gallamine by the common intersection point of the lines
in the specific velocity plot at r ⁄ (1 + r)>1;v
0
⁄ v
I
=1
(Fig. S1A, see Supporting information), as well as by
discrete intercepts of the replots (Fig. S1B, see Support-
ing information) [61]. On the basis of these replots, the
parameters K
I
= 330 lm, a¢ = 5.7 and b = 0.31 were
determined. Using this method, K
I
= 0.52 lm, a¢ = 1.3
and b = 0.077 were calculated for the inhibition of
AChE by compound 1 (data not shown).
In contrast with the study without MeCN, a plot of
v
0
⁄ v
I
versus r ⁄ (1 + r) for AChE inhibition by gallamine
in the presence of 6% MeCN showed an array of curves
with a common intersection point close to r ⁄ (1 + r)=
1; v
0
⁄ v
I
= 1 (Fig. S2A, see Supporting information). A
plot of int0 ⁄ (int0)1) versus 1 ⁄ [I], where int0 is the inter-
cept on the ordinate axis [r ⁄ (1 + r) = 0], and an initial
analysis (Fig. S2B, see Supporting information) gave an
intercept equal to unity. Such a behaviour indicates
competitive inhibition [61], which is described by
Eqn (14):
v ¼
V
max
½S
K
m
1 þ
Â
I
Ã
K
I
þ½S
ð14Þ
M. Pietsch et al. Inhibition kinetics of acetylcholinesterase
FEBS Journal 276 (2009) 2292–2307 ª 2009 The Authors Journal compilation ª 2009 FEBS 2297
As an approximation, Eqn (14), a simplified form of
the Michaelis–Menten Eqns (3) and (10) valid for com-
petitive inhibitors, and an estimated value K
I
= 1130
lm, obtained on the basis of the modified specific
velocity plot (Eqn 13; Doc. S1, Fig. S2B, see Support-
ing information), were used to quantify the interaction
of AChE with gallamine in the presence of 6% MeCN.
Determination of the parameters of inhibition
using the Michaelis–Menten equation
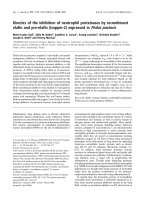
The final kinetic analysis of the inhibition by tacrine
(Fig. 2A,B), gallamine (Fig. 3A,B) and compound 1
(Fig. 4) in the absence and presence of 6% MeCN was
accomplished using Eqn (7) (b¢ = b), Eqn (10) or
Eqn (14), as outlined above. The rates of enzyme-
catalysed substrate cleavage were analysed as a func-
tion of both [S] and [I], and the parameters K
I
, a¢, b or
b, K
m
and V
max
were calculated simultaneously
(Table 1). Parameter estimates were taken from (modi-
fied) specific velocity plots and Michaelis–Menten plots
in the absence of inhibitor (see above). All the values
of K
m
and V
max
calculated independently by the non-
linear optimization of Eqns (7) and (10) (Table 1) were
in good agreement with the parameter estimates
obtained in the absence of the inhibitors (see above).
In the case of gallamine investigated in the presence of
MeCN, the calculation of the kinetic parameters was
based on Eqn (14), as a competitive mode of inhibition
was assumed from the modified specific velocity plot
(Fig. S2A,B, see Supporting information). The K
m
value of 778 lm obtained differed considerably from
the parameter estimate of 671 lm. In contrast, the cal-
culated V
max
value of 245% was very similar to the
parameter estimate of 235%. This behaviour can be
explained by the competitive mode of inhibition. The
substrate affinity of the enzyme will be reduced, i.e.
the apparent K
m
value will be increased, whereas the
maximum velocity of product formation V
max
is not
affected [49,50]. With a given set of data for rates as a
function of [S], the determination of V
max
and thus K
m
becomes less accurate when [S] is low relative to the
apparent K
m
value [49]. This occurred in our study for
high concentrations of gallamine in the presence of 6%
MeCN.
One possibility to avoid this accuracy problem
would be to investigate the enzyme–inhibitor interac-
tion in the presence of higher substrate concentrations.
However, in the case of AChE, it is known that sub-
strate inhibition arises under such conditions, with
PAS being involved in the mechanism [12,19,22,68–70].
As gallamine binds to PAS [41], a more complex mode
of inhibition might result [71]. Therefore, we did not
use higher substrate concentrations to analyse AChE
inhibition by gallamine in the presence of 6% MeCN,
which might also have revealed a deviation from the
apparent competitive inhibition. Instead, we investi-
gated the interaction of the inhibitor with AChE over
a range of [S], where substrate inhibition was not
observed [7,14]. The maximum [S] value of 2250 lm
corresponded to $ 16–22K
m
for experiments without
[ATCh] (µM)
0 500 1000 1500 2000 2500
Rate (%)
0
25
50
75
100
125
A
B
[ATCh] (µ
M)
0 500 1000 1500 2000 2500
Rate (%)
0
40
80
120
160
200
Fig. 2. Inhibition of AChE by tacrine in the absence (A) and pres-
ence (B) of 6% MeCN. Michaelis–Menten plots using mean values
and standard deviations of rates from four separate experiments in
100 m
M sodium phosphate, 100 mM NaCl, pH 7.3 with 350 lM
Nbs
2
and 0.033 UÆmL
)1
AChE. (A) Concentrations of tacrine were
as follows: open circles, [I] = 0; filled circles, [I] = 0.025 l
M; open
squares, [I] = 0.05 l
M; filled squares, [I] = 0.1 lM; open triangles,
[I] = 0.15 l
M; filled triangles, [I] = 0.2 lM; open reversed triangles,
[I] = 0.25 l
M. Nonlinear regression according to Eqn (10) gave K
I
=
0.027 ± 0.003 l
M, a¢ = 1.4 ± 0.2, K
m
= 101 ± 5 lM and V
max
=
110 ± 1%. (B) Concentrations of tacrine were as follows: open
circles, [I] = 0; filled circles, [I] = 0.125 l
M; open squares, [I] =
0.25 l
M; filled squares, [I] = 0.5 l M; open triangles, [I] = 0.75 lM;
filled triangles, [I] = 1.0 l
M; open reversed triangles, [I] = 1.25 lM.
Nonlinear regression according to Eqn (10) gave K
I
= 0.26 ±
0.02 l
M, a¢ = 1.1 ± 0.2, K
m
= 691 ± 35 lM and V
max
= 229 ± 4%.
In (A) and (B), the b values were set to zero, as the starting values
obtained from the modified specific velocity plots (data not shown)
were b <0.
Inhibition kinetics of acetylcholinesterase M. Pietsch et al.
2298 FEBS Journal 276 (2009) 2292–2307 ª 2009 The Authors Journal compilation ª 2009 FEBS
MeCN and $3.2–3.7K
m
for experiments with MeCN
(Table 1). To incorporate a more accurate V
max
value
in the fitting process, this parameter was set to a value
of 235%, obtained in the absence of gallamine (see
above). An analysis of the data according to Eqn (14)
using this set V
max
value gave K
m
= 699 lm (Table 1).
This value is closer to the parameter estimate of
671 lm, as well as the K
m
values calculated for the
inhibition of AChE by tacrine and compound 1 in the
presence of MeCN (Table 1). The K
I
value obtained
using the predefined V
max
value in Eqn (14) was
2020 lm (Table 1), whereas an only slightly larger
value of 2150 lm resulted when V
max
was determined
independently.
The determination of the factors a¢, b and b
(Table 1) was performed to obtain an insight into the
mode of inhibition, and the K
I
values (Table 1) pro-
vided information on the inhibitory potency of the
compounds. As depicted in Schemes 2 and 3, the fac-
tor a¢ defines whether the inhibitor binds to an
enzyme–substrate species (ES and EA combined
together as ES¢ in Scheme 2 or EA in Scheme 3) with
a greater affinity than to the free enzyme, or vice
versa. The preference of the inhibitor for binding to an
enzyme–substrate species is reflected in values where
a¢ < 1, which indicate mixed-type inhibition with a
pronounced uncompetitive component. A higher affin-
ity of the inhibitor to the free enzyme, seen where
a¢ > 1, corresponds to mixed-type inhibition with a
more competitive character. A pure noncompetitive
mode of inhibition is characterized by a¢ = 1, i.e. an
equal affinity of the inhibitor to any form of the
enzyme.
An investigation of AChE inhibition by tacrine in
the absence of MeCN, according to the kinetic model
in Scheme 3, gave values of K
I
= 0.027 lm and
[ATCh] (µ
M
)
0 500 1000 1500 2000 2500
Rate (%)
0
25
50
75
100
125
A
B
[ATCh] (µ
M
)
0 500 1000 1500 2000 2500
Rate (%)
0
40
80
120
160
200
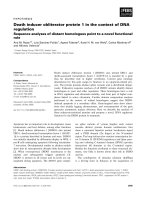
Fig. 3. Inhibition of AChE by gallamine in the absence (A) and pres-
ence (B) of 6% MeCN. Michaelis–Menten plots using mean values
and standard deviations of rates from four separate experiments in
100 m
M sodium phosphate, 100 mM NaCl, pH 7.3 with 350 lM
Nbs
2
and 0.033 UÆmL
)1
AChE. (A) Concentrations of gallamine
were as follows: open circles, [I] = 0; filled circles, [I] = 500 l
M;
open squares, [I] = 1000 l
M; filled squares, [I] = 2000 lM; open tri-
angles, [I] = 3000 l
M; filled triangles, [I] = 4000 lM; open reversed
triangles, [I] = 5000 l
M. Nonlinear regression according to Eqn (7)
gave K
I
= 270 ± 20 lM, a¢ =15±2, b¢ = b = 0.25 ± 0.03,
K
m
= 135 ± 8 lM and V
max
= 116 ± 1%. A value of a = 0.017 was
calculated as the quotient of b and a¢. (B) Concentrations of gall-
amine were as follows: open circles, [I] = 0; filled circles,
[I] = 750 l
M; open squares, [I] = 1500 lM; filled squares,
[I] = 3000 l
M; open triangles, [I] = 4500 lM; filled triangles,
[I] = 6000 l
M; open reversed triangles, [I] = 7500 lM. Nonlinear
regression according to Eqn (14) with V
max
being set to 235% gave
K
I
= 2020 ± 50 lM and K
m
= 699 ± 10 lM.
[ATCh] (µM)
0 500 1000 1500 2000 2500
Rate (%)
0
40
80
120
160
200
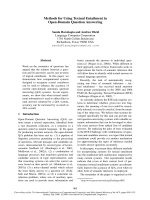
Fig. 4. Inhibition of AChE by compound 1 in the presence of 6%
MeCN. Michaelis–Menten plot using mean values and standard
deviations of rates from four separate experiments in 100 m
M
sodium phosphate, 100 mM NaCl, pH 7.3 with 350 lM Nbs
2
and
0.033 UÆmL
)1
AChE. Concentrations of compound 1 were as fol-
lows: open circles, [I] = 0; filled circles, [I] = 1.5 l
M; open squares,
[I] = 3.0 l
M; filled squares, [I] = 4.5 lM; open triangles,
[I] = 6.0 l
M; filled triangles, [I] = 7.5 lM. Nonlinear regression
according to Eqn (7) gave K
I
= 0.59 ± 0.05 lM, a¢ = 1.1 ± 0.1,
b¢ = b = 0.096 ± 0.007, K
m
= 607 ± 25 lM and V
max
= 230 ± 3%.
A value of a = 0.087 was calculated as the quotient of b and a¢.
M. Pietsch et al. Inhibition kinetics of acetylcholinesterase
FEBS Journal 276 (2009) 2292–2307 ª 2009 The Authors Journal compilation ª 2009 FEBS 2299
a¢ = 1.4 (Table 1). The parameter b was necessarily
set to zero for the nonlinear analysis (Table 1) and a
catalytically inactive EAI (Scheme 3) could therefore
be concluded. Thus, the deacylation of the acyl-enzyme
was completely blocked by the inhibitor. A mixed-type
inhibition, tending more to noncompetitive inhibition,
was found with tacrine. This was characterized by an
a¢ value close to unity, and indicated that the affinity
of tacrine towards AChE was only minimally affected
by acylation of the active site serine. Such a kinetic
behaviour has been reported to occur only if b =0
and the acylation rate constant of substrate conversion
k
2
is equal to or larger than the deacylation rate con-
stant k
3
[47]. Both requirements are fulfilled, as shown
by the present study and as reported by Froede and
Wilson [58], respectively.
These findings were in agreement with the results of
Nochi et al. [72] (obtained with ATCh and AChE from
E. electricus), who reported K
I
= 20.4 nm and K
I
*=
a¢K
I
(1 + k
3
⁄ k
2
) = 38.3 nm for tacrine on the basis of
the kinetic model in Scheme 3 (with b = 0) [72,73]. For
comparison, we calculated a¢ = 1.1 using these values of
K
I
and K
I
*. This result also indicates a mixed-type inhibi-
tion with a pronounced noncompetitive component.
Inhibition of AChE by gallamine (in the absence of
MeCN), analysed according to the kinetic model in
Scheme 2, was characterized by values of
K
I
= 270 lm, a¢ = 15 and b¢ = b = 0.25. A value of
a = 0.017 was calculated as the quotient of b and a¢
(Table 1). The a¢ value obtained demonstrated the
preference of gallamine to bind to the free enzyme
rather than to the enzyme–substrate species ES and
EA (combined in ESI¢, Scheme 2), which indicates a
mixed-type inhibition with a pronounced competitive
component. Such a kinetic behaviour has recently been
reported by Mooser and Sigman [74], who found pure
competitive inhibition (K
I
= 140–320 lm ) for the
interaction of gallamine with AChE from E. electricus.
The parameter b represents the substrate conversion
catalysed by an inhibitor-bound enzyme species com-
pared with that by the free enzyme (both Schemes 1
and 2). Our study found a value of b = 0.25 for the
interaction of AChE with gallamine (Table 1), which
confirmed the parameter estimate based on the specific
velocity plot (see above). Both b and the calculated
value of a were in agreement with the data obtained
by Szegletes et al. [46] for the inhibition of AChE by
gallamine with ATCh as substrate, who reported
b = 0.44 and a = 0.019. Under the assumption of
equilibrium conditions, a is represented by Eqn (4).
Therefore, low values of this parameter require either
that ESI (Scheme 1) is not formed (K
S
⁄ K
S2
and
K
I
⁄ K
SI
% 0) or that a % 0 (Scheme 1). As shown in
our study, a depends on both b and a¢, with the rela-
tively large value of the latter parameter indicating a
comparably low affinity of both the substrate and the
inhibitor to form an enzyme–substrate–inhibitor spe-
cies (Scheme 2). Thus, we hypothesize that the low a
value results from a diminished formation of ESI
rather than from inhibition of acylation (Scheme 1).
Recently, nonequilibrium analysis of AChE inhibition
by the PAS ligands propidium and gallamine resulted
in the construction of the ‘steric blockade hypothesis’
(based on the model in Scheme 1). This hypothesis
demonstrates that PAS ligands inhibit substrate hydro-
lysis without inducing conformational changes in the
active site [46]. Nonequilibrium conditions are charac-
terized by k
)S
< k
2
and k
)S2
< ak
2
[4,46], and thus
a % k
S2
⁄ k
S
was concluded according to Szegletes et al.
[46]. The ‘steric blockade hypothesis’ implies that a
ligand bound to PAS slows down ligand entry into
and exit from the active site of AChE (k
S2
< k
S
and
k
)S2
< k
)S
) without affecting the thermodynamics of
the binding of active site-directed ligands (K
S2
= K
S
).
It also stipulates that the PAS ligand has no effect on
the rate constants of substrate acylation and deacylation
Table 1. Inhibition of AChE from Electrophorus electricus. Values with standard error were calculated using data (mean values) from four
separate experiments, at five or six inhibitor concentrations and 10 or 12 substrate concentrations. Analysis of the data was performed using
Eqn (7) (gallamine triethiodide, no MeCN; compound 1,6%v⁄ v MeCN; b¢ = b), Eqn (10) (tacrine · HCl, no MeCN; tacrine · HCl, 6% v ⁄ v
MeCN) or Eqn (14) (gallamine triethiodide, 6% v ⁄ v MeCN).
Inhibitor MeCN (% v ⁄ v) K
I
(lM) a¢
a
b b K
m
(lM) V
max
(%)
Tacrine · HCl 0 0.027 ± 0.003 1.4 ± 0.2 0
b
ND
c
101 ± 5 110 ± 1
Tacrine · HCl 6 0.26 ± 0.02 1.1 ± 0.2 0
b
ND
c
691 ± 35 229 ± 4
Gallamine triethiodide 0 270 ± 20 15 ± 2
d
ND
c
0.25 ± 0.03 135 ± 8 116 ± 1
Gallamine triethiodide 6 2020 ± 50 ND
e
1ND
c
699 ± 10 235
f
Compound 1 6 0.59 ± 0.05 1.1 ± 0.1
g
ND
c
0.096 ± 0.007 607 ± 25 230 ± 3
a
A value of 1.3 for k
2
⁄ k
3
has been taken from the literature [58] to calculate a¢ for experiments with tacrine · HCl, no MeCN, and
tacrine · HCl, 6% v ⁄ v MeCN.
b
Starting value b < 0, thus b was set to zero.
c
ND, nondeterminable.
d
a = b ⁄ a¢ = 0.017.
e
b =1 in
Scheme 3, thus a¢ is nondeterminable.
f
V
max
was set to 235%, determined during provisional estimate investigations in the absence of gall-
amine triethiodide.
g
a = b ⁄ a¢ = 0.087.
Inhibition kinetics of acetylcholinesterase M. Pietsch et al.
2300 FEBS Journal 276 (2009) 2292–2307 ª 2009 The Authors Journal compilation ª 2009 FEBS
(a = b = 1), and that bound substrate does not alter
the interaction of the PAS ligand with the enzyme
(k
I
= k
SI
= k
AI
and k
)I
= k
)SI
= k
)AI
). Thus, only
the ratio k
)I
⁄ k
I
, i.e. the K
I
value, is relevant [46]. As
an extension of the steric blockade model, it was pro-
posed that bound PAS ligands also reduce the dis-
sociation rate constants for product release from the
active site, which becomes rate limiting at high [S]
[19,46].
On the basis of the ‘steric blockade hypothesis’, we
concluded that the inhibition of AChE by gallamine
(in the absence of MeCN) decreased the rate constants
k
S2
and k
)S2
(Scheme 1) to values $ 1.7% of k
S
and
k
)S
in our experiments. This conclusion agrees with
the result of a simulated gallamine inhibition of ATCh
hydrolysis under nonequilibrium conditions [46], where
k
S2
and k
)S2
were set to 1.5% of k
S
and k
)S
, respec-
tively, to obtain optimal correlation between the calcu-
lated and experimentally determined parameters K
I
, a
and b. The last two parameters can also be used to
characterize the relative efficiency of EI to catalyse
substrate conversion: a is defined as the ratio of the
second-order rate constant k
cat
⁄ K
m
with saturating [I]
to that in the absence of inhibitor, and b is the quo-
tient of the first-order rate constants k
cat
for substrate
conversion by EI (at saturating [I]) and E (Scheme 1)
[46]. According to Eqns (6) and (11), a and b represent
the relative efficiency of EI (Scheme 1) if [S] << K
m
and [S] ) K
m
, respectively. Thus, the efficiency of the
complex AChE–gallamine to hydrolyse ATCh is 1.7–
25% of that of free AChE.
Influence of MeCN on the inhibition of AChE
The inhibition of AChE by tacrine, gallamine and
compound 1 was investigated in the presence of 6%
v ⁄ v MeCN (corresponding to a concentration of
1.15 m), and the results are shown in Figs 2B,3B,4 and
Table 1. Even without the addition of inhibitors, our
research showed that the presence of MeCN reduced
the rate of enzyme-catalysed substrate conversion,
which is in accordance with several literature reports
on soluble and immobilized AChE from E. electricus
[75–80]. At the highest substrate concentration used in
our experiments, [S] = 2250 lm, the absolute enzyme
activity without MeCN was 0.251 ± 0.052 min
)1
(n = 8), whereas the addition of 6% MeCN resulted
in a decrease in the rate to 0.089 ± 0.020 min
)1
(n = 8), i.e. to 36% (data not shown). As depicted in
Table 1, MeCN also had an influence on the K
m
value
of enzymatic substrate conversion, which increased
from 101–135 to 607–699 lm when 6% MeCN was
present in the assay. A similar result was found in a
study by Ronzani [76], where K
m
values of 85 and
750 lm were determined for the AChE-catalysed con-
version of ATCh in the absence and presence of 6.5%
MeCN, respectively. The latter K
m
value was calcu-
lated on the basis of a competitive mode of inhibition
suggested for MeCN and K
I
= 0.16 m [75,76]. For
competitive inhibitors, K
I
can be calculated according
to the equation K
I
= [I] ⁄ [(K
m
¢⁄K
m
))1], where K
m
¢ is
the Michaelis constant in the presence of a certain
amount of inhibitor [75,76]. Applying this equation to
our experiments and using mean values of the data
shown in Table 1 (K
m
¢ = 666 lm at [MeCN] =
1.15 m, K
m
= 118 lm without MeCN), we calculated
an equivalent K
I
value of 0.25 m for MeCN. Consider-
ing the cosolvent MeCN as a competitive inhibitor, it
might be included as a ‘second’ inhibitor in the fitting
equations to analyse the influence of the ‘first’ inhibi-
tor (i.e. tacrine, gallamine or compound 1). Such
attempts have, however, not been made in this study.
The inhibition experiments performed in the pres-
ence of 6% MeCN and tacrine or 6% MeCN and gall-
amine were analysed according to the kinetic model in
Scheme 3, as ESI was assumed not to be formed in
both cases (see above). Our investigations on the basis
of Eqns (10) and (14) revealed increased K
I
values for
the two inhibitors compared with the studies without
MeCN. For tacrine and gallamine, 9.6-fold and 7.5-
fold increases in the dissociation constant were
observed, which resulted in K
I
= 0.26 lm and
K
I
= 2020 lm, respectively (Table 1). The factors for
the increase in K
I
are in good agreement with data
from a previous study [76], where a sevenfold increase
in K
I
was determined for the inhibition of AChE by
neostigmine iodide in the presence of 6.5% MeCN and
[S] = 20K
m
. In addition, a considerable loss of inhibi-
tion of immobilized AChE by dichlorvos and parao-
xon in the presence of increasing amounts of MeCN
(0–15%) was reported [79]. This loss was suggested to
be caused by the denaturing effect of the organic
solvent [79,81], which can also be considered as a
pseudo-inhibition process [80]. One reason for enzyme
denaturation in the presence of water-miscible solvents,
such as MeCN, might be the removal of essential
water molecules from the enzyme, necessary for mani-
festing the catalytic activity [80,82].
The inhibition of AChE by tacrine was characterized
by values of a¢ = 1.1 and b = 0 (Table 1), i.e. tacrine
(in the presence of 6% MeCN) acts as a mixed-type
inhibitor with a strong noncompetitive component and
completely blocks deacylation of EAI (Scheme 3) This
behaviour is identical to that in the absence of MeCN.
In contrast with tacrine, the PAS ligand gallamine
tends to inhibit AChE in a competitive manner. During
M. Pietsch et al. Inhibition kinetics of acetylcholinesterase
FEBS Journal 276 (2009) 2292–2307 ª 2009 The Authors Journal compilation ª 2009 FEBS 2301
the course of the corresponding analysis, the parameter
b was assumed to be unity (Table 1), i.e. gallamine
does not affect the deacylation of the acyl-enzyme.
Under these conditions, the parameter a¢ becomes
irrelevant for the inhibition process and is therefore
nondeterminable (Table 1). Comparison of AChE inhi-
bition by gallamine in the absence and presence of
MeCN revealed several similarities. The inhibitor
either acts with a pronounced competitive component
or behaves in a purely competitive manner. Binding of
gallamine to PAS does not alter the deacylation rate
constant of EAI (b = 1) when MeCN is present. This
has already been calculated for gallamine inhibition in
the absence of MeCN under nonequilibrium conditions
(see above [46]). On the basis of the conclusions drawn
from this calculation, we propose that gallamine not
only slows down substrate association with and sub-
strate ⁄ product dissociation from the active site, as
assumed in the absence of MeCN [19,46], but blocks
these events if the organic solvent is present.
As a result of these findings, it can be concluded
that the organic solvent has an influence on the inhibi-
tory potency rather than on the mode of inhibition.
Such behaviour is found regardless of whether the
inhibitor is active site directed, such as tacrine, or
binds to PAS, such as gallamine.
The inhibition of AChE by compound 1 was exclu-
sively investigated in the presence of 6% MeCN
because of solubility issues associated with com-
pound 1 without organic solvent. An analysis of the
enzyme–inhibitor interaction, according to Eqn (7),
revealed a hyperbolic mixed-type inhibition character-
ized by K
I
= 0.59 lm, a¢ = 1.1 and b¢ = b = 0.096;
a = 0.087 was calculated as the quotient of b and a¢
(Table 1). A value of a¢ % 1 implies that compound 1
exhibits the same dissociation constant towards AChE
regardless of whether the free enzyme or an enzyme–
substrate intermediate ES¢ (Scheme 2) is involved in
the interaction [49]. However, no statements can be
made regarding the dissociation constants of ESI and
EAI (Scheme 1), as a¢K
I
(Scheme 2) reflects a compos-
ite of these two constants [14]. Nevertheless, the
observed kinetic behaviour supports the proposed
binding mode of compound 1 to act as a dual-site
inhibitor and bind along the active site gorge [44], as
similarly concluded for heterobivalent tacrine inhibi-
tors [52]. The a and b values obtained indicate that the
relative efficiency of EI to catalyse ATCh cleavage (at
saturating [I]) ranges from 8.7% (if [S] << K
m
)to
9.6% (if [S] ) K
m
).
The residual activity of EI cannot be explained by
the ‘steric blockade hypothesis’, as this hypothesis was
constructed for inhibitors that exclusively interact with
PAS. In so doing, the inhibitor is proposed to simply
act as a ‘permeable cork’ at the entrance of the active
site gorge [46]. In contrast, compound 1 is proposed to
bind along this gorge to both the active site at the bot-
tom and PAS, which should prevent ligand access to
the active site [83]. Recently, an alternative route to
and ⁄ or from the active site gorge that may be involved
in substrate ⁄ product traffic was found on the basis of
kinetic crystallography [84]. In that study, opening of
a hole adjacent to the choline-binding locus of the
anionic site was observed to be particularly caused by
rotation of Trp84 (TcAChE numbering [8]). Hints of a
‘back door’ exit were also obtained by mutagenesis
experiments [85], molecular dynamics simulations [86]
and from the absence of bulky leaving groups in crys-
tal structures of TcAChE conjugated with more or less
gorge-filling inhibitors covalently linked to Ser200
[83,87]. In this context, the usage of inhibitors, such as
compound 1, might be helpful to further elucidate
alternative substrate access to the active site.
Conclusions
Our investigations with the prototype AChE inhibitors
tacrine and gallamine have shown that defined amounts
of MeCN alter the K
I
value of the inhibitors (by a
certain factor), but not their principal mode of inhibi-
tion. This is a new finding which requires further investi-
gation. The presence of MeCN, however, repressed the
catalytic activity of the ternary complex formed by
AChE, ATCh and the PAS inhibitor gallamine. On the
basis of the ‘steric blockade hypothesis’ [46], where PAS
inhibitors are proposed to act as a ‘permeable cork’ at
the entrance of the active site gorge, we conclude that
the ‘permeability’ of gallamine simply disappears in the
presence of the organic solvent. In other words, the PAS
inhibitor blocks ligand access to the active site. The
kinetic analysis performed in this study was based on
the simultaneous determination of the inhibitory param-
eters K
I
, a¢, b or b, as well as K
m
and V
max
, all obtained
by a single calculation. We also demonstrated two
algorithms for the estimation of kinetic parameters to
successfully perform kinetic analysis in such circum-
stances. Finally, compound 1 was demonstrated to be
an effective dual-site inhibitor of AChE.
Experimental procedures
Materials
ATCh, Nbs
2
, gallamine triethiodide and tacrine hydrochlo-
ride were obtained from Sigma (Steinheim, Germany).
AChE from E. electricus and MeCN (HPLC grade) were
Inhibition kinetics of acetylcholinesterase M. Pietsch et al.
2302 FEBS Journal 276 (2009) 2292–2307 ª 2009 The Authors Journal compilation ª 2009 FEBS
purchased from Fluka (Deisenhofen, Germany). MeCN
was dried using phosphorus pentoxide, distilled and stored
over molsieve 3 A
˚
. Compound 1 was synthesized as
described elsewhere [44]. All measurements were performed
on a Varian (Darmstadt, Germany) Cary 50 Bio UV ⁄ VIS
spectrometer with a cell holder equipped with a Julabo
(Seelbach, Germany) UC-5B constant temperature water
bath. Data were analysed using Grafit v5.0 (R. J. Leather-
barrow, Erithacus Software Ltd, Horley, Surrey, UK).
AChE inhibition assay
AChE activity was assayed spectrophotometrically at 25 °C
according to the method of Ellman et al. [88] in the absence
or presence of 6% v ⁄ v MeCN. Assay buffer was 100 mm
sodium phosphate, 100 mm NaCl, pH 7.3. A stock solution
of AChE (100 UÆmL
)1
) in assay buffer was kept at 0 °C. A
1 : 30 dilution of AChE stock was prepared in ice-cold
assay buffer immediately before starting each measurement.
ATCh (0.5–45 mm) and Nbs
2
(7 mm) were dissolved in
assay buffer and kept at 0 °C. Stock solutions of tacrine,
gallamine and compound 1 were prepared in distilled water,
assay buffer and MeCN, respectively, and kept at room
temperature. Inhibition of enzyme activity was determined
with 12 (gallamine and tacrine: 25–2250 lm) or 10 (com-
pound 1: 125–2250 lm) different substrate concentrations
in the presence of six (gallamine: 500–5000 lm for measure-
ments without MeCN, 750–7500 lm for measurements in
the presence of 6% MeCN; tacrine: 0.025–0.25 lm for mea-
surements without MeCN, 0.125–1.25 lm for measurements
in the presence of 6% MeCN) or five (compound 1: 1.5–
7.5 lm) different inhibitor concentrations. Progress curves
were monitored at 412 nm over 5 min and characterized by
a linear steady-state turnover of the substrate. Inhibition
studies in the absence or presence of 6% MeCN were per-
formed in a volume of 1 mL containing 350 lm Nbs
2
,
0.033 UÆmL
)1
AChE and different substrate and inhibitor
concentrations. The enzymatic substrate conversion was ini-
tiated by adding 50 lL of ATCh solution after incubating
the enzyme–inhibitor mixture for 15 min at 25 °C. Uninhib-
ited enzyme activity was determined by adding the corre-
sponding solvent instead of the inhibitor solution. The rates
of AChE-catalysed ATCh cleavage were corrected by those
of the nonenzymatic hydrolysis of ATCh obtained in the
absence of enzyme and inhibitor. The rate of the AChE-
catalysed hydrolysis of 500 lm ATCh was determined in
duplicate without inhibitor in each experiment and, after
correction by the value of the nonenzymatic hydrolysis, was
set to 100%. Mean values of percentage rates obtained in
four separate experiments were used for all calculations.
IC
50
values were determined by plotting the rates v
obtained at [ATCh] = 500 lm against the inhibitor concen-
trations [I]. In the case of compound 1, this plot did not
become asymptotic to the abscissa. Therefore, residual
activity at infinite concentration of the inhibitor v
[I] ޴
was
included in the calculation of the inhibition constant [44]
using Eqn (15):
v ¼
ðv
0
À v
Â
I
Ã
!1
Þ
1 þ
Â
I
Ã
IC
50
þ v
Â
I
Ã
!1
ð15Þ
where v
0
is the velocity in the absence of the inhibitor and
IC
50
is the concentration of the inhibitor which reduces the
velocity of the enzyme-catalysed reaction to a value halfway
between v
0
and v
[I] ޴
. To determine IC
50
values for gall-
amine and tacrine (in the presence and absence of 6%
MeCN), v
[I] ޴
was set to zero in Eqn (15).
Acknowledgements
This work was supported by grants from the Research
Training Group 804 ‘Analysis of cellular functions by
combinatorial chemistry and biochemistry’ (to L.C.
and M.G.). M.P. gratefully acknowledges financial
support from Professor Andrew Abell (School of
Chemistry and Physics, The University of Adelaide,
Adelaide, Australia), ARC grant DP0771901 and a fel-
lowship within the ‘Postdoc-Programm’ of the German
Academic Exchange Service (DAAD). The authors
wish to thank Megan Garvey for critical reading of
the manuscript.
References
1 Soreq H & Seidman S (2001) Acetylcholinesterase –
new roles for an old actor. Nat Rev Neurosci 2, 294–
302.
2 Cygler M, Schrag JD, Sussman JL, Harel M, Silman I,
Gentry MK & Doctor BP (1993) Relationship between
sequence conservation and three-dimensional structure
in a large family of esterases, lipases, and related pro-
teins. Protein Sci 2 , 366–382.
3 Nardini M & Dijkstra BW (1999) a ⁄ b Hydrolase fold
enzymes: the family keeps growing. Curr Opin Struct
Biol 9, 732–737.
4 Quinn DM (1987) Acetylcholinesterase: enzyme struc-
ture, reaction dynamics, and virtual transition states.
Chem Rev 87, 955–979.
5 Wilson IB & Cabib E (1956) Acetylcholinesterase:
enthalpies and entropies of activation. J Am Chem Soc
78, 202–207.
6 Silman I, Millard CB, Ordentlich A, Greenblatt HM,
Harel M, Barak D, Schafferman A & Sussman JL
(1999) A preliminary comparison of structural models
for catalytic intermediates of acetylcholinesterase. Chem
Biol Interact 119–120, 43–52.
7 Bourne Y, Radic
´
Z, Sulzenbacher G, Kim E, Taylor P
& Marchot P (2006) Substrate and product trafficking
through the active center gorge of acetylcholinesterase
M. Pietsch et al. Inhibition kinetics of acetylcholinesterase
FEBS Journal 276 (2009) 2292–2307 ª 2009 The Authors Journal compilation ª 2009 FEBS 2303
analyzed by crystallography and equilibrium binding.
J Biol Chem 281, 29256–29267.
8 Sussman JL, Harel M, Frolow F, Oefner C, Goldman
A, Toker L & Silman I (1991) Atomic structure of ace-
tylcholinesterase from Torpedo californica: a prototypic
acetylcholine-binding protein. Science 253, 872–879.
9 Silman I & Sussman JL (2005) Acetylcholinesterase:
‘classical’ and ‘non-classical’ functions and pharmacol-
ogy. Curr Opin Pharmacol 5, 293–302.
10 Harel M, Schalk I, Ehret-Sabatier L, Bouet F, Goeldner
M, Hirth C, Axelsen PH, Silman I & Sussman JL
(1993) Quaternary ligand binding to aromatic residues
in the active site gorge of acetylcholinesterase. Proc Natl
Acad Sci USA 90, 9031–9035.
11 Ordentlich A, Kronman C, Flashner Y, Leitner M,
Segall Y, Ariel N, Cohen S, Velan B & Shafferman A
(1993) Dissection of the human acetylcholinesterase
active center determinants of substrate specificity. J Biol
Chem 268, 17083–17095.
12 Colletier JP, Fournier D, Greenblatt HM, Stojan J,
Sussman JL, Zaccai G, Silman I & Weik M (2006)
Structural insights into substrate traffic and inhibition
in acetylcholinesterase. EMBO J 25, 2746–2756.
13 Shafferman A, Kronman C, Flashner Y, Leitner M,
Grosfeld H, Ordentlich A, Gozes Y, Cohen S, Ariel A,
Barak D et al. (1992) Mutagenesis of human acetylcho-
linesterase. Identification of residues involved in cata-
lytic activity and in polypeptide folding. J Biol Chem
267, 17640–17648.
14 Radic
´
Z, Pickering NA, Vellom DC, Camp S & Taylor
P (1993) Three distinct domains in the cholinesterase
molecule confer selectivity for acetyl- and butyryl-
cholinesterase inhibitors. Biochemistry 32, 12074–
12084.
15 Radic
´
Z, Duran R, Vellom DC, Li Y, Cervenansky C
& Taylor P (1994) Site of fasciculin interaction with
acetylcholinesterase. J Biol Chem 269, 11233–11239.
16 Barak D, Kronman C, Ordentlich A, Ariel N, Brom-
berg A, Marcus D, Lazar A, Velan B & Shafferman A
(1994) Acetylcholinesterase peripheral anionic site
degeneracy conferred by amino acid arrays sharing a
common core. J Biol Chem 269, 6296–6305.
17 Ordentlich A, Barak D, Kronman C, Ariel N, Segall Y,
Velan B & Shafferman A (1995) Contribution of aro-
matic moieties of tyrosine 133 and of the anionic subsite
tryptophan 86 to catalytic efficiency and allosteric mod-
ulation of acetylcholinesterase. J Biol Chem 270,
2082–2091.
18 Hosea NA, Radic
´
Z, Tsigelny I, Berman HA, Quinn
DM & Taylor P (1996) Aspartate 74 as a primary deter-
minant in acetylcholinesterase governing specificity to
cationic organophosphonates. Biochemistry 35, 10995–
11004.
19 Szegletes T, Mallender WD, Thomas PJ & Rosenberry
TL (1999) Substrate binding to the peripheral site of
acetylcholinesterase initiates enzymatic catalysis. Sub-
strate inhibition arises as a secondary effect. Biochemis-
try 38, 122–133.
20 Mallender WD, Szegletes T & Rosenberry TL (2000)
Acetylcholine binds to Asp74 at the peripheral site of
human acetylcholinesterase as the first step in the cata-
lytic pathway. Biochemistry 39, 7753–7763.
21 Johnson G & Moore SW (2006) The peripheral anionic
site of acetylcholinesterase: structure, functions and
potential role in rational drug design. Curr Pharm Des
12
, 217–225.
22 Stojan J, Brochier L, Alies C, Colletier JP & Fournier
D (2004) Inhibition of Drosophila melanogaster acetyl-
cholinesterase by high concentrations of substrate. Eur
J Biochem 271, 1364–1371.
23 Massoulie
´
J (2002) The origin of the molecular diversity
and functional anchoring of cholinesterases. Neurosig-
nals 11, 130–143.
24 Mun
˜
oz-Muriedas J, Lopez JM, Orozco M & Luque FJ
(2004) Molecular modelling approaches to the design of
acetylcholinesterase inhibitors: new challenges for the
treatment of Alzheimer’s disease. Curr Pharm Des 10,
3131–3140.
25 Layer PG, Weikert T & Alber R (1993) Cholinesterases
regulate neurite growth of chick nerve cells in vitro by
means of a non-enzymatic mechanism. Cell Tissue Res
273, 219–226.
26 Grisaru D, Sternfeld M, Eldor A, Glick D & Soreq H
(1999) Structural roles of acetylcholinesterase variants
in biology and pathology. Eur J Biochem 264, 672–686.
27 Bartolini M, Bertucci C, Cavrini V & Andrisano V
(2003) Beta-amyloid aggregation induced by human
acetylcholinesterase: inhibition studies. Biochem Phar-
macol 65, 407–416.
28 Alvarez A, Opazo C, Alarcon R, Garrido J & Inestrosa
NC (1997) Acetylcholinesterase promotes the aggrega-
tion of amyloid-b-peptide fragments by forming a com-
plex with the growing fibrils. J Mol Biol 272, 348–361.
29 Rees T, Hammond PI, Soreq H, Younkin S & Brimi-
join S (2003) Acetylcholinesterase promotes beta-amy-
loid plaques in cerebral cortex. Neurobiol Aging 24,
777–787.
30 Chaco
´
n MA, Reyes AE & Inestrosa NC (2003) Acetyl-
cholinesterase induces neuronal cell loss, astrocyte
hypertrophy and behavioral deficits in mammalian hip-
pocampus. J Neurochem 87, 195–204.
31 Alvarez A, Alarcon R, Opazo C, Campos EO, Munoz
FJ, Calderon FH, Dajas F, Gentry MK, Doctor BP,
De Mello FG et al. (1998) Stable complexes involving
acetylcholinesterase and amyloid-b peptide change the
biochemical properties of the enzyme and increase the
neurotoxicity of Alzheimer’s fibrils. J Neurosci 18,
3213–3223.
32 Reyes AE, Chaco
´
n MA, Dinamarca MC, Cerpa W, Mor-
gan C & Inestrosa NC (2004) Acetylcholinesterase–Ab
Inhibition kinetics of acetylcholinesterase M. Pietsch et al.
2304 FEBS Journal 276 (2009) 2292–2307 ª 2009 The Authors Journal compilation ª 2009 FEBS
complexes are more toxic than Ab fibrils in rat hippocam-
pus. Am J Pathol 164, 2163–2174.
33 Inestrosa NC, Dinamarca MC & Alvarez A (2008)
Amyloid–cholinesterase interactions. Implications for
Alzheimer’s disease. FEBS J 275, 625–632.
34 Carson KA, Geula C & Mesulam MM (1991) Electron
microscopic localization of cholinesterase activity in
Alzheimer brain tissue. Brain Res 540, 204–208.
35 Wright CI, Geula C & Mesulam MM (1993) Protease
inhibitors and indoleamines selectively inhibit cholines-
terases in the histopathologic structures of Alzheimer
disease. Proc Natl Acad Sci USA 90, 683–686.
36 Inestrosa NC & Alarcon R (1998) Molecular interac-
tions of acetylcholinesterase with senile plaques. J Phys-
iol (Paris) 92, 341–344.
37 Recanatini M & Valenti P (2004) Acetylcholinesterase
inhibitors as a starting point towards improved Alzhei-
mer’s disease therapeutics. Curr Pharm Des 10, 3157–
3166.
38 Musia A, Bajda M & Malawska B (2007) Recent devel-
opments in cholinesterase inhibitors for Alzheimer’s
disease treatment. Curr Med Chem 14, 2654–2679.
39 Benzi G & Moretti A (1998) Is there a rationale for the
use of acetylcholinesterase inhibitors in the therapy of
Alzheimer’s disease? Eur J Pharmacol 346, 1–13.
40 Colombres M, Sagal JP & Inestrosa NC (2004) An
overview of the current and novel drugs for Alzheimer’s
disease with particular reference to anti-cholinesterase
compounds. Curr Pharm Des 10, 3121–3130.
41 Bourne Y, Taylor P, Radic
´
Z & Marchot P (2003)
Structural insights into ligand interactions at the acetyl-
cholinesterase peripheral anionic site. EMBO J 22,
1–12.
42 Piazzi L, Rampa A, Bisi A, Gobbi S, Belluti F, Cavalli
A, Bartolini M, Andrisano V, Valenti P & Recanatini
M (2003) 3-(4-{[Benzyl(methyl)amino]methyl}phenyl)-
6,7-dimethoxy-2H-2-chromenone (AP2238) inhibits both
acetylcholinesterase and acetylcholinesterase-induced
b-amyloid aggregation: a dual function lead for
Alzheimer’s disease therapy. J Med Chem 46, 2279–
2282.
43 Kryger G, Silman I & Sussman JL (1999) Structure of
acetylcholinesterase complexed with E2020 (Aricept):
implications for the design of new anti-Alzheimer drugs.
Struct Fold Des 7, 297–307.
44 Pietsch M & Gu
¨
tschow M (2005) Synthesis of tricyclic
1,3-oxazin-4-ones and kinetic analysis of cholesterol
esterase and acetylcholinesterase inhibition. J Med
Chem 48, 8270–8288.
45 Barnett P & Rosenberry TL (1977) Catalysis by acetyl-
cholinesterase. Acceleration of the hydrolysis of neutral
acetic acid esters by certain aromatic cations. J Biol
Chem 252, 7200–7206.
46 Szegletes T, Mallender WD & Rosenberry TL (1998)
Nonequilibrium analysis alters the mechanistic interpre-
tation of inhibition of acetylcholinesterase by peripheral
site ligands. Biochemistry 37, 4206–4216.
47 Krupka RM & Laidler KJ (1961) Molecular mecha-
nisms for hydrolytic enzyme action. III. A general
mechanism for the inhibition of acetylcholinesterase.
J Am Chem Soc 83, 1454–1458.
48 Botts J & Morales M (1953) Analytical description of
the effects of modifiers and of enzyme multivalency
upon the steady state catalyzed reaction rate. Trans
Faraday Soc 49, 696–707.
49 Segel IH (1993) Enzyme Kinetics. Wiley and Sons, New
York, NY.
50 Cornish-Bowden A (2004) Fundamentals of Enzyme
Kinetics, 3rd edn. Portland Press, London.
51 Elsinghorst PW, Cieslik JS, Mohr K, Tra
¨
nkle C &
Gu
¨
tschow M (2007) First gallamine–tacrine hybrid:
design and characterization at cholinesterases and M
2
muscarinic receptor. J Med Chem 50, 5685–5695.
52 Elsinghorst PW, Gonza
´
lez Tanarro CM & Gu
¨
tschow M
(2006) Novel heterobivalent tacrine derivatives as cho-
linesterase inhibitors with notable selectivity toward
butyrylcholinesterase. J Med Chem 49, 7540–7544.
53 Lin G, Lai CY & Liao WC (1999) Molecular recogni-
tion by acetylcholinesterase at the peripheral anionic
site: structure–activity relationships for inhibitions by
aryl carbamates. Bioorg Med Chem 7, 2683–2689.
54 Darvesh S, Darvesh KV, McDonald RS, Mataija D,
Walsh R, Mothana S, Lockridge O & Martin E (2008)
Carbamates with differential mechanism of inhibition
toward acetylcholinesterase and butyrylcholinesterase.
J Med Chem 51, 4200–4212.
55 Krupka RM & Laidler KJ (1961) Molecular mecha-
nisms for hydrolytic enzyme action. I. Apparent
non-competitive inhibition, with special reference to
acetylcholinesterase. J Am Chem Soc 83, 1445–1447.
56 Hillman GR & Mautner HG (1970) Hydrolysis of elec-
tronically and sterically defined substrates of acetylcho-
linesterase. Biochemistry 9, 2633–2638.
57 Wilson IB & Alexander J (1962) Acetylcholinesterase:
reversible inhibitors, substrate inhibition. J Biol Chem
237, 1323–1326.
58 Froede HC & Wilson IB (1984) Direct determination of
acetyl–enzyme intermediate in the acetylcholinesterase-
catalyzed hydrolysis of acetylcholine and acetylthiocho-
line. J Biol Chem 259, 11010–11013.
59 Eastman J, Wilson EJ, Cerven
˜
ansky C & Rosenberry
TL (1995) Fasciculin 2 binds to the peripheral site on
acetylcholinesterase and inhibits substrate hydrolysis by
slowing a step involving proton transfer during enzyme
acylation. J Biol Chem 270, 19694–19701.
60 Markus M, Hess B, Ottaway JH & Cornish-Bowden A
(1976) The analysis of kinetic data in biochemistry. A
critical evaluation of methods. FEBS Lett 63, 225–230.
61 Baici A (1981) The specific velocity plot. A graphical
method for determining inhibition parameters for both
M. Pietsch et al. Inhibition kinetics of acetylcholinesterase
FEBS Journal 276 (2009) 2292–2307 ª 2009 The Authors Journal compilation ª 2009 FEBS 2305
linear and hyperbolic enzyme inhibitors. Eur J Biochem
119, 9–14.
62 Garrido MN, Lisa TA & Domenech CE (1988) Pseu-
domonas aeruginosa acid phosphatase contains an
anionic site with a trimethyl subsite. Kinetic evidences
obtained with alkylammonium ions. Mol Cell Biochem
84, 41–49.
63 Hasan FB, Cohen SG & Cohen JB (1980) Hydrolysis
by acetylcholinesterase. Apparent molal volumes and
trimethyl and methyl subsites. J Biol Chem 255, 3898–
3904.
64 Krupka RM & Laidler KJ (1961) Molecular mecha-
nisms for hydrolytic enzyme action. II. Inhibition of
acetylcholinesterase by excess substrate. J Am Chem
Soc 83, 1448–1454.
65 Krupka RM (1964) Acetylcholinesterase: trimethylam-
monium-ion inhibition of deacetylation. Biochemistry 3,
1749–1754.
66 Krupka RM (1965) Acetylcholinesterase: structural
requirements for blocking deacetylation. Biochemistry 4,
429–435.
67 Fallarero A, Oinonen P, Gupta S, Blom P, Galkin A,
Mohan CG & Vuorela PM (2008) Inhibition of acetyl-
cholinesterase by coumarins: the case of coumarin 106.
Pharmacol Res 58, 215–221.
68 Radic
´
Z, Reiner E & Taylor P (1991) Role of the
peripheral anionic site on acetylcholinesterase: inhibi-
tion by substrates and coumarin derivatives. Mol Phar-
macol 39, 98–104.
69 Simon S & Massoulie
´
J (1997) Cloning and expression
of acetylcholinesterase from Electrophorus. Splicing pat-
tern of the 3¢ exons in vivo and in transfected mamma-
lian cells. J Biol Chem 272, 33045–33055.
70 Johnson JL, Cusack B, Hughes TF, McCullough EH,
Fauq A, Romanovskis P, Spatola AF & Rosenberry TL
(2003) Inhibitors tethered near the acetylcholinesterase
active site serve as molecular rulers of the peripheral
and acylation sites. J Biol Chem 278, 38948–38955.
71 Johnson JL, Cusack B, Davies MP, Fauq A & Rosen-
berry TL (2003) Unmasking tandem site interaction in
human acetylcholinesterase. Substrate activation with a
cationic acetanilide substrate. Biochemistry 42, 5438–
5452.
72 Nochi S, Asakawa N & Sato T (1995) Kinetic study on
the inhibition of acetylcholinesterase by 1-benzyl-4-
[(5,6-dimethoxy-1-indanon)-2-yl]methylpiperidine hydro-
chloride (E2020). Biol Pharm Bull 18, 1145–1147.
73 Froede HC, Wilson IB & Kaufman H (1986) Acetyl-
cholinesterase: theory of noncompetitive inhibition.
Arch Biochem Biophys 247, 420–423.
74 Mooser G & Sigman DS (1974) Ligand binding proper-
ties of acetylcholinesterase determined with fluorescent
probes. Biochemistry 13, 2299–2307.
75 Ronzani N (1993) Effet de solvents sur l’acetylcholines-
terase. Tetrahedron Lett 34, 3867–3870.
76 Ronzani N (1994) Effet de solvents sur l’acetylcholines-
terase. I. Mesure de l’activite
´
anticholineste
´
rasique de
composes hydrophobes. Analusis
22, 249–256.
77 Ingkaninan K, de Best CM, van der Heijden R, Hofte
AJP, Karabatak B, Irth H, Tjaden UR, van der Greef J
& Verpoorte R (2000) High-performance liquid chroma-
tography with on-line coupled UV, mass spectrometric
and biochemical detection for identification of acetyl-
cholinesterase inhibitors from natural products. J Chro-
matogr A 872, 61–73.
78 Rhee IK, Appels N, Luijendijk H, Irth H & Verpoorte
R (2003) Determining acetylcholinesterase inhibitory
activity in plant extracts using a fluorimetric flow assay.
Phytochem Anal 14, 145–149.
79 Dondoi MP, Bucur B, Danet AF, Toader CN, Bart-
helmebs L & Marty JL (2006) Organophosphorus insec-
ticides extraction and heterogeneous oxidation on
column for analysis with an acetylcholinesterase
(AChE) biosensor. Anal Chim Acta 578, 162–169.
80 Turdean GL & Turdean MS (2008) Synergetic effect of
organic solvents and paraoxon on the immobilized ace-
tylcholinesterase. Pestic Biochem Physiol 90, 73–81.
81 Fremaux I, Maze
`
res S, Brisson-Lougarre A, Arnaud M,
Ladurantie C & Fournier D (2002) Improvement of
Drosophila acetylcholinesterase stability by elimination
of a free cysteine. BMC Biochem 3, 21.
82 Mionetto N, Marty JL & Karube I (1994) Acetylcholin-
esterase in organic solvents for the detection of pesti-
cides: biosensor application. Biosens Bioelectron 9,
463–470.
83 Bartolucci C, Perola E, Cellai L, Brufani M & Lamba
D (1999) ‘Back door’ opening implied by the crystal
structure of a carbamoylated acetylcholinesterase.
Biochemistry 38, 5714–5719.
84 Colletier JP, Royant A, Specht A, Sanson B, Nachon
F, Masson P, Zaccai G, Sussman JL, Goeldner M, Sil-
man I et al. (2007) Use of a ‘caged’ analogue to study
the traffic of choline within acetylcholinesterase by
kinetic crystallography. Acta Crystallogr D Biol Crystal-
logr 63, 1115–1128.
85 Nachon F, Stojan J & Fournier D (2008) Insights into
substrate and product traffic in the Drosophila melanog-
aster acetylcholinesterase active site gorge by enlarging
a back channel. FEBS J 275, 2659–2664.
86 Gilson MK, Straatsma TP, McCammon JA, Ripoll
DR, Faerman CH, Axelsen PH, Silman I & Sussman
JL (1994) Open ‘back door’ in a molecular dynamics
simulation of acetylcholinesterase. Science 263, 1276–
1278.
87 Bartolucci C, Siotto M, Ghidini E, Amari G, Bolzoni
PT, Racchi M, Viletti G, Delcanale M & Lamba D
(2006) Structural determinants of Torpedo californica
acetylcholinesterase inhibition by the novel and orally
active carbamate based anti-Alzheimer drug ganstig-
mine (CHF-2819). J Med Chem 49, 5051–5058.
Inhibition kinetics of acetylcholinesterase M. Pietsch et al.
2306 FEBS Journal 276 (2009) 2292–2307 ª 2009 The Authors Journal compilation ª 2009 FEBS
88 Ellman GL, Courtney KD, Andres V & Featherstone RM
(1961) A new rapid colorimetric determination of acetyl-
cholinesterase activity. Biochem Pharmacol 7, 88–95.
Supporting information
The following supplementary material is available:
Doc. S1. A complete list of equations, including those
that are not part of the manuscript, together with cor-
responding annotations.
Fig. S1. (A) Specific velocity plot for the inhibition of
AChE by gallamine in the absence of MeCN. (B) Plot
of int0 ⁄ (int0)1) and int1 ⁄ (int1)1) versus the reciprocal
concentrations of gallamine.
Fig. S2. (A) Modified specific velocity plot for the inhi-
bition of AChE by gallamine in the presence of 6%
MeCN. (B) Plot of int0 ⁄ (int0)1) versus the reciprocal
concentrations of gallamine.
This supplementary material can be found in the
online version of this article.
Please note: Wiley-Blackwell is not responsible for
the content or functionality of any supplementary
materials supplied by the authors. Any queries (other
than missing material) should be directed to the corre-
sponding author for the article.
M. Pietsch et al. Inhibition kinetics of acetylcholinesterase
FEBS Journal 276 (2009) 2292–2307 ª 2009 The Authors Journal compilation ª 2009 FEBS 2307