Báo cáo khoa học: Protein oligomerization induced by oleic acid at the solid–liquid interface – equine lysozyme cytotoxic complexes potx
Bạn đang xem bản rút gọn của tài liệu. Xem và tải ngay bản đầy đủ của tài liệu tại đây (883.8 KB, 15 trang )
Protein oligomerization induced by oleic acid at the
solid–liquid interface – equine lysozyme cytotoxic
complexes
Kristina Wilhelm
1
, Adas Darinskas
2
, Wim Noppe
3
, Elke Duchardt
1,4
, K. Hun Mok
5
,
Vladana Vukojevic
´
6
,Ju
¨
rgen Schleucher
1
and Ludmilla A. Morozova-Roche
1
1 Department of Medical Biochemistry and Biophysics, Umea
˚
University, Sweden
2 Institute of Immunology, Vilnius University, Lithuania
3 Interdisciplinary Research Center, Campus Kortrijk, Leuven University, Belgium
4 Institute of Molecular Biosciences, Johann Wolfgang Goethe University Frankfurt, Germany
5 Trinity College, School of Biochemistry and Immunology, University of Dublin, Ireland
6 Department of Clinical Neuroscience, Karolinska Institute, Stockholm, Sweden
Introduction
The process of protein self-assembly has become the
focus of much current research as a broad manifestation
and consequence of protein instability. The propensity
of protein molecules to aggregate markedly increases if
they are destabilized or partially unfolded [1–3]. The
increased exposure of hydrophobic surfaces in partially
Keywords
amyloid; HAMLET; lysozyme; oleic acid;
oligomers
Correspondence
L. A. Morozova-Roche, Department of
Medical Biochemistry and Biophysics, Umea
˚
University, 901 87 Umea
˚
, Sweden
Fax: +46 90 786 9795
Tel: +46 90 786 5283
E-mail: ludmilla.morozova-roche@
medchem.umu.se
(Received 30 March 2009, revised 6 May
2009, accepted 21 May 2009)
doi:10.1111/j.1742-4658.2009.07107.x
Protein oligomeric complexes have emerged as a major target of current
research because of their key role in aggregation processes in living systems
and in vitro. Hydrophobic and charged surfaces may favour the self-assembly
process by recruiting proteins and modifying their interactions. We found
that equine lysozyme assembles into multimeric complexes with oleic acid
(ELOA) at the solid–liquid interface within an ion-exchange chromatography
column preconditioned with oleic acid. The properties of ELOA were charac-
terized using NMR, spectroscopic methods and atomic force microscopy,
and showed similarity with both amyloid oligomers and the complexes with
oleic acid and its structural homologous protein a-lactalbumin, known as
humana-lactalbumin made lethal for tumour cells (HAMLET). As deter-
mined by NMR diffusion measurements, ELOA may consist of 4–30 lyso-
zyme molecules. Each lysozyme molecule is able to bind 11–48 oleic acids in
various preparations. Equine lysozyme acquired a partially unfolded confor-
mation in ELOA, as evident from its ability to bind hydrophobic dye
8-anilinonaphthalene-1-sulfonate. CD and NMR spectra. Similar to amyloid
oligomers, ELOA also interacts with thioflavin-T dye, shows a spherical mor-
phology, assembles into ring-shaped structures, as monitored by atomic force
microscopy, and exerts a toxic effect in cells. Studies of well-populated
ELOA shed light on the nature of the amyloid oligomers and HAMLET
complexes, suggesting that they constitute one large family of cytotoxic
proteinaceous species. The hydrophobic surfaces can be used profitably to
produce complexes with very distinct properties compared to their precursor
proteins.
Abbreviations
AFM, atomic force microscopy; ANS, 8-anilinonaphthalene -1-sulfonate; CLSM, confocal laser scanning microscopy; ELOA, complex of
equine lysozyme with oleic acid; FCS, fluorescence correlation spectroscopy; HAMLET, human a-lactalbumin made lethal to tumour cells;
PFG, pulse field gradient; ThT, thioflavin-T.
FEBS Journal 276 (2009) 3975–3989 ª 2009 The Authors Journal compilation ª 2009 FEBS 3975
unfolded states leads to spontaneous protein aggrega-
tion. Protein destabilization can be achieved using mild
denaturing conditions, such as acidic or basic pH, heat-
ing, chemical denaturants and ligands, as well as at
solid–liquid interfaces [4–7]. Among self-assembled pro-
tein complexes, oligomers have attracted special atten-
tion because of their involvement in amyloid formation
and their distinct properties, which often differ from
those of their precursor monomers. Specifically, during
amyloid formation, oligomers may serve as nuclei for
further aggregation [8–10]. It has also been suggested
that they can fulfil the role of major cytotoxic agents
compared with more inert amyloid fibrils [11–15].
Because of the transient nature of oligomeric species,
which tend to associate into larger aggregates or split
into monomers, it is difficult to produce their stable
fractions [16–20]. A number of attempts have been made
to stabilize the oligomers of amyloidogenic polypeptides
using fatty acids and surfactants [21–25]. In our
research, we have produced stable oligomeric complexes
of equine lysozyme with oleic acid (ELOA), which we
subsequently studied in detail with regard to their struc-
tural and cytotoxic properties.
Complexes of human a-lactalbumin with oleic acid
were first described in the 1990s by Svanborg and
coworkers, and named human a-lactalbumin made
lethal to tumour cells (HAMLET) [26,27]. HAMLET
was produced in vitro in an affinity column loaded
with oleic acid, and it was also shown that HAMLET
is present naturally in the casein fraction of human
milk [26]. Recently, HAMLET has been formed at
higher temperatures of 50 and 60 °C, which facilitated
the dispersal of oleic acid and structural changes in the
protein [28]. Complexes of bovine a-lactalbumin with
oleic acid have also been produced using column chro-
matography and were designated as bovine a-lactalbu-
min made lethal for tumor cells (BAMLET) [29,30].
Because of their unique antitumor activity, the struc-
ture and function of HAMLET and BAMLET have
been studied extensively, however, the nature of the
conformational changes occurring in the proteins upon
their complex formation and the mechanisms of cyto-
toxicity of the complexes are still debated [26,34].
It has been shown that in both complexes human
and bovine a-lactalbumins are partially unfolded or
misfolded even under physiological conditions, and
this may be crucial for the cytotoxicity of their com-
plexes [30,32]. A complex of bovine a-lactalbumin with
polyamines has also been produced and denoted as
LAMPA [35]; the partially unfolded state of a-lactal-
bumin within this complex was distinct from all other
states of monomeric a-lactalbumin characterized to
date. The same authors have shown that monomeric
a-lactalbumin in the absence of fatty acids can bind to
histone H3, which is the primary target of HAMLET
[36], but free a-lactalbumin has not been found to have
antitumor activity. Recently, it has been also shown
that oleic acid can inhibit the amyloid fibril formation
of bovine a-lactalbumin, acting at the initial stages of
oligomerization and fibrillation [37].
Equine lysozyme was selected as the subject of our
studies because it is the closest structural homologue
of a-lactalbumin. Equine lysozyme has been used
extensively as a model in protein folding and amyloid
studies over the last two decades [4–6,16,38–44], and
this has enabled us to reveal a wealth of information
on the mechanisms underlying these processes. By con-
trast to conventional non-calcium-binding c-type lyso-
zymes and similar to a-lactalbumins, equine lysozyme
is a calcium-binding protein [38]; however, it still dis-
plays an enzymatic activity that is characteristic of
lysozymes. As a consequence, it possesses a combina-
tion of the structural and folding properties of both
superfamilies of structurally homologous proteins –
lysozymes and a-lactalbumins. Equine lysozyme is char-
acterized by significantly lower stability and cooper-
ativity than non-calcium-binding lysozymes [4,5,39,
40,44]. It forms a range of partially folded states under
equilibrium destabilizing conditions similar to a-lactal-
bumins [4,5], and also populates kinetic folding inter-
mediates during the refolding reaction similar to c-type
lysozymes [45,46]. Its equilibrium and kinetic interme-
diates as characterized by similar structural properties.
Specifically, equine lysozyme possesses a very stable
core, which retains its native-like conformation even in
the molten globule state [5,6] and which is rapidly
folded and persists in kinetic intermediates [45,46].
Equine lysozyme also forms oligomeric and fibrillar
amyloid assemblies under acidic conditions, where its
partially folded state is populated [42,47]. Its amyloid
oligomers, ranging from tetramers to ecosinomers, dis-
play an amyloid gain-on function, such as apoptotic
activity [42,48]. These oligomers are populated in
very small quantities of only a few percent and tend
to convert rapidly to amyloid protofilaments. There-
fore, the study of stable and well-populated
oligomers of equine lysozyme with oleic acid, which
share HAMLET-like and amyloid properties, may
shed light on both phenomena. The application of a
solid–liquid interface, facilitating protein self-assembly
and protein–oleic acid interactions, proved to be an
efficient approach to produce such complexes and to
model their interactions, which may occur at the
hydrophobic and charged surfaces in both biological
systems and in vitro during the storage of proteina-
ceous materials.
Protein oligomerization induced by oleic acid K. Wilhelm et al.
3976 FEBS Journal 276 (2009) 3975–3989 ª 2009 The Authors Journal compilation ª 2009 FEBS
Results
ELOA complex formation
ELOA complexes were formed using an anion-
exchange column preconditioned with oleic acid, as
described in Materials and methods. ELOA was eluted
as a strong peak at $ 1 m NaCl using a NaCl gradient
of 0–1.5 m (Fig. 1). In the absence of oleic acid, equine
lysozyme was eluted as a narrow peak at a lower NaCl
concentration of 0.67 m. At the front of the ELOA
elution profile there is a small peak, possibly corre-
sponding to equine lysozyme according to its position
in the salt gradient; this was not analysed further.
CD spectroscopy of ELOA
The far- and near-UV CD spectra of ELOA and equine
lysozyme in 10 mm Tris buffer (pH 9.0) are presented in
Fig. 2. The near-UV CD spectrum of ELOA (Fig. 2A)
at 25 °C is much less structured than that of the native
state equine lysozyme, i.e. the minima at 305 and
291 nm, and the maximum at 294 nm are no longer
present, and the magnitude of the ellipticity is dimin-
ished (Fig. 2A). Thermal unfolding of equine lysozyme
at pH 9.0 (Fig. 2C) closely resembles the protein unfold-
ing transition observed previously at pH 4.5, leading to
formation of the partially folded state of a molten glob-
ule type at 57 °C [39]. The near-UV CD spectrum of the
equine lysozyme molten globule at 57 °C is character-
ized by pronounced peaks at the same wavelengths as in
the native state (Fig. 2A), in accord with results
described previously [4,6,39]. By contrast, the overall
amplitude of the near-UV CD spectrum of ELOA at
57 °C is significantly reduced compared with signals
recorded at 25 °C, and resembles the spectrum of ther-
mally unfolded equine lysozyme at 91 °C (Fig. 2A).
The thermal unfolding transition of ELOA was
monitored by changes in ellipticity at 222 nm in the
far-UV CD region (Fig. 2C). It was manifested in an
overall decrease of the CD signal and occurred over
a very board range of temperatures starting at
$ 35 °C and proceeding up to 91 °C. In equine lyso-
zyme alone, two unfolding transitions were observed
over the same thermal range, with the first transition
taking place between $ 35 and 57 °C, leading to an
increase in the amplitude of the CD signal, and the
second occurring between 57 and 91 °C, resulting in
an overall decrease in CD ellipticity.
ELOA spectra in the far-UV CD region recorded at
both 25 and 57 °C do not display the minimum at
230 nm typical of the native state equine lysozyme
spectrum at 25 °C, but exhibit the same shape as the
spectrum for the equine lysozyme molten globule at
57 °C (Fig. 2B). At 91 °C, both ELOA and equine
lysozyme are characterized by the same residual ellip-
ticity typical of the thermally unfolded state (Fig. 2B).
The near- and far-UV CD spectra of ELOA incu-
bated at 37 °C for 24 h did not exhibit any changes,
indicating that ELOA remained stable and did not
undergo any structural changes under these conditions
(data not shown). The CD spectra of equine lysozyme
did not reveal any changes when the protein was coin-
cubated with a 50 fold excess of oleic acid in solution
for 2 h at 20 °C (Fig. 2D). This indicates the impor-
tance of the column environment for ELOA formation.
Binding of fluorescent dyes to ELOA
ELOA binds hydrophobic dye 8-anilinonaphthalene-1-
sulfonate (ANS), which leads to an $ 10-fold increase
in dye fluorescence compared with the free dye in solu-
tion (Fig. 3A). A shorter wavelength shift of the spec-
trum maximum from 515 to 495 nm was also
observed, indicating that ANS is present in the bound
form in a more hydrophobic environment. These
results suggest that the ELOA complex is characterized
by exposed hydrophobic surfaces.
ELOA also binds thioflavin-T (ThT) dye, which is
known for its ability to bind specifically to amyloid
species. In the presence of ELOA, the fluorescence of
ThT increases by approximately sixfold compared with
the free dye in solution (Fig. 3B). This indicates that
ELOA possesses the tinctorial property of amyloids.
UV absorbance at 280 nm
Conductivity (mS·cm
–1
)
0:00 1:00 2:00
200
150
100
50.0
0.00
250
2.00
1.50
1.00
0.50
0.00
Time (h : min)
Fig. 1. ELOA production by anion-exchange chromatography.
Elution profile of ELOA (bold line) produced in the anion-exchange
column preconditioned with oleic acid and the control peak of
equine lysozyme (fine dotted line) eluted from the column without
oleic acid preconditioning. Elution profiles were measured by UV
absorbance at 280 nm (left y axis). The NaCl gradient correspond-
ing to the conductivity of the eluent in mSÆcm
)1
(right y axis) is
shown by a solid line.
K. Wilhelm et al. Protein oligomerization induced by oleic acid
FEBS Journal 276 (2009) 3975–3989 ª 2009 The Authors Journal compilation ª 2009 FEBS 3977
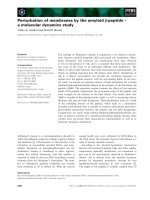
Atomic force microscopy
ELOA was analysed using atomic force microscopy
(AFM) and the images are presented in Fig. 4. ELOA
is characterized by a spherical morphology reflected in
spherical-cup specs of 10–30 A
˚
height as measured in
AFM cross-sections (Fig. 4A). In samples deposited on
mica preincubated with 10 mm NaCl, we observed
ring-shaped assemblies of spherical species, with a
height of $ 10 A
˚
measured along the circumference
(Fig. 4B–D) and a diameter of $ 30 nm between the
highest points of the circumference. Because NaCl bal-
ances negative charges on the mica surface and facili-
tates the adhesion of ELOA, which is also negatively
charged at pH 9.0, this may stabilize the ring assem-
blies of the ELOA oligomers.
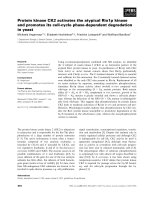
1D and NOESY
1
H NMR spectra
The 1D
1
H NMR spectrum of ELOA at pH 9.0
exhibits very broad aromatic resonances at 8–
6 p.p.m. (Fig. 5C,D) and a complete absence of
resolved methyl peaks in the low-field region of 2.5–
0.5 p.p.m. (data not shown). By contrast, the 1D
1
H NMR spectra of equine lysozyme, either eluted
from the column without oleic acid preconditioning
(Fig. 5A) or freshly dissolved in D
2
O, are character-
ized by well-dispersed resonances in both the aro-
matic and aliphatic regions, closely resembling the
spectra reported previously and assigned to the
native equine lysozyme at pH 4.5 [6].
The positions of resolved resonances of oleic acid in
ELOA were compared with those of free oleic acid in
solution (Fig. 5D). All are consistently shifted up-field:
the peak for free oleic acid at 5.4 p.p.m. is positioned
at 5.24 p.p.m. in the ELOA complex, the 2.1 p.p.m.
peak is at 1.9 p.p.m., the 1.3 p.p.m. peak is at
0
10
20
30
40
50
410 460 510 560
460 480 500 520
Wavelength (nm)
ANS fluorescence
0
2
4
6
8
10
12
Wavelength (nm)
THT fluorescence
A
B
Fig. 3. Interaction of ELOA with fluorescent dyes. (A) Interaction of
ELOA with ANS. The fluorescence spectrum of dye bound to ELOA
is shown by a solid line of the free dye in solution is shown by a
dashed line. (B) Interaction of ELOA with ThT. The fluorescence
spectrum of dye bound to ELOA is shown by a solid line and the
free dye in solution is shown by a dashed line.
260 270 280 290 300 310 320
260 270 280 290 300 310 320
200 210 220 230 240 250
–100
–80
–60
–40
–20
0
20
40
60
80
100
(deg cm
2
·dmol
–1
)
]
[
(deg cm
2
·dmol
–1
)
][
10
–3
(deg cm
2
·dmol
–1
)
]
[
Wavelength (nm)
Wavelength (nm) Wavelength (nm)
–80
–60
–40
–20
0
20
40
60
80
0 102030405060708090100
–8
–7
–6
–5
–4
–3
–2
Temperature (°C)
][
222 nm
10
–3
(deg cm
2·
dmol
–1
)
–12
–8
–10
–6
–4
–2
0
A
B
C
D
Fig. 2. CD spectra of ELOA and equine
lysozyme. (A) Near-UV and (B) far-UV CD
spectra of ELOA at 25 °C (–—), 57 °C( )
and 91 °C(-
‘
-), and equine lysozyme at
25 °C(–Æ – Æ), 57 °C(ÆÆÆ) and 91 °C(-ÆÆ-),
respectively. (C) Thermal unfolding of ELOA
(
) and equine lysozyme (s) monitored by
recording ellipticity at 222 nm. (D) Near-UV
CD spectra of ELOA (—–) and equine lyso-
zyme directly after the addition of a 50-fold
access of oleic acid (- ÆÆ -) and after 2 h incu-
bation with oleic acid (- Æ - Æ -).
Protein oligomerization induced by oleic acid K. Wilhelm et al.
3978 FEBS Journal 276 (2009) 3975–3989 ª 2009 The Authors Journal compilation ª 2009 FEBS
1.2 p.p.m. and the 0.9 p.p.m. peak is at 0.8 p.p.m.,
respectively. This indicates that oleic acid exists in a
different environment within the ELOA complex than
its free form. The spectrum of ELOA was also
recorded in 10 mm NaCl ⁄ P
i
at pH 7.4 (data not
shown), and closely resembled the spectrum shown in
Fig. 5C. The amount of bound oleic acid in ELOA
was determined by comparing the peak area of oleic
acid in its bound form at 5.24 p.p.m. (2 olefinic pro-
tons) with the peak area corresponding to aromatic
proton resonances of lysozyme in the 1D
1
H NMR
spectrum of ELOA. In approximately 20 consecutive
preparations, the ratio of oleic acid to equine lysozyme
in ELOA varied from 11 to 48 depending on the spe-
cific chromatographic conditions during the complex
formation. In general, repetitive saturation of the col-
umn with oleic acid resulted in the formation of
ELOA with a higher oleic acid content.
The 2D
1
H NOESY spectrum of ELOA at pH 9.0 is
shown in Fig. 6 and similar results were obtained at
pH 7.0 (data not shown). The spectrum arising from
the proteinaceous part is characterized by very broad
resonances and we present it at a high contour level to
demonstrate the resonances from oleic acid molecules
integrated into the complex structure. Indeed, the posi-
tive NOE cross-peaks between oleic acid signals at 5.2,
1.8 and 1.1 p.p.m. (Fig. 6A) indicate that oleic acid is
not present in its free form, but within a large mole-
cular complex. Positive NOE cross-peaks were also
observed between oleic acid proton resonances and the
aromatic residue resonances of equine lysozyme in the
region of 6.5–7.5 p.p.m., as shown in Fig. 6B. This
indicates intermolecular binding between lysozyme and
oleic acid and that aromatic residues of equine lyso-
zyme are involved in oleic acid binding.
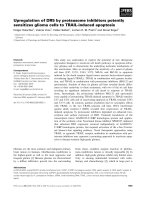
Pulsed field gradient diffusion measurements
The diffusion coefficients of ELOA, native monomeric
equine lysozyme and molten globular equine lysozyme
at pH 2.0 were determined using pulse field gradient
16
12
8
4
0
0 200 400
Vector length (Å)
Height (Å)
600 800
D
A
B
C
Fig. 4. AFM imaging of ELOA. (A) ELOA on a mica surface is
shown as round particles. Scale bar = 200 nm. (B) Ring-shaped
assemblies of ELOA. Scale bar = 100 nm. (C) Individual ring-shaped
assembly. Scale bar = 25 nm. (D) Height profile of ELOA ring
shown in the AFM cross-section; the arrows in (C) and (D) indicate
the position of the cross-section.
p.p.m.
8765
3210
p.p.m.
8 7 68 7 6 8 7 6
ELOA
Oleic acid
A
D
CB
Fig. 5. 1D
1
H NMR spectra of ELOA and equine lysozyme. Aro-
matic regions of 1D
1
H NMR spectra of (A) native equine lysozyme
in 10 m
M Tris, pH 9.0, 25 °C, (B) equine lysozyme molten globule
in 10 m
M glycine, pH 2.0, 25 °C, (C) ELOA in 10 mM Tris, pH 9.0,
25 °C. (D) 1D
1
H NMR spectrum of ELOA (upper) and free oleic
acid (lower), the left-hand panel has been scaled up for demonstra-
tion purposes.
K. Wilhelm et al. Protein oligomerization induced by oleic acid
FEBS Journal 276 (2009) 3975–3989 ª 2009 The Authors Journal compilation ª 2009 FEBS 3979
(PFG) diffusion measurements (Fig. 7). Diffusion coef-
ficients were calculated by analysing diffusion decays
(a representative example is shown in Fig. 7A) accord-
ing to Eqn (1). Because equine lysozyme is present in a
molten globule state within ELOA, the diffusion coeffi-
cient of the molten globule was used as a reference
when calculating the molecular volumes and masses of
ELOA complexes, according to Eqn (2). The diffusion
coefficient of the native state of equine lysozyme was
1.18 times larger than the corresponding value for the
molten globule, indicating an $ 18% larger hydro-
dynamic radius and an $ 60% larger molecular
volume for the molten globule state.
The diffusion coefficients for the ELOA complexes
were determined by following separately the strong
signals of the aromatic residues of equine lysozyme
and the oleic acid protons at 1.15 p.p.m. The diffu-
sion coefficients determined by following the proton
resonances of aromatic residues of lysozyme molecules
were slightly smaller than those derived from monitor-
ing the signals of the oleic acid protons, indicating
that the ELOA preparations contain a small amount
of free oleic acid, estimated to be < 10%. The diffu-
sion coefficients for the ELOA complexes were 0.28–
0.56 times that of the molten globule state of equine
lysozyme (Fig. 7B). Using these values and taking into
account the amount of oleic acid bound to each pro-
tein molecule, the number of equine lysozyme mole-
cules in the ELOA complexes was estimated to be
4–9 in most cases and 30 molecules in one particular
preparation.
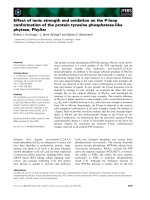
Trypan blue cell-viability assay
The effect of ELOA, oleic acid, equine lysozyme and
the mixture of equine lysozyme with oleic acid on cell
viability was examined using a Trypan blue staining
assay. A mouse embryonic liver cell culture (Fig. 8A)
and mouse embryonic fibroblasts (Doc. S1) were used
for this purpose. ELOA was added at a concentration
of 1.8–12.4 lm. The concentrations of equine lysozyme
5.5
0.5
4.0
3.5
3.0
2.5
2.0
1.5
1.0
5.0
4.5
0.0
4.0
3.0
2.0
1.0
5.0
0.0
Water Buffer
4.0
3.0
2.0
1.0
5.0
6.5
7.0
7.5
p.p.m.
p.p.m.
HC=CH
RCH
3
RC(=0)CH
2
(CH
2
)
n
CH
2
CH=CHCH
2
CH
3
(CH
2
)
7
CH=CH(CH
2
)
7
COOH
Oleic acid:
0.0
¨
A
B
Fig. 6. 2D
1
H NOESY spectrum of ELOA. (A) Assignment of oleic
acid signals in 1D
1
H NMR-spectrum of ELOA (upper) and 2D
1
H
NOESY spectrum of ELOA (lower), showing mostly cross-peaks of
oleic acid at the chosen contour level. (B) Intermolecular cross-
peaks between the proton resonances of oleic acid and the aro-
matic residues of equine lysozyme.
1.2
1.0
0.8
0.6
0.4
0.2
0.0
1 : 11 1 : 16 1 : 24 1 : 30 1 : 43
Relative diffusion coefficient
Molten globule
Native
–1.2
–0.8
–0.4
0.0
0 4000 8000
G
2
ln (I/I
0
)
A
B
Fig. 7. PFG diffusion NMR measurements of ELOA and equine
lysozyme. (A) Representative integral decays ln(I ⁄ I
0
) as a function
of gradient strength G
2
of folded equine lysozyme (s), equine lyso-
zyme molten globule (
) and ELOA (h) (corresponds to an equine
lysozyme ⁄ oleic acid ratio of 1 : 11). (B) Relative diffusion coeffi-
cients of the ELOA complexes with different ratios of equine lyso-
zyme to oleic acid molecules shown above the stripped bars. The
diffusion coefficients of equine lysozyme in the native (white bar)
and molten globule (grey bar) states were used as controls.
Protein oligomerization induced by oleic acid K. Wilhelm et al.
3980 FEBS Journal 276 (2009) 3975–3989 ª 2009 The Authors Journal compilation ª 2009 FEBS
and oleic acid used were equivalent to their content in
the ELOA complex. The cells were incubated with
the corresponding compounds for 1.5, 5 and 24 h. The
viability of mouse embryonic liver cells decreased
significantly within 1.5 h of incubation at all ELOA
concentrations used; in the presence of 1.8–8.9 lm
ELOA it decreased by $ 20%, at a higher ELOA con-
tent of 12.4 lm it decreased by $ 40%. Cell viability
decreased by $ 70% upon the addition of 8.9 lm
ELOA after 5 h and by $ 80% after 24 h of incuba-
tion. The survival of cells treated with 12.4 lm ELOA
did not exceed $ 20% after either 5 or 24 h of incuba-
tion. Even at its highest concentration, equine lyso-
zyme alone did not affect the viability of mouse
embryonic liver cells (data not shown). The reduction
in cell viability induced by 85–596 lm oleic acid was
within $ 10% (Fig. 8B); the same effect was observed
when cells were added to a mixture of oleic acid within
the same concentration range and equine lysozyme at
its highest concentration (data not shown).
Mouse embryonic fibroblast culture was also treated
with ELOA and the results of the cell viability assessed
by Trypan blue staining assay are presented in Fig. S1.
Cell viability decreased by $ 90% in the presence of
8.9 lm ELOA after 1.5–24 h of incubation, whereas
85–596 lm oleic acid reduced cell viability by $ 10%
Equine lysozyme Oleic acid ELOA
Oleic acid added (µM)
Control
85
255 426 596
Cell viability (%) Cell viability (%)
0
20
40
60
80
100
120
0
20
40
60
80
100
120
Control
1.8
5.3 8.9 12.4
Complex added (µM)
**** ****** ****** ******
C
A
B
Fig. 8. Effect of ELOA on cell viability. Via-
bility of mouse embryonic liver cell culture
coincubated with (A) ELOA and (B) oleic
acid. Untreated cells were used as a control
and their viability was set at 100% (black
bars). The viability of cells coincubated with
ELOA or oleic acid for 1.5 h is shown by
grey bars, the viability of cells coincubated
for 5 h is shown by white bars and the via-
bility of cells coincubated for 24 h is shown
by striped bars. *P < 0.05, **P < 0.01. (C)
Acridine orange and ethidium bromide stain-
ing of murine embryonic liver cells treated
with ELOA and its components. Alive cells
treated with 12.4 l
M equine lysozyme (left)
and 596 l
M oleic acid (central) for 5 h are
stained with acridine orange, showing a
green fluorescence. Cells exposed to
12.4 l
M ELOA for 5 h (right) show both acri-
dine orange (green) and ethidium bromiden
(orange) staining, indicating cell death. Scale
bar = 100 lm.
11 min 58 min 59 min 60 min
10 µm
Fig. 9. Imaging ELOA interactions with live cells. Time-dependent accumulation of ELOA labelled with Alexa Fluor (shown in bright green) in
the vicinity of live PC12 cells up to 58 min of coincubation. At 59 min, the cell wall was ruptured, allowing ELOA to stream in and fill the cell
interior (60 min).
K. Wilhelm et al. Protein oligomerization induced by oleic acid
FEBS Journal 276 (2009) 3975–3989 ª 2009 The Authors Journal compilation ª 2009 FEBS 3981
after 1.5 h and by $ 30% after 24 h of incubation.
Equine lysozyme alone did not induce cellular toxicity
and a mixture of equine lysozyme and oleic acid at
their highest concentrations within the range examined
here produced the same effect as oleic acid alone (data
not shown).
The ELOA complexes with different protein to oleic
acid ratios were used in the cytotoxicity experi-
ments, including ratios of 1 : 20, 1 : 40 and 1 : 48.
Their cytotoxicity depended on the concentration of the
proteinaceous component, determined by measuring
absorbance spectra. This indicates that the proteina-
ceous component, but not oleic acid, is a critical factor
in defining the cytotoxicity of ELOA complexes. Fur-
ther studies are needed to provide more detail on the
structure–function relationship of ELOA complexes.
Acridine orange
⁄
ethidium bromide staining
Mouse embryonic liver cells treated with ELOA
(12.4 lm), equine lysozyme (12.4 lm) and oleic acid
(596 lm) for 1.5, 5 and 24 h were subjected to acridine
orange and ethidium bromide staining. Representative
images of the stained cells after 5 h of treatment are
given in Fig. 8C. Acridine orange permeates all cells
leading to green fluorescence. In the presence of equine
lysozyme and oleic acid, live cells appeared green in
$ 90% of cases. Ethidium bromide is taken up by
cells if their cytoplasmic membrane integrity is lost.
Ethidium bromide interacts with DNA in apoptotic
cells, giving an orange fluorescence; ethidium bromide
fluorescence usually predominates over acridine orange
uptake. Orange ⁄ green staining was seen in $ 80% of
all cells treated with ELOA (Fig. 8C), indicating
apoptotic type cell death [49].
Imaging of ELOA interactions with live cells
In order to observe interactions between ELOA and
live cells, the complex was fluorescently labelled with
the amine-reactive dye Alexa Fluor 488 and live PC12
cells were subsequently incubated with fluorescently
labelled ELOA. A concentration of fluorescently
labelled ELOA of 850 nm was determined in bulk
medium, using quantitative imaging by confocal laser
scanning microscopy (CLSM) [50] and fluorescence
correlation spectroscopy (FCS), techniques that enable
nondestructive observation of molecular interactions in
live cells with single-molecule sensitivity. The time
course of ELOA interactions with live cells was studied
using time-lapsed CLSM (Fig. 9). We observed that
ELOA accumulated continuously in the vicinity of the
cell membrane over a period of 58 min, reaching a
10-fold higher local concentration than the bulk con-
centration in solution. During this time, cells were able
to ‘resist’ ELOA and significant uptake of the complex
was not detected. At a pivotal time point of coincuba-
tion (59 min), cell membranes ruptured in a coopera-
tive manner and ELOA streamed into the cells, filling
the whole cellular interior almost instantaneously
(60 min). Such effect was not observed for equine lyso-
zyme alone (data not shown), which did not disrupt
+
+
+
+
+
+
+
+
Sepharose matrix
Sepharose matrix
Sepharose matrix
A
D
BC
Sepharose matrix
Fig. 10. Schematic representation of the
ELOA formation at the solid–liquid interface
within column chromatography. (A) The
Sepharose matrix is positively charged
under our experimental conditions. (B) Bind-
ing of oleic acid to the matrix precedes
ELOA formation. (C) Folded equine lyso-
zyme molecules added to the column are
shown in space-filling and ribbon-diagram
representations. The exposed hydrophilic
residues are denoted in purple and the bur-
ied hydrophobic residues in grey. (D) During
interaction with the solid–liquid interface in
the column, the hydrophobic residues (grey)
become exposed in the molten globule
state of equine lysozyme and its molecules
assemble with each other and with oleic
acids to form ELOA (encircled sche-
matically).
Protein oligomerization induced by oleic acid K. Wilhelm et al.
3982 FEBS Journal 276 (2009) 3975–3989 ª 2009 The Authors Journal compilation ª 2009 FEBS
cellular membranes and did not cause cell damage over
6 h of observation.
Discussion
We demonstrated that the self-assembly of equine lyso-
zyme into stable oligomers can be induced in an
anion-exchange chromatography column precondi-
tioned with oleic acid, as outlined in Fig. 10. It is
important to note that coincubation of a 50 fold excess
of oleic acid with equine lysozyme in solution did not
lead to ELOA formation, as evident from the near-UV
CD measurements (Fig. 2C). Oleic acid molecules
bound to the ion-exchange matrix constitute an
extended surface, facilitating both charged and hydro-
phobic interactions with equine lysozyme molecules.
Such a surface may effectively model the cell lipid
membranes able to induce protein–ligand interactions,
which would not otherwise occur in solution. Indeed,
in solution, oleic acid, like many other small aliphatic
molecules, would be present as a micelle. Concomi-
tantly, the solid–liquid interface may induce partial
unfolding of equine lysozyme and exposure of the
hydrophobic surfaces buried in the native state; this
may also be critical for ELOA complex formation. It
is important to note that extensive studies have
recently been conducted to characterize the conforma-
tional changes occurring at the solid hydrophobic
interfaces in hen egg white lysozyme, which is a struc-
tural homologue to equine lysozyme [44]. A suggested
model of conformational change included conversion
of the initial a-helical structures into random coil ⁄ turn
and subsequently into b sheet [51–53]. Such structural
changes are a key event in oligomeric and fibrillar
amyloid assembly. Equine lysozyme is significantly less
cooperative than hen egg white lysozyme [5,6,46] and
is more prone to structural rearrangement and aggre-
gation. Therefore, under our experimental conditions,
it readily assembled into well-defined ELOA com-
plexes, preserved as a stable fraction in solution for
up to a week. It is worth noting that complexes of
hen egg white lysozyme with oleic acid were also
produced under the same conditions, but they were
significantly less populated and easily lost oleic acid
(data not shown). Complexes of human a-lactalbumin
with oleic acid, HAMLET, were also produced using
column chromatography [32]. Remarkably, a multi-
meric active complex of a-lactalbumin with oleic acid
was isolated and purified from the casein fraction of
human milk [26,27] and denoted as multimeric a-lact-
albumin (MAL), which indicates that the solid–liquid
interfaces of the chromatography column may mimic
in vivo conditions.
Equine lysozyme within the ELOA complex is pres-
ent in a partially unfolded state, as evident from the
near- and far-UV CD spectra (Fig. 2A,D), ANS bind-
ing (Fig. 3A) and the decreased dispersion seen in the
1D
1
H NMR spectrum (Fig. 5C). The near-UV CD
spectrum of ELOA exhibits lower ellipticity values and
largely overlapping peaks compared with the native
and even molten globule states of equine lysozyme
(Fig. 2A) [6,39]. This indicates that the protein tertiary
structure within ELOA may be even more disordered
than in its molten globule state. Examination of the
1D
1
H NMR spectrum of ELOA clearly shows up-field
shifts of the resonance of oleic acid incorporated
within the complex compared with the resonances of
free oleic acid, demonstrating that oleic acid molecules
are an integral part of ELOA. They interact directly
with the aromatic residues of lysozyme, as demon-
strated by the presence of cross-peaks between the pro-
tons of aromatic residues and oleic acid observed in
the
1
H NOESY spectrum of ELOA (Fig. 6B).
The number of protein and oleic acid molecules
varies within ELOA complexes produced in different
preparations. We have shown that 11–48 oleic acids
can bind to each equine lysozyme molecule, depending
on the specific chromatographic conditions during
complex formation. The number of equine lysozyme
molecules in ELOA can also vary from 4 to 30, as
determined by PFG diffusion measurements. Previ-
ously, we observed the formation of oligomers of
equine lysozyme under amyloid-inducing conditions at
acidic pH, which also ranged from tetramers to ecosi-
nomers and larger [42], however, they never constituted
more than a few percent of the total amount of mono-
meric equine lysozyme in solution. This is in contrast
to ELOA, which constitutes the majority of molecular
species in the samples. In this respect, ELOA resembles
the HAMLET-type complex of a-lactalbumin with
oleic acid extracted from the casein fraction of human
milk, which is also oligomeric in nature [26,31].
ELOA complexes display properties similar to those
of equine lysozyme amyloid oligomers, for example,
ThT binding and their morphological appearance as
shown by AFM. In a similar way to equine lysozyme
oligomers, ELOA also forms ring-shaped assemblies
(Fig. 4). By contrast to equine lysozyme and a-lactal-
bumin amyloid oligomers, which are populated
on-pathway to amyloid fibrils [47,54], the ELOA com-
plex did not produce polymeric structures upon pro-
longed incubation in our experiments. This suggests
that oleic acid stabilizes the oligomeric complex, pre-
venting its further conversion and assembly into larger
polymers. Some other surfactants and compounds such
as SDS and fatty acids were also applied to Ab pep-
K. Wilhelm et al. Protein oligomerization induced by oleic acid
FEBS Journal 276 (2009) 3975–3989 ª 2009 The Authors Journal compilation ª 2009 FEBS 3983
tide, a-synuclein and other amyloidogenic proteins to
stabilize their oligomers as opposed to fibrils [55].
Although prefibrillar proteinaceous structures encom-
pass a wide variety of species, studies of kinetically
trapped ELOA complexes can shed light on the struc-
tural and functional properties of pre-fibrillar species
and their role in ‘on-’ and ‘off’-pathway’ amyloid
assembly.
It is interesting to note that the thermal unfolding
transition of ELOA occurs over a very wide tempera-
ture range and broadly coincides with two unfolding
transitions of equine lysozyme alone under the same
conditions. However, two transitions were not noticed
in ELOA and we did not observed an increase in
ellipticity signals during ELOA unfolding, which is a
distinguishing feature of the first transition in equine
lysozyme [39,46]. This indicates that the confor-
mational changes in ELOA and equine lysozyme
alone may have different structural origina. Similarly,
HAMLET was slightly less stable than human a-lactal-
bumin in the presence of calcium towards thermal
denaturation and exhibited the same stability as
human a-lactalbumin towards urea denaturation [56].
This indicates that oleic acid has a similar effect on the
structural stability of both complexes.
We have shown that ELOA is cytotoxic towards dif-
ferent cell types, including mouse embryonic liver cell
culture, mouse embryonic fibroblast culture, a neuro-
blastoma cell line (SH-SY5Y) and a rat phreochromcy-
toma (PC12) cell line. Combined staining with acridine
orange and ethidium bromide indicated that ELOA
induces apoptotic-type cell death. In order to gain fur-
ther insight into the mechanisms underlying cellular tox-
icity, we studied the interactions of ELOA with live cells
by using single molecular techniques such as CLSM and
FCS (Fig. 9). Our results showed that ELOA initially
accumulated actively in the vicinity of the cell mem-
brane, implying that the cell membrane is a primary
target for ELOA toxic activity. We presume that inter-
actions of ELOA with the cell membrane trigger apop-
totic stimuli, proceeding from the plasma membrane to
the cell interior without ELOA internalization per se
and consequently trigger cell death. ELOA internaliza-
tion occurred after the cell membrane rupture.
It is important to note that equine lysozyme oligo-
mers are also cytotoxic, inducing apoptosis in similar
cell types [42]. HAMLET complexes have been shown
to cause cell death in cancer and immature cells, but
not in healthy differentiated cells [30,57]. Thus, a range
of various protein oligomeric complexes can induce
cytotoxicity, even though their structural properties
differ from each other, and this requires further
detailed investigation [7,11,58]. In all these complexes,
including ELOA, cytotoxicity is a newly gained prop-
erty, acquired as a result of their self-assembly and, in
the case of ELOA, also because of the interaction with
oleic acid. Oleic acid itself can induce some cytotoxic
effects [59–62], but its cytotoxicity is significantly lower
than that of proteinaceous complexes (Figs 8 and S1).
These results emphasize the role of protein self-assem-
bly in producing the cytotoxic effect. To date, exten-
sive information has been gathered on the mechanisms
behind the cytotoxicity of HAMLET and amyloid
oligomers, however, there is no clear consensus.
Because equine lysozyme can form both ELOA com-
plexes and amyloid oligomers, in-depth studies of their
molecular properties and induced cytotoxicity would
provide a clearer insight into both these phenomena
and any link between them.
In conclusion, using hydrophobic surfaces in column
chromatography, we produced highly populated
ELOA complexes, composed of partially unfolded pro-
tein molecules and oleic acid. These complexes have
some common structural and cytotoxic features with
amyloid oligomers of equine lysozyme and with HAM-
LET. These complexes are stable and therefore amena-
ble to structural characterization at atomic resolution,
whereas the amyloid oligomers are often transient in
nature and not populated in significant proportions.
By producing ELOA, we have shown that other pro-
teins besides human and bovine a-lactalbumins can
form such structures, which widens the scope of the
HAMLET-type phenomenon. Proteins provide an
unlimited source of varying properties and functions,
among them protein complexes, which if well-charac-
terized, can be used profitably in various therapeutic
and biotechnological applications with the potential to
target specifically undesirable cells.
Materials and methods
Materials
Equine lysozyme was purified from horse milk, as described
previously [63]. Oleic acid and all chemicals were purchased
from Sigma (Stockholm, Sweden), unless stated otherwise.
The protein concentration was determined by absorbance
measurements on a NanoDrop spectrophotometer (Nano-
Drop Technologies, Wilmington, DE, USA) at 280 nm
using an extinction coefficient of E
1%
= 23.5.
Production of ELOA by anion-exchange
chromatography
ELOA was produced using 1 or 5 mL DEAE FF Sepharose
columns (Amersham Biosciences, Piscataway, NJ, USA) con-
Protein oligomerization induced by oleic acid K. Wilhelm et al.
3984 FEBS Journal 276 (2009) 3975–3989 ª 2009 The Authors Journal compilation ª 2009 FEBS
nected to a Bio-Rad chromatographic system (BioLogic
Wokstation, Bio-Rad, Hercules, CA, USA) and conditioned
with oleic acid. Fifty microlitres of 99.5% oleic acid were dis-
solved in 50 lL of 99.5% ethanol and sonicated in a Trans-
sonic 310 sonicator (Elma, Singen, Germany) for 15 min.
Then, 700 lLof10mm Tris ⁄ HCl buffer, pH 9.0 were added
and the final solution was sonicated again for 15 min. The
resulting mixture was loaded onto the column and dispersed
through the DEAE Sepharose matrix, using a linear NaCl
gradient of 0–1.5 m in 10 mm Tris ⁄ HCl buffer, pH 9.0. The
column was washed with a 10-bed volume of 10 mm
Tris ⁄ HCl buffer, pH 9.0. Equine lysozyme in 10 mm
Tris ⁄ HCl, pH 9.0, was loaded onto the column and the
ELOA complex was eluted by a linear NaCl gradient of
0–1.5 m. ELOA was dialysed against a 3 · 200-fold volume
excess of 10 mm ammonium acetate, containing 60 lm fatty
acid free bovine serum albumin, pH 9.0, for a minimum of
2 h each time (Slide-A-Lyzer, membrane cut-off 3 kDa;
Pierce, Rockford, IL, USA) and lyophilized.
Spectroscopic measurements
CD spectra were recorded in a Jasco J-810 spectropolarime-
ter (Jasco, Tokyo, Japan) equipped with a Jasco CDF-426L
thermostat, using 0.1- and 0.5-cm path length cuvettes. At
least three scans were averaged for each spectrum.
Fluorescence measurements were performed on a Jasco
spectrofluorometer FP-6500 (Jasco). The ThT-binding amy-
loid assay was carried out using a modification of the
method described by LeVine [64]. ThT fluorescence was
recorded using excitation at 440 nm, emission between 450
and 550 nm and setting the excitation and emission slits at
5 nm. The fluorescence of the hydrophobic dye ANS was
recorded using excitation at 350 nm and emission between
410 and 600 nm, with the excitation and emission slits set
at 3 nm.
AFM measurements
AFM measurements were performed on a Pico Plus micro-
scope (Agilent, Santa Clara, CA, USA) in tapping mode,
using a 100 nm scanner with acoustically driven cantilevers.
TESP model cantilevers with etched silicon probes of diame-
ter £ 10 nm (Veeco, Plainview, NY, USA) operated at
frequencies of 170–190 or 320–370 kHz. The scanning reso-
lution was 256 · 256 pixels. Scanning was performed in
trace and retrace to avoid scan artefacts. Images were flat-
tened and plane adjusted. Samples were diluted in Milli-Q
water to a final concentration of 20–100 lgÆmL
)1
, placed on
mica, left for up to 5 min, rinsed three times with Milli-Q
water and air-dried at room temperature overnight. Freshly
cleaved mica (GoodFellow, Devon, PA, USA) or mica
preincubated with 10 mm NaCl for 10 min was used. The
dimensions of ELOA species were measured in cross-section
in AFM height images using pico plus software (Agilent).
NMR spectroscopy
1D
1
H NMR spectra were recorded using a Bruker
600 MHz spectrometer equipped with a
1
H,
13
C,
15
N cryo
probe. NMR samples were prepared by dissolving
$ 0.5 mg lyophilized ELOA in 500 lLD
2
O, 10 mm Tris
or 10 mm NaCl ⁄ P
i
pH at 9.0 or 7.2 to yield a protein
concentration of $ 50 lm . The molar ratio between oleic
acid and lysozyme in the complex was determined by
comparing the peak areas of oleic acid olefinic proton
resonances with the lysozyme aromatic signals. 2D
1
H
NOESY spectra were recorded at 25 °C, using a mixing
time of 150 ms, 8 scans and 272 increments (experimental
time $ 1.5 h).
PFG diffusion measurements were performed using the
bipolar pulse-pair diffusion experiment [65] and analysed as
described previously [66]. In the diffusion experiments, the
signal intensity was attenuated as a function of gradient
strength and, if other factors were constant, signal intensity
(I) relative to that in the absence of gradients (I
0
) was given
by Eqn (1):
I=I
0
¼ exp Àððc
H
Þ
2
d
2
ðD À d=3 À s=2ÞD
T
G
2
Þð1Þ;
where G, d, D and s correspond to amplitude, duration,
time between PFGs, and recovery time after PFGs, respec-
tively; chis
1
H gyromagnetic ratio and Dt is translational
diffusion coefficient, respectively. Assuming that the pro-
teinaceous particles are spherical and neglecting density
changes, the mass of the complexes was determined using
Eqn (2):
M
ELOA
=M
EL
¼ðD
EL
=D
ELOA
Þ
3
ð2Þ;
where M
ELOA
and M
EL
are molecular masses, and D
ELOA
and D
EL
diffusion coefficients of the ELOA complex and
monomeric equine lysozyme in the molten globule state
used as a reference. The number of equine lysozyme mole-
cules in ELOA was calculated by dividing the molecular
mass of the complex (M
ELOA
) by the molecular mass of
equine lysozyme coordinated with oleic acids, according to
the stochiometry determined from 1D
1
H NMR spectrum.
Cell cultures
Mouse embryonic liver cell culture, mouse embryonic fibro-
blasts and human neuroblastoma SH-SY5Y cell line were
cultured in a Dulbecco’s modified Eagle’s medium supple-
mented with 10% (v ⁄ v) fetal bovine serum and antibiotics
in a 5% CO
2
humidified atmosphere at 37 °C. Cells were
plated at a density of 10
4
cellsÆwell in 96-well plates, cell
viability was assayed after 1.5, 5 and 24 h of coincubation
with ELOA and respective controls. ELOA was diluted in
serum-free culture medium to the required concentrations
and then added to the cells. Oleic acid was diluted in etha-
K. Wilhelm et al. Protein oligomerization induced by oleic acid
FEBS Journal 276 (2009) 3975–3989 ª 2009 The Authors Journal compilation ª 2009 FEBS 3985
nol prior to the addition to culture media. The effect on
cells of equivalent concentrations of ethanol was examined
and shown to not affect the cell viability.
PC12 cells, pheochromocytoma cells derived from rat
adrenal medulla, were obtained from the American Type
Culture Collection (ATCC). The cells were cultured in col-
lagen-coated flasks in RPMI 1640 medium supplemented
with 5% fetal bovine serum, 10% heat-inactivated horse
serum, 100 UÆmL
)1
penicillin and 100 lgÆmL
)1
streptomy-
cin (all from Invitrogen, Stockholm, Sweden), and main-
tained in a 5% CO
2
humidified atmosphere at 37 °C. The
medium was replaced every 2–3 days. For CLSM experi-
ments, cells were plated in eight-well chambered coverslips
(Nalge Nunc International, Rochester, NY, USA) and
grown in phenol-red-free RPMI medium supplemented
with 10% horse serum, 5% fetal bovine serum, penicillin
(100 unitsÆmL
)1
) and streptomycin (100 lgÆmL
)1
). Average
cell density at plating was $ 1 · 10
5
cellsÆcm
)2
in 300 lL
medium. The cells were observed for 2–3 days after
plating.
Trypan blue assay
The viability of mouse embryonic liver cells and mouse
embryonic fibroblasts (Supporting information) was mea-
sured by using a Trypan blue exclusion assay. Cells were
harvested from the plates after 5 min treatment with 0.25%
trypsin and 0.02% EDTA solution containing phenol red
(Biological Industries, Kibbutz beit Haemek, Israel). Cells
were maintained in culture media containing 10% fetal
bovine serum (Biological Industries), then sedimented by
centrifugation for 10 min at 400 g and resuspended in
100 lL NaCl ⁄ P
i
solution (without Ca and Mg). Cells were
then stained by adding 100 lL 0.4% Trypan blue solution
for 5 min and counted under a light microscope using a
Neubauer counting chamber. The viable cells were
unstained, whereas the dead cells displayed a blue colour;
the counts were evaluated using standard statistical analysis
techniques.
Acridine orange/ethidium bromide staining
The dyes acridine orange and ethidium bromide were used
to discriminate between live and dead cells on the basis of
their membrane integrity. Acridine orange and ethidium
bromide (100 lgÆmL
)1
) were mixed in a ratio of 1 : 1.
After harvesting, cells were centrifuged for 10 min at
400 g, and the cell pellet resuspended in 25 lL NaCl ⁄ P
i
.
Then 1 lL of the dye mixture was added and cells were
examined immediately under a Leica fluorescent micro-
scope (Leica, Wetzlar, Germany) equipped with a green
excitation filter block G-2E ⁄ C. Cells were counted in four
randomly selected areas each containing $ 100 cells to
quantify cell viability.
Fluorescent labelling of ELOA
ELOA was labelled with Alexa Fluor 488 dye, using the
protein labelling protocol provided by the producer
(Invitrogen). Excess free dye was removed using a protein
desalting column PD10 (GE Healthcare, USA).
FCS/CLSM measurements
FCS ⁄ CLSM measurements were performed on a uniquely
modified LSM 510 instrument (Carl Zeiss, Jena, Germany),
equipped with an inverted microscope for transmitted light
and epifluorescence (Axiovert 200 m); a VIS-laser module
comprising the Ar ⁄ ArKr (458, 477, 488 and 514 nm), HeNe
543 nm and HeNe 633 nm lasers and the scanning module
LSM 510 mETA. The instrument was modified to enable
avalanche photodiode imaging using silicon avalanche pho-
todiodes (SPCM-AQR-1X; Perkin–Elmer, Fremont, CA,
USA). Images were recorded without averaging, using a
scanning speed of h = 25.6 lsÆpixel
)1
and 512 · 512 pixel
resolution. The C-Apochromat 40·⁄1.2 W UV-VIS-IR
objective was used in all measurements. Alexa Fluor was
excited using the 488 nm line of the Ar ⁄ ArKr laser. Quanti-
tative measurements were achieved by quantitative APD
imaging [50] performed on an integrated FCS/CSLM
instrument.
Statistical analysis
All cell viability experiments were performed in triplicate.
The experimental results were analysed by Student’s paired
t-test and are shown as mean ± SEM. The level of statisti-
cal significance was set at P < 0.05 for the ELOA-treated
cells versus the cells treated with oleic acid. *, P < 0.05;
**, P < 0.01.
Molecular graphics
Images of equine lysozyme [67] were produced using
molmol graphic program.
Acknowledgements
We thank Catharina Svanborg for drawing our atten-
tion to the very promising HAMLET field, Christo-
pher Aisenbrey and Sohyun Kim for valuable research
assistance and Nils Elfving for supplying equine milk
from his horse farm in Arna
¨
svall, Sweden. This
research was supported by grants from the Swedish
Research Council, the Wallenberg and the Kempe
foundations, The Swedish Brain Foundation, the Bio-
technology program, and Insamlingstiftelsen, Umea
˚
,
Sweden.
Protein oligomerization induced by oleic acid K. Wilhelm et al.
3986 FEBS Journal 276 (2009) 3975–3989 ª 2009 The Authors Journal compilation ª 2009 FEBS
References
1 Uversky VN (2003) Protein folding revisited. A poly-
peptide chain at the folding–misfolding–nonfolding
cross-roads: which way to go?. Cell Mol Life Sci 60,
1852–1871.
2 Dobson CM (2003) Protein folding and misfolding.
Nature 426, 884–890.
3 Morozova-Roche LA & Malisauskas M (2007) A false
paradise - mixed blessings in the protein universe: the
amyloid as a new challenge in drug development. Curr
Med Chem 14, 1221–1230.
4 Van Dael H, Haezebrouck P, Morozova L, Arico-
Muendel C & Dobson CM (1993) Partially folded states
of equine lysozyme. Structural characterization and
significance for protein folding. Biochemistry 32, 11886–
11894.
5 Morozova LA, Haynie DT, Arico-Muendel C, Van
Dael H & Dobson CM (1995) Structural basis of the
stability of a lysozyme molten globule. Nat Struct Biol
2, 871–875.
6 Morozova-Roche LA, Arico-Muendel CC, Haynie DT,
Emelyanenko VI, Van Dael H & Dobson CM (1997)
Structural characterisation and comparison of the
native and A-states of equine lysozyme. J Mol Biol 268,
903–921.
7 Stefani M (2007) Generic cell dysfunction in neurode-
generative disorders: role of surfaces in early protein
misfolding, aggregation, and aggregate cytotoxicity.
Neuroscientist 13, 519–531.
8 Vestergaard B, Groenning M, Roessle M, Kastrup JS,
van de Weert M, Flink JM, Frokjaer S, Gajhede M &
Svergun DI (2007) A helical structural nucleus is the
primary elongating unit of insulin amyloid fibrils. PLoS
Biol 5, e134.
9 Morozova-Roche LA, Zurdo J, Spencer A, Noppe W,
Receveur V, Archer DB, Joniau M & Dobson CM
(2000) Amyloid fibril formation and seeding by wild-
type human lysozyme and its disease-related mutational
variants. J Struct Biol 130, 339–351.
10 Harper JD & Lansbury PT Jr (1997) Models of amyloid
seeding in Alzheimer’s disease and scrapie: mechanistic
truths and physiological consequences of the time-
dependent solubility of amyloid proteins. Annu Rev Bio-
chem 66, 385–407.
11 Gharibyan AL, Zamotin V, Yanamandra K, Moskaleva
OS, Margulis BA, Kostanyan IA & Morozova-Roche
LA (2007) Lysozyme amyloid oligomers and fibrils
induce cellular death via different apoptotic ⁄ necrotic
pathways. J Mol Biol 365, 1337–1349.
12 Haataja L, Gurlo T, Huang CJ & Butler PC (2008) Islet
amyloid in type 2 diabetes, and the toxic oligomer
hypothesis. Endocrin Rev 29, 303–316.
13 Vieira MN, Forny-Germano L, Saraiva LM, Sebollela
A, Martinez AM, Houzel JC, De Felice FG &
Ferreira ST (2007) Soluble oligomers from a non-
disease related protein mimic Abeta-induced tau hyper-
phosphorylation and neurodegeneration. J Neurochem
103, 736–748.
14 Kayed R, Head E, Thompson JL, McIntire TM, Milton
SC, Cotman CW & Glabe CG (2003) Common struc-
ture of soluble amyloid oligomers implies common
mechanism of pathogenesis. Science 300, 486–489.
15 Bucciantini M, Giannoni E, Chiti F, Baroni F, Formigli
L, Zurdo J, Taddei N, Ramponi G, Dobson CM &
Stefani M (2002) Inherent toxicity of aggregates implies
a common mechanism for protein misfolding diseases.
Nature 416, 507–511.
16 Morozova-Roche LA, Zamotin V, Malisauskas M,
Ohman A, Chertkova R, Lavrikova MA, Kostanyan
IA, Dolgikh DA & Kirpichnikov MP (2004) Fibrillation
of carrier protein albebetin and its biologically active
constructs. Multiple oligomeric intermediates and
pathways. Biochemistry 43, 9610–9619.
17 Kirkitadze MD, Condron MM & Teplow DB (2001)
Identification and characterization of key kinetic inter-
mediates in amyloid beta-protein fibrillogenesis. J Mol
Biol 312, 1103–1119.
18 Zamotin V, Gharibyan A, Gibanova NV, Lavrikova
MA, Dolgikh DA, Kirpichnikov MP, Kostanyan IA &
Morozova-Roche LA (2006) Cytotoxicity of albebetin
oligomers depends on cross-beta-sheet formation. FEBS
Lett 580, 2451–2457.
19 Harper JD, Wong SS, Lieber CM & Lansbury PT
(1997) Observation of metastable Abeta amyloid
protofibrils by atomic force microscopy. Chem Biol 4,
119–125.
20 Canet D, Sunde M, Last AM, Miranker A, Spencer A,
Robinson CV & Dobson CM (1999) Mechanistic stud-
ies of the folding of human lysozyme and the origin of
amyloidogenic behavior in its disease-related variants.
Biochemistry 38, 6419–6427.
21 Sliwinski-Korell A, Engelhardt H, Kampka M & Lutz
F (1999) Oligomerization and structural changes of the
pore-forming Pseudomonas aeruginosa cytotoxin. Eur J
Biochem 265, 221–230.
22 Sharon R, Bar-Joseph I, Frosch MP, Walsh DM, Ham-
ilton JA & Selkoe DJ (2003) The formation of highly
soluble oligomers of alpha-synuclein is regulated by
fatty acids and enhanced in Parkinson’s disease. Neuron
37, 583–595.
23 Gellermann GP, Byrnes H, Striebinger A, Ullrich K,
Mueller R, Hillen H & Barghorn S (2008) A beta-
globulomers are formed independently of the fibril
pathway. Neurobiol Dis 30, 212–220.
24 Nagarajan S, Ramalingam K, Neelakanta Reddy P,
Cereghetti DM, Padma Malar EJ & Rajadas J (2008)
Lipid-induced conformational transition of the amyloid
core fragment Abeta(28-35) and its A30G and A30I
mutants. FEBS J 275, 2415–2427.
K. Wilhelm et al. Protein oligomerization induced by oleic acid
FEBS Journal 276 (2009) 3975–3989 ª 2009 The Authors Journal compilation ª 2009 FEBS 3987
25 Otzen DE, Nesgaard LW, Andersen KK, Hansen JH,
Christiansen G, Doe H & Sehgal P (2008) Aggregation
of S6 in a quasi-native state by sub-micellar SDS. Bio-
chim Biophys Acta 1784, 400–414.
26 Hakansson A, Zhivotovsky B, Orrenius S, Sabharwal H
& Svanborg C (1995) Apoptosis induced by a human
milk protein. Proc Natl Acad Sci USA 92, 8064–8068.
27 Hakansson A, Andreasson J, Zhivotovsky B, Karpman
D, Orrenius S & Svanborg C (1999) Multimeric alpha-
lactalbumin from human milk induces apoptosis
through a direct effect on cell nuclei. Exp Cell Res 246,
451–460.
28 Kamijima T, Ohmura A, Sato T, Akimoto K, Itabashi
M, Mizuguchi M, Kamiya M, Kikukawa T, Aizawa T,
Takahashi M et al. (2008) Heat-treatment method for
producing fatty acid-bound alpha-lactalbumin that
induces tumor cell death. Biochem Biophys Res Commun
376, 211–214.
29 Svensson M, Fast J, Mossberg AK, Duringer C,
Gustafsson L, Hallgren O, Brooks CL, Berliner L,
Linse S & Svanborg C (2003) Alpha-lactalbumin
unfolding is not sufficient to cause apoptosis, but is
required for the conversion to HAMLET (human
alpha-lactalbumin made lethal to tumor cells). Protein
Sci 12, 2794–2804.
30 Mok KH, Pettersson J, Orrenius S & Svanborg C
(2007) HAMLET, protein folding, and tumor cell
death. Biochem Biophys Res Commun 354, 1–7.
31 Svensson M, Sabharwal H, Hakansson A, Mossberg
AK, Lipniunas P, Leffler H, Svanborg C & Linse S
(1999) Molecular characterization of alpha-lactalbumin
folding variants that induce apoptosis in tumor cells.
J Biol Chem 274, 6388–6396.
32 Svensson M, Hakansson A, Mossberg AK, Linse S &
Svanborg C (2000) Conversion of alpha-lactalbumin to
a protein inducing apoptosis. Proc Natl Acad Sci USA
97, 4221–4226.
33 Svensson M, Duringer C, Hallgren O, Mossberg AK,
Hakansson A, Linse S & Svanborg C (2002) Hamlet - a
complex from human milk that induces apoptosis in
tumor cells but spares healthy cells. Adv Exp Med Biol
503, 125–132.
34 Svensson M, Mossberg AK, Pettersson J, Linse S &
Svanborg C (2003) Lipids as cofactors in protein fold-
ing: stereo-specific lipid–protein interactions are
required to form HAMLET (human alpha-lactalbumin
made lethal to tumor cells). Protein Sci 12, 2805–2814.
35 Permyakov SE, Pershikova IV, Zhadan AP, Goers J,
Bakunts AG, Uversky VN, Berliner LJ & Permyakov
EA (2005) Conversion of human alpha-lactalbumin to
an apo-like state in the complexes with basic poly-
amino acids: toward understanding of the molecular
mechanism of antitumor action of HAMLET. J Prote-
ome Res 4, 564–569.
36 Duringer C, Hamiche A, Gustafsson L, Kimura H &
Svanborg C (2003) HAMLET interacts with histones
and chromatin in tumor cell nuclei. J Biol Chem 278,
42131–42135.
37 Yang F Jr, Zhang M, Zhou BR, Chen J & Liang Y
(2006) Oleic acid inhibits amyloid formation of the
intermediate of alpha-lactalbumin at moderately acidic
pH. J Mol Biol 362, 821–834.
38 Stuart DI, Acharya KR, Walker NP, Smith SG, Lewis
M & Phillips DC (1986) Alpha-lactalbumin possesses a
novel calcium binding loop. Nature 324, 84–87.
39 Morozova L, Haezebrouck P & Van Cauwelaert F
(1991) Stability of equine lysozyme I. Thermal unfold-
ing behaviour. Biophys Chem 41, 185–191.
40 Griko YV, Freire E, Privalov G, van Dael H & Priva-
lov PL (1995) The unfolding thermodynamics of c-type
lysozymes: a calorimetric study of the heat denaturation
of equine lysozyme. J Mol Biol 252 , 447–459.
41 Chowdhury FA, Fairman R, Bi Y, Rigotti DJ &
Raleigh DP (2004) Protein dissection experiments reveal
key differences in the equilibrium folding of alpha-lact-
albumin and the calcium binding lysozymes. Biochemis-
try 43
, 9961–9967.
42 Malisauskas M, Ostman J, Darinskas A, Zamotin V,
Liutkevicius E, Lundgren E & Morozova-Roche LA
(2005) Does the cytotoxic effect of transient amyloid
oligomers from common equine lysozyme in vitro
imply innate amyloid toxicity? J Biol Chem 280, 6269–
6275.
43 Permyakov SE, Khokhlova TI, Nazipova AA, Zhadan
AP, Morozova-Roche LA & Permyakov EA (2006)
Calcium-binding and temperature induced transitions in
equine lysozyme: new insights from the pCa-tempera-
ture ‘phase diagrams’. Proteins 65, 984–998.
44 Morozova-Roche LA (2007) Equine lysozyme: the
molecular basis of folding, self-assembly and innate
amyloid toxicity. FEBS Lett 581, 2587–2592.
45 Mizuguchi M, Arai M, Ke Y, Nitta K & Kuwajima K
(1998) Equilibrium and kinetics of the folding of equine
lysozyme studied by circular dichroism spectroscopy.
J Mol Biol 283, 265–277.
46 Morozova-Roche LA, Jones JA, Noppe W & Dobson
CM (1999) Independent nucleation and heterogeneous
assembly of structure during folding of equine lyso-
zyme. J Mol Biol 289, 1055–1073.
47 Malisauskas M, Zamotin V, Jass J, Noppe W, Dobson
CM & Morozova-Roche LA (2003) Amyloid protofila-
ments from the calcium-binding protein equine lyso-
zyme: formation of ring and linear structures depends
on pH and metal ion concentration. J Mol Biol 330,
879–890.
48 Malisauskas M, Darinskas A, Zamotin VV, Gharibyan
A, Kostanyan IA & Morozova-Roche LA (2006) Inter-
mediate amyloid oligomers of lysozyme: is their cyto-
Protein oligomerization induced by oleic acid K. Wilhelm et al.
3988 FEBS Journal 276 (2009) 3975–3989 ª 2009 The Authors Journal compilation ª 2009 FEBS
toxicity a particular case or general rule for amyloid?
Biochemistry (Mosc) 71, 505–512.
49 Renvoize C, Biola A, Pallardy M & Breard J (1998)
Apoptosis: identification of dying cells. Cell Biol Toxicol
14, 111–120.
50 Vukojevic
´
V, Heidkamp M, Ming Y, Johansson B,
Terenius L & Rigler R (2008) Quantitative single-mole-
cule imaging by confocal laser scanning microscopy.
Proc Natl Acad Sci USA 105, 18176–18181.
51 Ishiguro R, Yokoyama Y, Maeda H, Shimamura A,
Kameyama K & Hiramatsu K (2005) Modes of confor-
mational changes of proteins adsorbed on a planar
hydrophobic polymer surface reflecting their adsorption
behaviors. J Colloid Interface Sci 290, 91–101.
52 Sethuraman A & Belfort G (2005) Protein structural
perturbation and aggregation on homogeneous surfaces.
Biophys J 88, 1322–1333.
53 Sethuraman A, Vedantham G, Imoto T, Przybycien T
& Belfort G (2004) Protein unfolding at interfaces: slow
dynamics of alpha-helix to beta-sheet transition. Pro-
teins 56, 669–678.
54 Goers J, Permyakov SE, Permyakov EA, Uversky VN
& Fink AL (2002) Conformational prerequisites for
alpha-lactalbumin fibrillation. Biochemistry 41, 12546–
12551.
55 Wahlstrom A, Hugonin L, Peralvarez-Marin A, Jarvet
J & Graslund A (2008) Secondary structure conversions
of Alzheimer’s Abeta(1-40) peptide induced by mem-
brane-mimicking detergents. FEBS J 275, 5117–5128.
56 Fast J, Mossberg AK, Svanborg C & Linse S (2005)
Stability of HAMLET - a kinetically trapped alpha-
lactalbumin oleic acid complex. Protein Sci 14, 329–
340.
57 Pettersson-Kastberg J, Aits S, Gustafsson L, Mossberg
A, Storm P, Trulsson M, Persson F, Hun Mok K &
Svanborg C (2009) Can misfolded proteins be benefi-
cial? The HAMLET case Annals Med 41, 162–176.
58 Cheon M, Chang I, Mohanty S, Luheshi LM, Dobson
CM, Vendruscolo M & Favrin G (2007) Structural
reorganisation and potential toxicity of oligomeric
species formed during the assembly of amyloid fibrils.
PLoS Comput Biol 3, 1727–1738.
59 Zhu Y, Schwarz S, Ahlemeyer B, Grzeschik S, Klumpp
S & Krieglstein J (2005) Oleic acid causes apoptosis and
dephosphorylates Bad. Neurochem Int 46, 127–135.
60 Fernanda Cury-Boaventura M, Cristine Kanunfre C,
Gorjao R, Martins de Lima T & Curi R (2006) Mecha-
nisms involved in Jurkat cell death induced by oleic and
linoleic acids. Clin Nutr 25, 1004–1014.
61 De Gottardi A, Vinciguerra M, Sgroi A, Moukil M,
Ravier-Dall’Antonia F, Pazienza V, Pugnale P, Foti M
& Hadengue A (2007) Microarray analyses and molecu-
lar profiling of steatosis induction in immortalized
human hepatocytes. Lab Invest 87, 792–806.
62 Gill CI, Boyd A, McDermott E, McCann M, Servili M,
Selvaggini R, Taticchi A, Esposto S, Montedoro G,
McGlynn H et al. (2005) Potential anti-cancer effects of
virgin olive oil phenols on colorectal carcinogenesis
models in vitro. Int J Cancer 117, 1–7.
63 Noppe W, Haezebrouck P, Hanssens I & De Cuyper M
(1999) A simplified purification procedure of alpha-lact-
albumin from milk using Ca(2+)-dependent adsorption
in hydrophobic expanded bed chromatography. Biosep-
aration 8, 153–158.
64 LeVine H III (1993) Thioflavine T interaction with syn-
thetic Alzheimer’s disease beta-amyloid peptides: detec-
tion of amyloid aggregation in solution. Protein Sci 2,
404–410.
65 Wu D, Chen A & Johnson CS (1995) An improved dif-
fusion-ordered spectroscopy experiment incorporating
bipolar-gradient pulses. J Magn Reson Ser A
115, 260–
264.
66 Christodoulou J, Larsson G, Fucini P, Connell SR,
Pertinhez TA, Hanson CL, Redfield C, Nierhaus KH,
Robinson CV, Schleucher J et al. (2004) Heteronuclear
NMR investigations of dynamic regions of intact
Escherichia coli ribosomes. Proc Natl Acad Sci USA
101, 10949–10954.
67 Tsuge H, Ago H, Noma M, Nitta K, Sugai S & Miy-
ano M (1992) Crystallographic studies of a calcium
binding lysozyme from equine milk at 2.5 A
˚
resolution.
J Biochem 111, 141–143.
Supporting information
The following supplementary material is available:
Fig. S1. Effect of ELOA on cell viability.
Doc. S1. WST-1 (water soluble tetrazolium) assay.
This supplementary material can be found in the
online article.
Please note: As a service to our authors and readers,
this journal provides supporting information supplied
by the authors. Such materials are peer-reviewed and
may be re-organized for online delivery, but are not
copy-edited or typeset. Technical support issues arising
from supporting information (other than missing files)
should be addressed to the authors.
K. Wilhelm et al. Protein oligomerization induced by oleic acid
FEBS Journal 276 (2009) 3975–3989 ª 2009 The Authors Journal compilation ª 2009 FEBS 3989