Báo cáo khoa học: Pfkfb3 is transcriptionally upregulated in diabetic mouse liver through proliferative signals docx
Bạn đang xem bản rút gọn của tài liệu. Xem và tải ngay bản đầy đủ của tài liệu tại đây (517.19 KB, 14 trang )
Pfkfb3 is transcriptionally upregulated in diabetic mouse
liver through proliferative signals
Joan Duran
1,
*, Merce
`
Obach
1,
*, Aurea Navarro-Sabate
1
, Anna Manzano
1
, Marta Go
´
mez
1
,
Jose L. Rosa
1
, Francesc Ventura
1
, Jose C. Perales
2
and Ramon Bartrons
1
1 Unitat Bioquı
´
mica i Biologia Molecular, Universitat de Barcelona, Spain
2 Unitat de Biofı
´
sica, Departament de Cie
`
ncies Fisiolo
`
giques, IDIBELL, Universitat de Barcelona, Spain
Introduction
Diabetes is a common metabolic disorder in humans,
associated with significant morbidity and mortality. In
this pathological situation, the liver, one of the major
targets of insulin action, develops biochemical and
functional abnormalities, which include alterations in
carbohydrate, lipid and protein metabolism and
changes in antioxidant status [1]. Insulin-dependent
diabetes mellitus is currently modelled by the injection
of streptozotocin (STZ) in rodents, which degenerates
pancreatic insulin-producing b-cells [2]. This model is
characterized by decreased plasma insulin levels, severe
hyperglycaemia and alterations in insulin-dependent
signal transduction [3]. STZ-induced diabetes in rats is
also associated with hepatomegaly as a result of the
Keywords
6-phosophofructo-2-kinase ⁄ fructose-2,6-
bisphosphatase; diabetes; fructose-2,6-
bisphosphate; liver; streptozotocin
Correspondence
R. Bartrons, Unitat Bioquı
´
mica i Biologia
Molecular, Universitat de Barcelona, Feixa
Llarga s ⁄ n, E-08907 L’Hospitalet, Barcelona,
Spain
Fax: 34934024268
Tel: 34934024252
E-mail:
*These authors contributed equally to this
work
(Received 3 April 2009, revised 12 June
2009, accepted 17 June 2009)
doi:10.1111/j.1742-4658.2009.07161.x
The ubiquitous isoform of 6-phosphofructo-2-kinase ⁄ fructose-2,6-bisphos-
phatase (uPFK-2), a product of the Pfkfb3 gene, plays a crucial role in the
control of glycolytic flux. In this study, we demonstrate that Pfkfb3 gene
expression is increased in streptozotocin-induced diabetic mouse liver. The
Pfkfb3 ⁄ -3566 promoter construct linked to the luciferase reporter gene was
delivered to the liver via hydrodynamic gene transfer. This promoter was
upregulated in streptozotocin-induced diabetic mouse liver compared with
transfected healthy cohorts. In addition, increases were observed in Pfkfb3
mRNA and uPFK-2 protein levels, and intrahepatic fructose-2,6-bisphos-
phate concentration. During streptozotocin-induced diabetes, phosphoryla-
tion of both p38 mitogen-activated protein kinase and Akt was detected,
together with the overexpression of the proliferative markers cyclin D and
E2F. These findings indicate that uPFK-2 induction is coupled to enhanced
hepatocyte proliferation in streptozotocin-induced diabetic mouse liver.
Expression decreased when hepatocytes were treated with either rapamycin
or LY 294002. This shows that uPFK-2 regulation is phosphoinositide
3-kinase–Akt–mammalian target of rapamycin dependent. These results
indicate that fructose-2,6-bisphosphate is essential to the maintenance
of the glycolytic flux necessary for providing energy and biosynthetic
precursors to dividing cells.
Abbreviations
C ⁄ EBP, CCAAT ⁄ enhancer-binding protein; CDK, cyclin-dependent kinase; EGF, epidermal growth factor; EMSA, electrophoresis mobility
shift assay; ERK, extracellular signal-regulated kinase; Fru-2,6-P
2
, fructose-2,6-bisphosphate; GFP, green fluorescent protein; iNOS, inducible
nitric oxide synthase; LAP, liver activation protein; LPS, lipopolysaccharide; mTOR, mammalian target of rapamycin; mTORC 1 ⁄ 2, mTOR
complex 1 ⁄ 2; NF jB, nuclear factor kappa-light-chain-enhancer of activated B cells; PCNA, proliferating cell nuclear antigen; PEPCK,
phosphoenolpyruvate carboxykinase; PFK-2, 6-phosphofructo-2-kinase ⁄ fructose-2,6-bisphosphatase (EC 2.7.1.105 ⁄ EC 3.1.3.46); PI3K,
phosphoinositide 3-kinase; Rb, retinoblastoma; ROS, reactive oxygen species; STZ, streptozotocin; TBARS, thiobarbituric acid reactive
substances; uPFK-2, ubiquitous PFK-2.
FEBS Journal 276 (2009) 4555–4568 ª 2009 The Authors Journal compilation ª 2009 FEBS 4555
high cell proliferation rates and decreased apoptosis
[1,3,4]. In addition, the mechanisms that regulate cell
division are upregulated in STZ-induced diabetic mice.
This observation is consistent with the robust repair of
tissue damage caused by hepatotoxicants observed in
diabetic mouse liver [4]. On days 5 and 10 after STZ
treatment, significantly higher numbers of G2 cells
were found in diabetic liver compared with controls
[3,4].
Cell proliferation and tumour growth are supported
by high glycolytic flux. This is mainly controlled by
6-phosphofructo-1-kinase, which is potently activated
by the regulatory metabolite fructose-2,6-bisphosphate
(Fru-2,6-P
2
) [5,6]. 6-Phosphofructo-2-kinase ⁄ fructose-
2,6-bisphosphatase (PFK-2) is a homodimeric enzyme
that catalyses the synthesis and degradation of Fru-
2,6-P
2
[6–9]. Since the discovery of this system in the
liver, other mammalian isozymes have been identified
with a range of expression profiles and kinetic
responses to allosteric effectors, hormonal and growth
factor signals [7–10]. These isozymes are generated by
alternative splicing from four independent genes, desig-
nated Pfkfb1–4 [11]. The Pfkfb3 gene encodes a ubiq-
uitous PFK-2 (uPFK-2) isozyme [12], which is induced
by progesterone [13], inflammatory stimuli [14] and
hypoxia [15,16], and is degraded through the ubiqu-
itin–proteasome proteolytic pathway [17]. The Pfkfb3
gene product has the highest kinase to bisphosphatase
activity ratio and thus maintains elevated Fru-2,6-P
2
levels, which, in turn, sustain high glycolytic rates in
the cell [18]. This gene has been implicated in cell pro-
liferation as it is ubiquitously expressed in proliferating
tissues, transformed cell lines and in various tumours
[13,14,19–22]. Recently, in order to determine the
effects of uPFK-2 overexpression in mouse liver and to
examine its involvement in metabolic disturbances, we
designed a transgenic mouse model that overexpresses
Pfkfb3. These transgenic animals sustained high Fru-
2,6-P
2
levels in the liver and increased weight gain [23].
In the liver of STZ-induced diabetic rats, the levels
of Fru-2,6-P
2
and 6-phosphofructo-2-kinase activity
decreased and the phosphorylation of the bifunctional
enzyme increased, correlating with a fall in hepatic
Fru-2,6-P
2
, ketonaemia and glycaemia [24–26]. Similar
results have been reported in diabetic mouse liver,
underscoring the role played by Fru-2,6-P
2
in the con-
trol of fuel metabolism [27]. In the present study, we
demonstrate that Pfkfb3 gene expression increases pro-
gressively in STZ-induced diabetic mouse liver, leading
to progressive and partial recovery of Fru-2,6-P
2
levels,
and implicating this gene in liver metabolism. In addi-
tion, we developed an in vivo promoter assay method
based on a hydrodynamic gene delivery technique in
order to determine whether the increased Pfkfb3
expression in diabetic liver was a result of transcrip-
tional upregulation via promoter activation. The rela-
tionship between hepatocyte proliferation and Pfkfb3
gene induction in STZ-induced diabetic mouse liver
was also studied. Our results strongly support the
hypothesis that this gene is transcriptionally upregulat-
ed through cell proliferation pathways, involving Akt
phosphorylation and cyclin D and E2F transcription
factor transactivation in the liver.
Results
Pfkfb3 gene expression and Fru-2,6-P
2
concentra-
tion in STZ-induced diabetic mouse liver
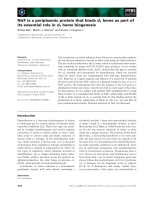
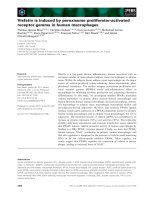
Fifteen days after STZ injection, C57 ⁄ BL6 mice
showed significantly higher plasma glucose levels
(257.4 ± 29.2 versus 61.3 ± 8.9 mgÆdL
)1
in noninject-
ed controls) and almost nondetectable plasma insulin
levels (< 0.15 lgÆL
)1
) after 16 h of starvation (Fig. 1).
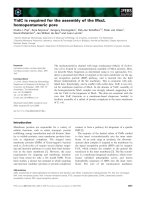
In these conditions, we analysed Pfkfb3 mRNA
expression and protein levels. As shown in Fig. 2A,
Pfkfb3 mRNA expression increased significantly
between day 8 and day 15 after STZ injection to a
peak on day 15. UPFK-2 protein expression also rose
progressively during the time course of the experiment
(Fig. 2B). To assess the functionality of the overex-
pressed uPFK-2 isozyme, we next analysed the Fru-
2,6-P
2
concentration in liver. The concentration of
hepatic Fru-2,6-P
2
decreased after fasting, recovering
slowly in STZ diabetes, and reaching 30% of fed
values on day 15 after injection (Fig. 2C).
In order to assess the overall contribution of uPFK-
2 compared with the other isozymes, we also measured
the mRNA and protein levels of the other isozymes at
day 0 and 15 of STZ-induced diabetes. Significant vari-
ation in the levels of uPFK-2 expression and protein
0
100
200
300
400
500
600
700
0 2 4 6 8 10 15
Days after STZ
Fed
Fasted
> 600 mg·dL
–1
Glycaemia (mg·dL
–1
)
Fig. 1. Blood glucose levels during the STZ-induced diabetes time
course in fed and fasting conditions (n = 10 animals per group).
Pfkfb3 upregulation in STZ-induced diabetic mouse liver J. Duran et al.
4556 FEBS Journal 276 (2009) 4555–4568 ª 2009 The Authors Journal compilation ª 2009 FEBS
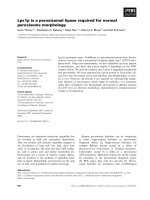
were found after STZ treatment (Fig. 3A,B). The
mRNA expression of the other isozymes either did
not change significantly (PFKFB1) or decreased
(PFKFB4). In addition, we measured the ‘total’ and
‘active’ PFK-2 activities. In the conditions of the
assay, the ‘total’ and ‘active’ forms correspond to the
V
max
activity and to the activity of the nonphosphory-
lated form of the enzyme, respectively [28,29]. Both the
‘total’ and ‘active’ forms increased after STZ treatment
(Fig. 4). Compared with the ‘total’ activity, the ‘active’
form was low in the liver of starved animals (day 0),
suggesting that the enzyme present is inhibited by
phosphorylation (PFKFB1). In contrast, the activity of
the ‘active’ form on day 15 increased, in spite of
the fact that the animals were starved and diabetic,
suggesting an isoenzymatic change.
0
2
4
6
8
10
12
14
Day 0 Day 2 Day 4 Day 6 Day 8 Day 10 Day 15
**
**
**
Pfkfb3 expression (fold change)
0
0.4
0.8
1.2
1.6
2.0
2.4
2.8
Liver Fru-2,6-P
2
(nmol·g
–1
)
5.6
6.0
Fed
**
**
**
*
*
Days after
STZ
0 6 8 0 10 150
2
4
uPFK-2
Loading control
Day 0 Day 2 Day 4 Day 6 Day 8 Day 10 Day 15
A
B
C
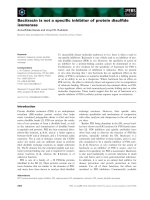
Fig. 2. Pfkfb3 gene expression analysis in livers from STZ-induced
diabetic mice. (A) Quantitative real-time PCR analysis of Pfkfb3
expression was performed using RNA extracts from mouse livers
0, 2, 4, 6, 8, 10 and 15 days after STZ injection (n = 10 animals per
group). The data represent the fold change versus the lowest day 0
value, and are normalized to 18S cDNA. Statistically significant dif-
ferences (**P < 0.01) in diabetic mouse livers at 8, 10 and 15 days
after STZ injection were observed compared with controls (day 0).
(B) Western blot against uPFK-2 was performed with 50 lg of total
cell extract from the same animals. Protein was used as loading
control. (C) Liver Fru-2,6-P
2
values in fasted control (day 0) and 2,
4, 6, 8, 10 and 15-days after STZ injection. All points and bars rep-
resent the mean ± standard error of the mean (SEM) of the data
obtained (n = 10 animals per group). Statistically significant differ-
ences (*P < 0.05; **P < 0.01) were found on 2, 6, 8, 10 and
15 days after STZ versus control (day 0). Fed control value (in grey)
is indicated as a reference.
CT
A
B
STZ
uPFK-2 (PFKFB3)
(day = 15)
LPFK-2 (PFKFB1)
tPFK-2 (PFKFB4)
Loading control
1.5
0
0.5
1
Pfkfb1 expression
(fold change)
Pfkfb3 expression
(fold change)
Pfkfb4 expression
(fold change)
10
**
0
2
4
6
8
1.5
CT STZ
0
0.5
1
**
(Day = 15)
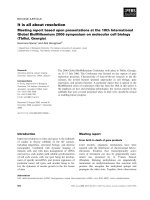
Fig. 3. Expression of the PFKFB isozymes in livers from STZ-
induced diabetic mice. Western blot against LPFK-2, uPFK-2 and
tPFK-2 (A) and quantitative real-time PCR using specific primers for
Pfkfb1, Pfkfb3 and Pfkfb4 genes (B). For western blot, 50 lgof
total liver extracts were used. Diabetic mice in the fasting condition
(16 h) and 15 days after STZ injection were compared with con-
trols. Protein was used as loading control. For Pfkfb3 mRNA quanti-
tative analysis, total liver RNA from control (day 0) and STZ-induced
diabetic (day 15) mice was used. The data represent the fold
change versus the lowest day 0 value and were normalized to 18S
cDNA. All graph points and bars represent the mean ± standard
error of the mean (SEM) of the data obtained. Statistically signifi-
cant increases (**P < 0.01) in diabetic mouse livers compared with
controls were observed for Pfkfb3 gene determination.
J. Duran et al. Pfkfb3 upregulation in STZ-induced diabetic mouse liver
FEBS Journal 276 (2009) 4555–4568 ª 2009 The Authors Journal compilation ª 2009 FEBS 4557
To identify possible liver damage caused by STZ
treatment, we measured plasma transaminase levels.
Alanine aminotransferase activities increased slightly
only during the first 5 days (37.8 ± 9.1 UÆL
)1
on the
fifth day versus 23.3 ± 5.6 UÆL
)1
in controls), return-
ing to control values afterwards.
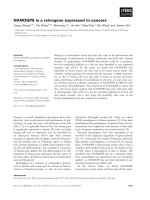
uPFK-2 immunohistochemical analysis in the liver
uPFK-2 isozyme was overexpressed in the hepatic
parenchyma of diabetic mice (Fig. 5A). The expression
of proliferating cell nuclear antigen (PCNA) was also
increased at day 15 (Fig. 5B). Detailed observation of
uPFK-2-positive cell distribution revealed a clustering
formation of these hepatocytes (Fig. 5A,C), in accor-
dance with a previous report of a PCNA expression
pattern in mice liver 5 and 10 days after STZ injection
[4]. Next, hydrodynamic transfection of the green fluo-
rescent protein (GFP) expression vector was performed
to distinguish between perivenous and periportal
hepatocytes [30]. UPFK-2-overexpressing hepatocytes
were predominantly located in the perivenous zone [31]
of the liver (Fig. 5C, merged).
Mouse liver transfection of Pfkfb3/-3566
promoter construct during STZ-induced diabetes
development
To elucidate whether increased Pfkfb3 expression was
caused by its transcriptional upregulation via promoter
activation, we developed an in vivo promoter assay
method based on the hydrodynamic gene delivery tech-
nique. Hydrodynamic gene transfer is an efficient sys-
tem that allows the DNA to distribute mainly to the
liver [30]. The Pfkfb3 ⁄ -3566 promoter construct (con-
0
2
4
6
8
10
12
14
16
18
20
Da
y
0 Da
y
15
PFK-2 activity (µU·(mg protein)
–1
)
PFK-2 activity (µU·(mg protein)
–1
)
* *
Total PFK-2 Act
i
v
i
ty Act
i
ve PFK-2 Act
i
v
i
ty
0
1
2
3
4
5
6
7
8
*
Da
y
0 Da
y
15
Fig. 4. Hepatic PFK-2 activity. Liver ‘total’ and ‘active’ PFK-2 activi-
ties in fasted control (day 0) and at day 15 after STZ-induced diabe-
tes. All graph points and bars represent the mean ± standard error
of the mean (SEM) of the data obtained (n = 10 animals per group).
Statistically significant differences (*P < 0.05; **P < 0.01) were
found in diabetic animals versus controls (day 0).
Control liver
A
B
C
D
Diabetic liver
(day 15 after STZ injection)
uPFK-2
uPFK-2 GFP
Merged
PCNA
Control STZ (day 15)
Loading control
14
**
4
6
8
10
12
*
*
Pfkfb3 promoter-luciferase activity
(fold induction)
0
2
Day 0 Day15 Day 10 Day 8 Day 6 Day 4 Day 2
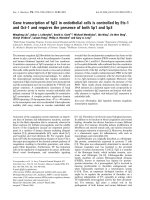
Fig. 5. UPFK-2 immunostaining and hydrodynamic transfection
analysis of Pfkfb3 ⁄ -3566 promoter construct. (A) uPFK-2 immuno-
staining in control and diabetic mouse livers. Fixed liver samples
included in OCT were cut and prepared for immunohistochemistry
procedures. Immunostaining was performed by indirect immunoflu-
orescence using uPFK-2 (1 : 10) primary antibody, followed by an
rabbit IgG secondary antibody conjugated to Alexa-Fluor 568. Omis-
sion of primary antibody was used as a negative control. (B) For
western blot against PCNA, 50 lg of total liver extract were used
and protein was employed as a loading control. (C) Animals (n =10
for each condition) were cotransfected, using hydrodynamic gene
delivery, with Pfkfb3 ⁄ -3566 promoter construct, and GFP expres-
sion vector was injected through the mouse tail vein in a volume of
10% of the body weight. The liver transfection efficiency was
assessed using the percentage of hepatocytes expressing GFP.
Clusters of hepatocytes overexpressing uPFK-2 colocalize with GFP
in perivenous cells. (D) Hydrodynamic transfection analysis of
Pfkfb3 ⁄ -3566 promoter construct at baseline (day 0) and 2, 4, 6, 8,
10 and 15 days after STZ injection. Statistically significant differ-
ences in luciferase activity were observed in livers from mice on
days 4, 10 (*P < 0.05) and 15 (**P < 0.01) after STZ injection com-
pared with controls.
Pfkfb3 upregulation in STZ-induced diabetic mouse liver J. Duran et al.
4558 FEBS Journal 276 (2009) 4555–4568 ª 2009 The Authors Journal compilation ª 2009 FEBS
taining a 3566-nucleotide fragment of the Pfkfb3 pro-
moter) linked to the luciferase reporter gene was deliv-
ered into mouse liver during diabetes development. As
indicated by the cotransfection of Pfkfb3 ⁄ -3566 and
GFP constructs (Fig. 5C), approximately 20–40% of
the liver cells were transfected. Moreover, no signifi-
cant differences were found in alanine aminotransfer-
ase levels 24 h after transfection between animal
groups (Pfkfb3 ⁄ -3566 + GFP; GFP). Alanine amino-
transferase levels were in the range of those receiving
saline (data not shown), indicating that the liver was
not affected after transfection treatment. Transient
in vivo transfection of the Pfkfb3 ⁄ -3566 promoter
construct demonstrated significant luciferase activity on
day 4 (around four-fold), and large increases (8–12-fold)
on days 10 and 15 after STZ injection, in comparison
with basal values (Fig. 5D).
Involvement of pro-inflammatory signals and
oxidative stress in Pfkfb3 expression in diabetic
liver
Nuclear factor kappa-light-chain-enhancer of activated
B cells (NF-jB) has been found to be expressed in
liver epithelium, where it regulates hepatic cell prolifer-
ation and survival during regeneration and develop-
ment [32]. Furthermore, we have previously described
various NF-jB consensus sequences in the Pfkfb3 gene
promoter [16]. In the light of these data, we examined
whether NF-jB might be responsible for Pfkfb3 activa-
tion in our diabetic model. The presence of NF-jBin
liver nuclear extracts from days 0, 4, 8 and 15 after
STZ injection was studied by electrophoresis mobility
shift assay (EMSA). No changes in phosphorylated
NF-jB oligonucleotide interactions were found
between the various time course samples (Fig. 6A). In
addition, in order to rule out NF-jB involvement in
Pfkfb3 upregulation, we used RAW wild-type and
RAW IjBa dominant active (IjB aDA) cells [33]. In
RAW wild-type cells, inducible nitric oxide synthase
(iNOS) expression increased gradually 8, 16 and 24 h
after lipopolysaccharide (LPS) treatment; at the same
time, NF-jB was induced. Moreover, no expression of
this pro-inflammatory marker was detected in RAW
IjB aDA cells after LPS treatment. In these condi-
tions, small changes in uPFK-2 protein levels were
found in the presence or absence of LPS in both cell
lines (Fig. 6B). Furthermore, no iNOS expression was
detected in any liver sample from any day of the study
(data not shown). The steady-state levels of lipoperoxi-
dation product (thiobarbituric acid reactive substances,
TBARS) concentration and catalase activity were
determined to rule out the involvement of oxidative
stress in our STZ diabetic model. No significant differ-
ences were found between post-STZ injection liver
samples (results not shown).
Cell growth and proliferation in STZ-induced
diabetic mouse liver
Several reports have described a significantly larger
number of G2 cells in STZ-induced diabetic mouse
liver than in nondiabetic cohorts [4]. Moreover, Pfkfb3
gene expression has also been found to be increased in
proliferating cells [22,34]. We studied various cell
growth and proliferation markers in order to find a
plausible explanation for uPFK-2 overexpression in
STZ-induced diabetic mouse liver. The hepatocyte pro-
liferation observed in response to growth and auto-
crine factors is attempted, at least in part, via the
activation of the phosphoinositide 3-kinase (PI3K)
pathway and its downstream signal transduction effec-
tors [35–38]. In addition, the predominant role of
PI3K and the mammalian target of rapamycin
(mTOR) in DNA replication and cyclin D activation
has been reported [35,36]. To evaluate the involvement
of this pathway in our STZ-induced diabetic model,
phosphorylation of Akt on Ser473 (P-Akt Ser473) [39]
and cyclin D expression were studied. Moreover, it has
been speculated that, in type I diabetes mellitus, p38
Days after
STZ
c+
0
48 15
Hours after
LPS treatment
8816 1624 240
iNOS
uPFK-2
RAW mock
RAW
DA
Loading control
A
B
Fig. 6. Oxidative stress analysis. (A) Fresh liver nuclear extracts from
days 0, 4, 8 and 15 after STZ injection were tested for the presence
of NF-jB transcription factor by EMSA. A
32
P-labelled oligonucleotide
containing the NF-jB consensus binding site was used as probe.
A nuclear cell extract from SH-SY-5Y cells was used as positive
control (c+). (B) Western blot of RAW WT and RAW IjB aDA cells
treated with LPS (1 lgÆmL
)1
) for 0, 8, 16 and 24 h. Fifty micrograms
of total cell extracts were blotted using antibodies against iNOS (as
positive control) and uPFK-2 enzymes. Protein was used as a loading
control.
J. Duran et al. Pfkfb3 upregulation in STZ-induced diabetic mouse liver
FEBS Journal 276 (2009) 4555–4568 ª 2009 The Authors Journal compilation ª 2009 FEBS 4559
mitogen-activated protein kinase, a sensor of oxidative
stress, may also control Akt phosphorylation [40].
Therefore, in our model, we also analysed the phos-
phorylation of p38 (P-p38). Another well-known fam-
ily of transcription factors involved in hepatocyte
dedifferentiation and proliferation is the CCAAT⁄ en-
hancer-binding protein (C ⁄ EBP). We studied the
C ⁄ EBPb liver activation protein (LAP), involved in
hepatocyte proliferation, and C ⁄ EBPa, involved in cell
cycle arrest [41,42]. C ⁄ EBPa is necessary for hepatic
growth inhibition, but this activity can be blocked in
liver tumours by the PI3K ⁄ Akt signal transduct ion
pathway. This pathway dephosphorylates C ⁄ EBPa on
Ser193, activating cell growth and proliferation
through sequestering retinoblastoma (Rb) protein, and
leading to a reduction in Rb-E2F blocking complexes
[38]. In addition, E2F r elease can also be caused by cyclin
D activity. In the light of these data, the presence of
C ⁄ EBPb (LAP), C ⁄ EBPa and E2F was investigated.
Western blot analysis of STZ-induced diabetic
mouse liver revealed phosphorylation of Akt at Ser473
between days 4 and 15 (Fig. 7A). However, phosphor-
ylation of p38 mitogen-activated protein kinase was
only detected on day 4. In addition, the results
obtained for C ⁄ EBPb protein levels agree with those
reported for hepatocyte proliferation, as the LAP iso-
form was overexpressed on day 15 after STZ adminis-
tration (Fig. 7B). However, C ⁄ EBPa expression was
barely detected at day 15 after STZ injection. Cyclin D
and E2F1, two final effectors of these proliferative
pathways, were increased from day 4, correlating posi-
tively with the uPFK-2 upregulation pattern during
the time course presented above.
Inhibition of PI3K ⁄ mTOR pathway reduces
uPFK-2 expression in proliferating rat primary
hepatocytes
Rat primary hepatocytes coated on a collagen mono-
layer exhibit rapid proliferation and dedifferentiation,
progressing in G1 independent of growth factor stimula-
tion up to the restriction point located in the mid–late
G1 phase. After mitogenic stimulation, hepatocytes
progress in late G1 and undergo DNA synthesis [36].
A complex network of different signalling cascades,
including the PI3K, extracellular signal-regulated kinase
(ERK) and p38 pathways [43] participate in the regula-
tion of hepatocyte proliferation and survival. With
regard to the signalling pathways that control the tran-
scription of the Pfkfb3 gene, freshly isolated hepato-
cytes, cultured with 10% fetal bovine serum medium in
order to promote cell proliferation, were treated
with various inhibitors, and several signal cascade
intermediates were studied. LY 294002, a PI3K inhibi-
tor, and rapamycin, a specific mTOR inhibitor, were
both able to reduce uPFK-2 levels by approximately
20% compared with the serum-activated control condi-
tion, whereas treatments with specific inhibitors of ERK
and p38 pathways did not affect uPFK-2 expression
(Fig. 8A,B).
An additional experiment was performed to test the
hypothesis that the Pfkfb3 gene is modulated by the
PI3K pathway in proliferating liver cells. Epidermal
growth factor (EGF)-stimulated and nonstimulated
primary hepatocytes were treated with the PI3K inhibi-
tor LY 294002. EGF promotes cell cycle progression
and DNA synthesis in hepatocyte cultures [35] through
an LY 294000-sensitive pathway. The results in
Fig. 8C show that uPFK-2 protein was decreased by
blocking PI3K activity in both the EGF-stimulated
and nonstimulated hepatocytes 48 h after seeding.
Cyclin D levels were also reduced in the presence of
LY 294002, confirming the link between uPFK-2
expression and hepatocyte proliferative status. Quanti-
tative real-time PCR performed in EGF-stimulated
conditions showed a significant reduction in Pfkfb3
mRNA levels when hepatocytes were treated with LY
294002 (Fig. 8D).
Discussion
Even with insulin treatment, diabetic patients show
disturbances in tissue growth, and these have been
linked to chronic hyperglycaemia and subsequent met-
abolic alterations [3]. In type I diabetes, the liver,
which maintains blood glucose homeostasis, contrib-
utes to hyperglycaemia. STZ-induced diabetic rats
show hepatocyte proliferation, decreased apoptosis and
hypertrophy in the liver [3]. Moreover, Shankar et al.
[4] have demonstrated that diabetic mice exhibit milder
liver injury after exposure to lethal doses of hepatotox-
icants, suggesting a robust compensatory tissue repair
in this experimental situation. These results suggest
that liver damage is repaired as a result of hepatic cell
proliferation. However, in a previous study, Rosa et al.
[44] reported an increase in Fru-2,6-P
2
content during
the replicative period of liver regeneration, correlating
with transcriptional activation and PFK-2 mRNA
accumulation. They suggested that PFK-2 was regu-
lated in response to hepatic insult. Recently, we have
demonstrated the upregulation of the Pfkfb3 gene and
the uPFK-2 isozyme in hepatic cell growth and prolif-
eration [22]. Bearing in mind that the Pfkfb3 gene is
extensively involved in cell proliferation events as a
result of its key role in carbohydrate metabolism
[16,19,21,22,34,45,46], we analysed its physiological
Pfkfb3 upregulation in STZ-induced diabetic mouse liver J. Duran et al.
4560 FEBS Journal 276 (2009) 4555–4568 ª 2009 The Authors Journal compilation ª 2009 FEBS
role in liver dysfunction described in diabetes induced
by STZ.
The detailed diabetes induction time course pre-
sented here showed both a gradual increase in uPFK-2
protein and Pfkfb3 mRNA after STZ injection, accom-
panied by a progressive transcriptional upregulation of
this gene. These increases correlate with the partial
recovery of Fru-2,6-P
2
concentration observed in
fasted diabetic liver. The contribution of the ubiqui-
tous PFK-2 isozyme to Fru-2,6-P
2
synthesis in the dia-
betic liver is greater than that of other isozymes, as the
mRNA and protein levels of the liver isozyme
(PFKFB1) do not change and the testis isoform
(PFKFB4) decreases after STZ. Moreover, the hepatic
activities measured suggest that the enzyme present at
day 0 is inhibited by phosphorylation. In contrast, the
activity on day 15 increased, in spite of the fact that
the animals were starved and diabetic, suggesting an
isoenzymatic change. Taken together, these results
demonstrate that the Pfkfb3 gene and uPFK-2 protein
are induced in STZ diabetic mouse liver, and are
mainly responsible for the changes in Fru-2,6-P
2
concentration.
Moreover, our results demonstrate that uPFK-2 is
overexpressed in perivenous diabetic liver zones, as
assessed by hydrodynamically delivered GFP as a
perivenous marker. In the liver, hepatocytes are not
terminally differentiated in normal conditions, and can
E2F1
Cyclin D
uPFK-2
04
08
15
0
2
4
6
8
10
12
0408015Days after
STZ
Protein expression
(folds of induction)
0
2
4
6
8
10
12
Protein expression
(folds of induction)
0
2
4
6
8
10
12
Protein expression
(folds of induction)
*
**
*
*
**
*
***
Cyclin D
E2F1
uPFK-2
Loading control
P-Akt ser473
P-p38
0
4
8
15
Days after
A
B
STZ
Loading control
C/EBP
33 KDa
C/EBP
LAP
Days after
STZ
04
08015
Loading control
Fig. 7. Western blot analysis of cell growth
and proliferation markers in mouse livers
during diabetes induction. Western blot anal-
ysis was performed with antibodies against
phosphorylated p38 and Akt Ser473 (A) and
against C ⁄ EBPb,C⁄ EBPa, cyclin D, E2F1
and uPFK-2 (B). Fifty micrograms of mice
liver extracts, obtained in fasting conditions,
on day 0, 4, 8 and 15 after STZ injection
were used. Protein was used as a loading
control. (C) Cyclin D, E2F1 and uPFK-2 pro-
tein expression, expressed as fold induction
versus day 0, are represented. All graph
points and bars represent the mean ± stan-
dard error of the mean (SEM) of the data
obtained by western blot densitometric
scanning from different animals (n = 4–5)
(*P < 0.05; **P < 0.01; ***P < 0.001).
J. Duran et al. Pfkfb3 upregulation in STZ-induced diabetic mouse liver
FEBS Journal 276 (2009) 4555–4568 ª 2009 The Authors Journal compilation ª 2009 FEBS 4561
rapidly enter the cell division cycle on stimulation.
Proliferation starts in the periportal zone, but most
hepatocytes proliferate after a few days. This phase is
associated with the formation of hepatocyte accumula-
tion of 8–10 cells (clusters) arranged around immature
or disintegrating vascular channels [31,47]. Our results
demonstrate that uPFK-2-positive hepatocytes display
a cluster distribution in diabetic liver.
To determine whether the Pfkfb3 gene was induced
via transcriptional upregulation, we performed an
in vivo promoter study using hydrodynamic gene deliv-
ery. Luciferase activity was determined in liver trans-
fected with the Pfkfb3 ⁄ -3566 promoter construct [16].
Our results reveal sustained Pfkfb3 promoter activa-
tion in STZ-induced diabetic mouse liver compared
with nondiabetic controls, demonstrating that the
Pkfbf3 upregulation observed in STZ-induced diabetic
animals is a result of its transcriptional activation.
As it has been reported that persistent hyperglyca-
emia increases the production of oxygen free radicals
from glucose autoxidation and protein glycosylation
[48,49], we next focused on the possibility that NF-jB
might be determinant for Pfkfb3 gene transcription in
this model. Livers from STZ-induced diabetic mice
were analysed by EMSA in order to test for the pres-
ence of p65 NF-jB, but, surprisingly, we found no dif-
ferences in this transcription factor among time course
samples. To analyse whether NF-jB regulates Pfkfb3
gene expression in an in vitro model, we used
RAW wild-type and RAW IjB aDA cells. After LPS
uPFK-2
P-p70S6K
P-p38
P-ERK
Caspase 3
Cyclin D
-tubulin
P-Akt Ser473
Basal
LY 294002
Rapamycin
PD 98059
SB 203580
0.0
0.2
0.4
0.6
0.8
1.0
1.2
EGF
LY294002
++
–+
Pfkfb3 expression
(relative values)
*
0
0.5
1
1.5
uPFK-2 expression
(folds of induction)
Basal
LY 294002
Rapamycin
PD 98059
SB 203580
*
*
t = 48 h
LY 294002
EGF
+
uPFK-2
Cyclin D
––
+
–
+
–
+
-tubulin
A
B
C
D
Fig. 8. uPFK-2 expression in proliferating primary hepatocytes after
treatment with different inhibitors. (A) Rat primary hepatocytes
were cultured with Williams E supplemented with 10% fetal bovine
serum on collagen-coated plates. Before and during culture, the
medium was supplemented with 50 l
M LY 294002, 50 nM rapamy-
cin, 50 l
M PD 98059 and 10 lM SB 203580, inhibiting pI3K, mTOR,
ERK and p38, respectively. UPFK-2 expression was analysed in all
circumstances, as was cell apoptosis status (caspase-3), using
50 lg of 24-h-treated hepatocyte protein extracts. Anti-P-Akt
Ser473, anti-P-p70S6K, anti-P-ERK and anti-P-p38 were used to
assess pathway inhibitions. c-Tubulin was used as a loading con-
trol. (B) In LY 294002- and rapamycin-treated cells, uPFK-2 protein
levels decreased by 20% according to densitometric analysis. All
graph points and bars represent the mean ± standard error of the
mean (SEM) of the data obtained by western blot densitometric
scanning from different animals (n =5)(*P < 0.05). (C) Rat primary
hepatocytes treated with LY 294002 and ⁄ or EGF (20 ngÆmL
)1
).
UPFK-2 and cyclin D expression were analysed in all samples using
50 lg of 48-h-treated hepatocyte extracts. (D) Quantitative real-time
PCR for Pfkfb3 in rat hepatocytes. Total RNA isolated after 48 h of
treatment with EGF and EGF + LY 294002 was used. The data rep-
resent the fold change versus the highest EGF-treated value and
were normalized to 18S cDNA. Graph bars represent the mean ±
SEM of three independent experiments.
Pfkfb3 upregulation in STZ-induced diabetic mouse liver J. Duran et al.
4562 FEBS Journal 276 (2009) 4555–4568 ª 2009 The Authors Journal compilation ª 2009 FEBS
stimulation, slight changes in uPFK-2 protein levels
were observed despite NF-jB activation. All of these
features also correlate with nonmodified liver TBARS
levels and catalase activity, two key markers of hepatic
oxidative stress. It seems clear that NF-jB is not
necessary for Pfkfb3 induction in our experimental
conditions.
We then demonstrated that the progressive induction
of uPFK-2 after STZ administration was accompanied
by the activation of hepatic cell proliferation pathways,
as shown by the detection of the activated markers
and transcription factors involved. Some of the mark-
ers initially studied can be ruled out. For example, the
gradual Pfkfb3 gene upregulation is probably not
caused by members of the C ⁄ EBP transcription factor
family. The increase in C ⁄ EBPb contributes to gluco-
neogenesis and phosphoenolpyruvate carboxykinase
(PEPCK) protein expression in STZ diabetic mice,
favouring hyperglycaemia [42]. Furthermore, total
C ⁄ EBPa expression fell on day 8 after STZ injection.
p38 involvement can also be ruled out: using the p38
inhibitor SB 203580 in cultured hepatocytes, uPFK-2
expression was maintained, whereas P-Akt Ser473
expression was totally inhibited, confirming the results
of a previous study [50].
Hepatocyte proliferation in response to growth and
autocrine factors, as well as in hepatocarcinogenesis, is
mediated via the activation of the PI3K pathway and
its downstream signal transduction effectors [35–
37,51,52]. Akt, one of these effectors, can regulate cell
growth through the regulation of mTOR. The mTOR
protein assembles into two functionally distinct com-
plexes: mTORC1 (mTOR complex 1) and mTORC2
[39]. Activation of Akt indirectly (through phosphory-
lation and inhibition of the GTPase-activating protein
activity of tuberous sclerosis complex 2) stimulates
mTORC1 activity and the phosphorylation of its sub-
strates, S6K1 ⁄ S6K2 and 4E-BP1 ⁄ 4E-BP2, thus stimulat-
ing translation and cell growth. Activation of mTORC2,
the other mTOR-containing complex, by growth fac-
tors stimulates the phosphorylation and activation of
its substrate Akt on Ser473. Thus, mTOR through
mTORC1 and mTORC2 activities participates in the
signalling of Akt. These activities can be distinguished
using the inhibitor rapamycin, which specifically inhib-
its mTORC1, at least in short treatments [39,40,53].
Our results demonstrate that, during the development
of diabetes, livers from STZ-treated animals gradually
show activation of PI3K and mTORC2, corroborated
by a sustained increase in P-Akt Ser473 levels from
day 4 after STZ injection onwards (Fig. 7A). Akt pro-
motes cell survival by phosphorylating transcription
factors that control the expression of pro- and anti-
apoptotic genes, and also via cell cycle progression,
through several mechanisms including increased cyclin
D transcription and translation, inhibitory phosphory-
lation and reduced transcription of cyclin-dependent
kinase (CDK) inhibitors. In agreement with this, we
have also shown that, during diabetes, Akt stimulates
protein synthesis by the activation of mTORC1
through the phosphorylation of its target p70-S6K1 on
Thr389. The use of specific inhibitors of mTORC1 and
PI3K confirmed this observation (Fig. 8A). These data
are consistent with previous reports implicating
mTORC1 in hepatic proliferation [35,52]. Ser486 phos-
phorylation of heart PFK-2 isozyme has been shown
to be regulated via PI3K ⁄ Akt signalling [54]. In agree-
ment with these results, the data presented here clearly
show that uPFK-2 expression decreases when hepato-
cytes are treated with rapamycin and LY 294002, and
indicate that PFK-2 activity may be regulated by
PI3K–Akt–mTOR.
A pivotal protein in the process that leads to cell
cycle progression and DNA synthesis in hepatocytes is
cyclin D. Coutant et al. [36] demonstrated that, in
growth factor-stimulated hepatocytes, LY 294002 and
also rapamycin completely prevent cyclin D1 activa-
tion at the mRNA and protein levels. Our results cor-
relate the phosphorylated status of Akt with a
progressive induction of cyclin D in diabetic mouse
liver from day 8 after STZ injection. This observation
supports the hypothesis that the complex network that
leads hepatocytes to proliferate is active in diabetic
liver. D-type cyclin levels are high in proliferating cells,
and Yamamoto et al. [55] reported that the activation
of the PI3K–Akt pathway is essential for the nuclear
shift of cyclin D. Sustained mitogenic signals stimulate
transcriptional activation of the D-type cyclin genes,
synthesis of cyclin D proteins and their assembly with
cdk4 ⁄ 6. The activated cyclin D–cdk 4 ⁄ 6 complex phos-
phorylates Rb protein, disrupting its association with
E2F and allowing the transcriptional activation of
S-phase genes [55]. One of the genes whose expression
is increased at the G1 ⁄ S transition of the cell cycle is
PFK-2 [56]. Furthermore, we have also found that
Pfkfb3 gene silencing induces cell cycle delay, corrobo-
rating its role in sustaining high glycolytic flux in pro-
liferative cells and its involvement in cell cycle
progression [20].
E2F transcription factors regulate the timely expres-
sion of a series of genes whose products are essential
for cell proliferation. Free E2F activates transcription,
but, when associated with Rb family members, it func-
tions as a transcriptional repressor. E2F DNA-binding
sites have been identified in promoters of many genes
that are central to the regulation of cell cycle progres-
J. Duran et al. Pfkfb3 upregulation in STZ-induced diabetic mouse liver
FEBS Journal 276 (2009) 4555–4568 ª 2009 The Authors Journal compilation ª 2009 FEBS 4563
sion [57]. Our hypothesis that diabetic mouse liver
exhibits increased hepatocyte proliferation is corrobo-
rated by the high levels of E2F found in these animals,
in contrast with nondiabetic cohorts.
In conclusion, STZ-induced diabetic mouse liver
shows increased Pfkfb3 mRNA and protein levels,
regulated via transcriptional promoter activation.
Moreover, progressively increased concentrations of
Fru-2,6-P
2
correlate with gradually overexpressed
uPFK-2 protein in liver after STZ injection. UPFK-2-
overexpressing hepatocytes are perivenously distributed
and exhibit a cluster-forming structure that also sug-
gests cellular proliferation status. All of these events
correlate with the activation, in diabetic mouse liver,
of cyclin D and E2F1, two downstream effectors of
the PI3K, Akt and mTOR proliferation pathways.
Materials and methods
Chemicals
Media, sera and antibiotics were obtained from Life Tech-
nologies, Inc. (Grand Island, NY, USA). Poly-dI:dC was
purchased from Amersham Bioscience Corp. (Piscataway,
NJ, USA). STZ and EGF were obtained from Sigma–
Aldrich (St Louis, MO, USA). LY 294002, rapamycin, PD
98059 and SB 203580 were purchased from Calbiochem
(Darmstadt, Germany).
Plasmids
pEGFP containing an early cytomegalovirus promoter and
an enhanced GFP was purchased from Clontech (Palo
Alto, CA, USA). The Pfkfb3 ⁄ -3566 promoter construct
cloned into the pGL2-basic vector (Promega, Madison, WI,
USA), with the firefly luciferase gene as a reporter, has
been described elsewhere [16]. Plasmid DNA was prepared
using the Nucleobond MaxiPrep Kit (Macherey-Nagel,
Du
¨
ren, Germany), and contained no detectable bacterial
genomic DNA or RNA contamination by DNA gel electro-
phoresis. Plasmid DNA preparations contained less than
20% open circular or linear DNA.
Animal care and treatment
Male C57 ⁄ BL6 mice purchased from Harlan Interfarma
IBERICA S.L (Barcelona, Spain) were maintained under
a constant 12 h light ⁄ dark cycle and fed a standard rodent
chow and water ad libitum. All animal protocols were
approved by the Ethics Committee at the University of
Barcelona. Mice weighing 20–22 g were made diabetic with
a 2-day intraperitoneal injection of 100 mgÆkg
)1
STZ in
100 mm citric ⁄ citrate buffer, pH 4.5, in fasting conditions.
Glycaemia was controlled for 15 days and only mice with
fasting blood glucose concentrations above 250 mgÆdL
)1
and a plasma insulin concentration below 0.15 lgÆL
)1
were
used. All animals were killed, at different treatment steps,
after 16 h of fasting by cervical dislocation. Livers were
dissected, snap frozen in liquid nitrogen and stored at
)80 °C until analysis. For in vivo promoter activity studies,
the caudate lobe was frozen in liquid nitrogen and stored at
)80 °C, or used directly.
Cell culture
The murine macrophage cell lines RAW 264.7 and RAW
IjB aDA were kindly provided by Dr A. Castrillo (De-
partamento de Bioquı
´
mica y Biologı
´
a Molecular, Universi-
dad de Las Palmas, Gran Canaria, Spain). They were
cultured in DMEM (Biological Industries, Kibbutz Beit
Haemek, Israel) supplemented with 10% fetal bovine serum
(Invitrogen, Carlsbad, CA, USA), l-glutamine and antibiot-
ics, and incubated in a humidified atmosphere of 10%
CO
2
at 37 °C. Rat hepatocytes were obtained as in
Bartrons et al. [29], seeded for 4 h on collagen-coated plates
with Williams E medium (BioWhittaker, Cambrex Bio Sci-
ence, Verviers, Belgium) supplemented with gentamicin and
10% fetal bovine serum, and cultured with or without fetal
bovine serum, EGF and inhibitors.
Quantitative real-time PCR
RNA was isolated from diabetic and control C57 ⁄ BL6 mice
liver, or from rat primary cultured hepatocytes, using the
RNeasy Protect Mini Kit (Qiagen, Valencia, CA, USA) fol-
lowing the manufacturer’s protocol. The concentration and
purity of all RNAs were determined using the
A
260 nm
⁄ A
280 nm
ratio and by formaldehyde gel electropho-
resis. Five micrograms of total RNA were reverse tran-
scribed using a Ready-To-Go You Prime First-Strand
Beads Kit (GE Healthcare, Piscataway, NJ, USA), employ-
ing random primer hexamers. Pfkfb3 was specifically
amplified by real-time PCR using the probe ⁄ primer set
Mm00504650-m1, and Pfkfb1 and Pfkfb4 using
Mm01256238-m1 and Mm 01235506-m1, respectively
(Applied Biosystems, Foster City, CA, USA). The relative
expression of the gene was normalized to that of 18S RNA
(Hs99999901-s1). Gene expression in each sample was then
compared with the expression in control mouse liver.
In vivo transfection and luciferase assays
Transfections were performed using hydrodynamic gene
transfer, as described in Go
´
mez-Valade
´
s et al. [30]. GFP
plasmid (3 lg of DNA per gram of body weight) and
Pfkfb3 ⁄ -3566 promoter construct (30 l g of DNA per
mouse) were injected in a 1.7–2 mL volume through the tail
vein. Following the hydrodynamic-based transfection proce-
Pfkfb3 upregulation in STZ-induced diabetic mouse liver J. Duran et al.
4564 FEBS Journal 276 (2009) 4555–4568 ª 2009 The Authors Journal compilation ª 2009 FEBS
dure, the transgene was mainly expressed in the liver, in
around 40% of cells [58]. After 24 h, the animals were
killed and the liver caudate lobe was frozen in liquid nitro-
gen in order to perform luciferase assays. The tissue was
homogenized using Polytron with 1 mL of luciferase lysis
buffer, and the luciferase activity was measured in total
extract with the TD20 ⁄ 20 luminometer (Turner Designs,
Sunnyvale, CA, USA). The protein content of each sample
was determined using the Bradford assay (BioRad, Munich,
Germany). Cotransfection with PSV-b-galactosidase plas-
mid DNA was carried out to normalize transfection effi-
ciencies in different transfectants. The b-galactosidase
activity was determined in 3 lL of tissue extract using the
luminescent b-galactosidase Clontech detection Kit II
(Clontech, Palo Alto, CA, USA).
Western blot
Western blot was performed with 50 lg of total liver
extract in a 20 mm KH
2
PO
4
,10mm EDTA, 100 mm KF
buffer with protease and phosphatase inhibitors (pH 7.1),
or with 50 lg of total cellular protein extracts from rat pri-
mary hepatocytes or RAW cells using a 50 mm Tris ⁄ HCl,
pH 6.8, 10% glycerol and 2% SDS lysis buffer. Proteins
were separated by 10% SDS-PAGE and transferred to an
Immobilon membrane (Millipore Corp., Bedford, MA,
USA). Membranes were probed with the following primary
antibodies: specific polyclonal antibodies against the C-ter-
minus of uPFK-2 [17] and tPFK-2 [59]; anti-LPFK-2, anti-
PCNA, anti-C ⁄ EBPa,C⁄ EBPb and E2F-1 from Santa Cruz
Biotechnology (Santa Cruz, CA, USA); anti-cyclin D from
Upstate (Charlottesville, VA, USA); anti-P-Akt Ser473 and
P-p70S6K Thr389 from Cell Signaling (Danvers, MA,
USA); anti-P-p38 Thr180 ⁄ Tyr182 from New England
Biolabs (Beverly, MA, USA); anti-caspase-3 from BD
Biosciences PharMingen (San Diego, CA, USA); and anti-
c-tubulin from Sigma-Aldrich. Bound antibody was
visualized with horseradish peroxidase-conjugated sheep
rabbit IgG or donkey mouse IgG secondary antibodies,
and developed by enhanced chemiluminescence using ECL
(Amersham Bioscience Corp.).
Electrophoretic mobility shift assay (EMSA)
Fresh nuclear extracts and EMSA were assayed as
described in Obach et al. [16]. A double-stranded oligonu-
cleotide was prepared by mixing equal amounts of comple-
mentary single-stranded DNAs in 50 mm NaCl, heating to
70 °C for 15 min, and cooling at room temperature. Oligo-
nucleotides containing the consensus binding sequence for
NF-jB were purchased from Roche Diagnostics (Basel,
Switzerland) (Refs. 623227 and 623228). The annealed oli-
gonucleotides were labelled with
32
P in the presence of
[c-
32
P]ATP and T4 polynucleotide kinase.
Confocal microscopy
Livers were fixed in 4% paraformaldehyde for 16 h and
maintained in NaCl ⁄ P
i
-Sacarose 30% for 48 h. Then, they
were immersed in OCT (Tissue-Tek, Miles, Inc., CA, USA)
and frozen by dry ice. Tissues were cut into 7 lm sections
using Cryostate. GFP was detected using a spectral confo-
cal microscope (Leica TCS-SL, Columbus, OH, USA).
uPFK-2 was immunostained using indirect immunofluores-
cence with uPFK-2 (1 : 10 dilution) polyclonal antibody,
followed by an rabbit IgG secondary antibody conjugated
to Alexa-Fluor 568 (Invitrogen, Carlsbad, CA, USA).
Topro III (Invitrogen) (1 : 1000) was used in order to dye
nuclei. The omission of primary antibody was used as a
negative control.
Measurement of metabolic parameters
Plasma insulin levels were measured using ultrasensitive
Mouse Insulin ELISA (Mercodia AB, Uppsala, Sweden).
Plasma glucose levels were measured using the Glucocard
Memory 2 system (Menarini, Florence, Italy). Hepatic
injury was evaluated by measuring transaminase levels using
commercial kits from Boehringer Mannheim (Munich, Ger-
many). Fru-2,6-P
2
was determined following the method
described by Van Schaftingen et al. [60]. ‘Total’ and ‘active’
PFK-2 activities in liver extracts were obtained following
the method described by Bartrons et al. [29]. Briefly, liver
samples were homogenized in 10 vol of ice-cold 100 mm
KCl, 20 mm N-[tris(hydroxymethyl)methyl]-2 aminoethane-
sulfonic acid, 2-[(2-hydroxy-1,1-bis(hydroxymethyl)ethyl)
amino ethanesulfonic acid (TES), 5 mm potassium phos-
phate, 10 mm EGTA and 1 m m dithiothreitol at pH 7.1,
and centrifuged at 27 000 g for 15 min at 4 °C. The super-
natants were used for the assay of the ‘total’ activity, incu-
bated at pH 8.5, and for the ‘active’ form, at pH 6.6. PFK-2
activities were calculated by measuring the rate of Fru-2,6-
P
2
production from 5 mm fructose-6-phosphate and 5 mm
MgATP. In the conditions of the assay, the ‘active’ form
corresponds to the activity of the nonphosphorylated form
of the enzyme measured [28,29]. Protein concentration was
determined by the Bradford-based Bio-Rad assay.
Oxidative stress
The steady-state level of lipoperoxidation products was
assayed by determining TBARS. Frozen liver samples were
ground in a cold glass mortar and homogenized (350 mg of
tissue per 2.5 mL) in KCl 1.15% by Polytron at 4 °C. To
homogenized samples (200 lL), 50 lL of trichloroacetic
acid, 100 lL of 0.3 m HCl, 200 lL of 1% thiobarbituric
acid, 16 lL butylhydroxytoluene (BHT) and 2 lLof
0.14 mm EDTA were added. The mixture was incubated at
95 °C for 60 min, and was extracted with 220 l L of 1-buta-
J. Duran et al. Pfkfb3 upregulation in STZ-induced diabetic mouse liver
FEBS Journal 276 (2009) 4555–4568 ª 2009 The Authors Journal compilation ª 2009 FEBS 4565
nol. After a brief centrifugation, the butanol layer was
absorbed, measured at 540 nm (e = 153 mm
)1
Æcm
)1
) and
expressed as nanomoles of TBARS [malondialdehyde
(MDA) equivalents] per milligram of tissue. Catalase activ-
ity was assayed spectrophotometrically by the method
described in [61]. Results are expressed in catalase units per
milligram of protein.
Statistics
The results are expressed as the mean ± standard error.
Statistical analysis was always performed by one-way analy-
sis of variance and Student’s t-test. P < 0.05 was consid-
ered to be significant.
Acknowledgements
We are grateful to Dr A. Castrillo (Departamento de
Bioquı
´
mica y Biologı
´
a Molecular, Universidad de Las
Palmas, Gran Canaria, Spain) for providing RAW cells,
and to E. Adanero, Alvaro Gimeno, M. Nieves Calvo,
Laura Novellasdemunt, Miguel A. Pen
˜
a, Dr E. Castan
˜
o,
Dr M. Molas and Dr Alicia Garcia for skilful technical
assistance. We also thank Robin Rycroft for editing the
English. J.D. was the recipient of a research fellowship
from the Generalitat de Catalunya, and M.O. and M.G.
from the Ministerio de Educacio
´
n y Ciencia. This study
was supported by the Ministerio de Educacio
´
n y Ciencia
(BFU2006 ⁄ 02412 and BFU2009 ⁄ 07380).
References
1 Dhahbi JM, Mote PL, Cao SX & Spindler SR (2003)
Hepatic gene expression profiling of streptozotocin-
induced diabetes. Diabetes Technol Ther 5, 411–420.
2 Szkudelski T (2001) The mechanism of alloxan and
streptozotocin action in B cells of the rat pancreas.
Physiol Res 50, 537–546.
3 Herrman CE, Sanders RA, Klaunig JE, Schwarz LR &
Watkins JB III (1999) Decreased apoptosis as a mecha-
nism for hepatomegaly in streptozotocin-induced
diabetic rats. Toxicol Sci 50, 146–151.
4 Shankar K, Vaidya VS, Apte UM, Manautou JE,
Ronis MJ, Bucci TJ & Mehendale HM (2003) Type 1
diabetic mice are protected from acetaminophen hepato-
toxicity. Toxicol Sci 73, 220–234.
5 Van Schaftingen E, Jett MF, Hue L & Hers HG (1981)
Control of liver 6-phosphofructo-2-kinase by fructose-
2,6-bisphosphate and other effectors. Proc Natl Acad
Sci USA 78, 3483–3486.
6 Pilkis SJ, Claus TH, Kurland IJ & Lange AJ (1995)
6-Phosphofructo-2-kinase ⁄ fructose-2,6-bisphosphatase:
a metabolic signaling enzyme. Annu Rev Biochem 64,
799–835.
7 Wu C, Okar DA, Kang J & Lange AJ (2005) Reduction
of hepatic glucose production as a therapeutic target in
the treatment of diabetes. Curr Drug Targets Immune
Endocr Metabol Disord 5, 51–59.
8 Van Schaftingen E (1987) Fructose 2,6-bisphosphate.
Adv Enzymol Relat Areas Mol Biol 59, 315–395.
9 Rider MH, Bertrand L, Vertommen D, Michels PA,
Rousseau GG & Hue L (2004) 6-Phosphofructo-2-
kinase ⁄ fructose-2,6-bisphosphatase: head-to-head with a
bifunctional enzyme that controls glycolysis. Biochem J
381, 561–579.
10 Hue L & Rider MH (1987) Role of fructose 2,6-bis-
phosphate in the control of glycolysis in mammalian
tissues. Biochem J 245, 313–324.
11 Okar D, Manzano A, Navarro-Sabate
´
A, Riera L,
Bartrons R & Lange AJ (2001) PFK-2 ⁄ FBPase-2:
maker and breaker of the essential biofactor fructose-
2,6-bisphosphate. Trends Biochem Sci 26, 30–35.
12 Manzano A, Rosa JL, Ventura F, Perez JX, Nadal M,
Estivill X, Ambrosio S, Gil J & Bartrons R (1998)
Molecular cloning, expression, and chromosomal locali-
zation of a ubiquitously expressed human 6-phosphofr-
ucto-2-kinase ⁄ fructose-2,6-bisphosphatase gene
(PFKFB3). Cytogenet Cell Genet 83, 214–217.
13 Hamilton JA, Callaghan MJ, Sutherland RL & Watts
CK (1997) Identification of PRG1, a novel progestin-
responsive gene with sequence homology to 6-phosp-
hofructo-2-kinase ⁄ fructose-2,6-bisphosphatase. Mol
Endocrinol 11, 490–502.
14 Chesney J, Mitchell R, Benigni F, Bacher M, Spiegel L,
Al-Abed Y, Han JH, Metz C & Bucala R (1999) An
inducible gene product for 6-phosphofructo-2-kinase
with an AU-rich instability element: role in tumor cell
glycolysis and the Warburg effect. Proc Natl Acad Sci
USA 96, 3047–3052.
15 Minchenko A, Leshchinsky I, Opentanova I, Sang N,
Srinivas V, Armstead V & Caro J (2002) Hypoxia-
inducible factor-1-mediated expression of the 6-phosp-
hofructo-2-kinase ⁄ fructose-2,6-bisphosphatase-3
(PFKFB3) gene. Its possible role in the Warburg effect.
J Biol Chem 277, 6183–6187.
16 Obach M, Navarro-Sabate A, Caro J, Kong X, Duran
J, Gomez M, Perales JC, Ventura F, Rosa JL &
Bartrons R (2004) 6-Phosphofructo-2-kinase (pfkfb3)
gene promoter contains hypoxia-inducible factor-1 bind-
ing sites necessary for transactivation in response to
hypoxia. J Biol Chem 279, 53562–53570.
17 Riera L, Obach M, Navarro-Sabate A, Duran J, Perales
JC, Vinals F, Rosa JL, Ventura F & Bartrons R (2003)
Regulation of ubiquitous 6-phosphofructo-2-kinase by
the ubiquitin-proteasome proteolytic pathway during
myogenic C2C12 cell differentiation. FEBS Lett 550,
23–29.
18 Sakakibara R, Kato M, Okamura N, Nakagawa T,
Komada Y, Tominaga N, Shimojo M & Fukasawa M
Pfkfb3 upregulation in STZ-induced diabetic mouse liver J. Duran et al.
4566 FEBS Journal 276 (2009) 4555–4568 ª 2009 The Authors Journal compilation ª 2009 FEBS
(1997) Characterization of a human placental fructose-
6-phosphate, 2-kinase ⁄ fructose-2,6-bisphosphatase.
J Biochem 122, 122–128.
19 Riera L, Manzano A, Navarro-Sabate A, Perales JC &
Bartrons R (2002) Insulin induces PFKFB3 gene
expression in HT29 human colon adenocarcinoma cells.
Biochim Biophys Acta 1589, 89–92.
20 Calvo MN, Bartrons R, Castano E, Perales JC,
Navarro-Sabate A & Manzano A (2006) PFKFB3 gene
silencing decreases glycolysis, induces cell-cycle delay
and inhibits anchorage-independent growth in HeLa
cells. FEBS Lett 580, 3308–3314.
21 Atsumi T, Chesney J, Metz C, Leng L, Donnelly S,
Makita Z, Mitchell R & Bucala R (2002) High expres-
sion of inducible 6-phosphofructo-2-kinase ⁄ fructose-2,6-
bisphosphatase (iPFK-2; PFKFB3) in human cancers.
Cancer Res 62, 5881–5887.
22 Duran J, Gomez M, Navarro-Sabate A, Riera-Sans L,
Obach M, Manzano A, Perales JC & Bartrons R (2008)
Characterization of a new liver- and kidney-specific
pfkfb3 isozyme that is downregulated by cell prolifera-
tion and dedifferentiation. Biochem Biophys Res Com-
mun 367, 748–754.
23 Duran J, Navarro-Sabate A, Pujol A, Perales JC,
Manzano A, Obach M, Gomez M & Bartrons R (2007)
Overexpression of ubiquitous 6-phosphofructo-2-kinase
in the liver of transgenic mice results in weight gain.
Biochem Biophys Res Commun 365, 291–297.
24 Gil J, Carreras J & Bartrons R (1986) Effects of diabe-
tes on fructose 2, 6-P2, glucose 1, 6-P2 and 6-phosp-
hofructo 2-kinase in rat liver. Biochem Biophys Res
Commun 136, 498–503.
25 Gil J, Miralpeix M, Carreras J & Bartrons R (1988)
Insulin-like effects of vanadate on glucokinase activity
and fructose 2,6-bisphosphate levels in the liver of dia-
betic rats. J Biol Chem 263, 1868–1871.
26 Miralpeix M, Decaux JF, Kahn A & Bartrons R (1991)
Vanadate induction of L-type pyruvate kinase mRNA
in adult rat hepatocytes in primary culture. Diabetes 40,
462–464.
27 Wu C, Okar DA, Newgard CB & Lange AJ (2001)
Overexpression of 6-phosphofructo-2-kinase ⁄ fructose-
2,6-bisphosphatase in mouse liver lowers blood glucose
by suppressing hepatic glucose production. J Clin Invest
107, 91–98.
28 Van Schaftingen E, Davies DR & Hers HG (1981)
Inactivation of phosphofructokinase 2 by cyclic
AMP-dependent protein kinase. Biochem Biophys Res
Commun 103, 362–368.
29 Bartrons R, Hue L, Van Schaftingen E & Hers HG
(1983) Hormonal control of fructose 2,6-bisphosphate
concentration in isolated rat hepatocytes. Biochem
J 214, 829–837.
30 Go
´
mez-Valade
´
s AG, Vidal-Alabro A, Molas M, Boada
J, Bermudez J, Bartrons R & Perales JC (2006) Over-
coming diabetes-induced hyperglycemia through inhibi-
tion of hepatic phosphoenolpyruvate carboxykinase
(GTP) with RNAi. Mol Ther 13, 401–410.
31 Jungermann K (1995) Zonation of metabolism and gene
expression in liver. Histochem Cell Biol 103, 81–91.
32 Arsura M & Cavin LG (2005) Nuclear factor-kappaB
and liver carcinogenesis. Cancer Lett 229, 157–169.
33 Diaz-Guerra MJ, Castrillo A, Martin-Sanz P & Bosca
L (1999) Negative regulation by phosphatidylinositol
3-kinase of inducible nitric oxide synthase expression
in macrophages. J Immunol 162, 6184–6190.
34 Chesney J (2006) 6-Phosphofructo-2-kinase
⁄ fructose-
2,6-bisphosphatase and tumor cell glycolysis. Curr Opin
Clin Nutr Metab Care 9, 535–539.
35 Band CJ, Mounier C & Posner BI (1999) Epidermal
growth factor and insulin-induced deoxyribonucleic acid
synthesis in primary rat hepatocytes is phosphatidylino-
sitol 3-kinase dependent and dissociated from protoonc-
ogene induction. Endocrinology 140, 5626–5634.
36 Coutant A, Rescan C, Gilot D, Loyer P, Guguen-
Guillouzo C & Baffet G (2002) PI3K-FRAP ⁄ mTOR
pathway is critical for hepatocyte proliferation whereas
MEK ⁄ ERK supports both proliferation and survival.
Hepatology 36, 1079–1088.
37 Cho MK & Kim SG (2003) Hepatocyte growth factor
activates CCAAT enhancer binding protein and cell
replication via PI3-kinase pathway. Hepatology 37,
686–695.
38 Wang GL & Timchenko NA (2005) Dephosphorylated
C ⁄ EBPalpha accelerates cell proliferation through
sequestering retinoblastoma protein. Mol Cell Biol 25,
1325–1338.
39 Wullschleger S, Loewith R & Hall MN (2006)
TOR signaling in growth and metabolism. Cell 124,
471–484.
40 Zdychova J & Komers R (2005) Emerging role of Akt
kinase ⁄ protein kinase B signaling in pathophysiology of
diabetes and its complications. Physiol Res 54, 1–16.
41 Johnson PF (2005) Molecular stop signs: regulation of
cell-cycle arrest by C ⁄ EBP transcription factors. J Cell
Sci 118, 2545–2555.
42 Arizmendi C, Liu S, Croniger C, Poli V & Friedman JE
(1999) The transcription factor CCAAT ⁄ enhancer-bind-
ing protein beta regulates gluconeogenesis and phospho-
enolpyruvate carboxykinase (GTP) gene transcription
during diabetes. J Biol Chem 274, 13033–13040.
43 Dajani OF, Meisdalen K, Guren TK, Aasrum M,
Tveteraas IH, Lilleby P, Thoresen GH, Sandnes D &
Christoffersen T (2008) Prostaglandin E(2) upregulates
EGF-stimulated signaling in mitogenic pathways involv-
ing Akt and ERK in hepatocytes. J Cell Physiol 214,
371–380.
44 Rosa JL, Tauler A, Lange AJ, Pilkis SJ & Bartrons R
(1992) Transcriptional and posttranscriptional
regulation of 6-phosphofructo-2-kinase ⁄ fructose-2,6-bis-
J. Duran et al. Pfkfb3 upregulation in STZ-induced diabetic mouse liver
FEBS Journal 276 (2009) 4555–4568 ª 2009 The Authors Journal compilation ª 2009 FEBS 4567
phosphatase during liver regeneration. Proc Natl Acad
Sci USA 89, 3746–3750.
45 Bando H, Atsumi T, Nishio T, Niwa H, Mishima S,
Shimizu C, Yoshioka N, Bucala R & Koike T (2005)
Phosphorylation of the 6-phosphofructo-2-kinase ⁄ fruc-
tose 2,6-bisphosphatase ⁄ PFKFB3 family of glycolytic
regulators in human cancer. Clin Cancer Res 11, 5784–
5792.
46 Bartrons R & Caro J (2007) Hypoxia, glucose metabo-
lism and the Warburg’s effect. J Bioenerg Biomembr 39,
223–229.
47 Zimmermann A (2004) Regulation of liver regeneration.
Nephrol Dial Transplant 19(Suppl 4), iv6–iv10.
48 Hunt JV, Smith CC & Wolff SP (1990) Autoxidative
glycosylation and possible involvement of peroxides and
free radicals in LDL modification by glucose. Diabetes
39, 1420–1424.
49 Wolff SP & Dean RT (1987) Glucose autoxidation and
protein modification. The potential role of ‘autoxidative
glycosylation’ in diabetes. Biochem J 245, 243–250.
50 Qiao L, MacDougald OA & Shao J (2006) CCAAT ⁄
enhancer-binding protein alpha mediates induction of
hepatic phosphoenolpyruvate carboxykinase by p38
mitogen-activated protein kinase. J Biol Chem 281,
24390–24397.
51 Wang GL, Iakova P, Wilde M, Awad S & Timchenko
NA (2004) Liver tumors escape negative control of
proliferation via PI3K ⁄ Akt-mediated block of C ⁄ EBP
alpha growth inhibitory activity. Genes Dev 18, 912–
925.
52 Hay N & Sonenberg N (2004) Upstream and down-
stream of mTOR. Genes Dev 18, 1926–1945.
53 Huang J & Manning BD (2009) A complex interplay
between Akt, TSC2 and the two mTOR complexes.
Biochem Soc Trans 37, 217–222.
54 Deprez J, Vertommen D, Alessi DR, Hue L & Rider
MH (1997) Phosphorylation and activation of heart
6-phosphofructo-2-kinase by protein kinase B and other
protein kinases of the insulin signaling cascades. J Biol
Chem 272, 17269–17275.
55 Yamamoto M, Tamakawa S, Yoshie M, Yaginuma Y
& Ogawa K (2006) Neoplastic hepatocyte growth asso-
ciated with cyclin D1 redistribution from the cytoplasm
to the nucleus in mouse hepatocarcinogenesis. Mol
Carcinog 45, 901–913.
56 Joaquin M, Salvado C, Bellosillo B, Lange AJ, Gil J &
Tauler A (1997) Effect of growth factors on the expres-
sion of 6-phosphofructo-2-kinase ⁄ fructose-2,6-bisphos-
phatase in Rat-1 fibroblasts. J Biol Chem 272,
2846–2851.
57 Parise P, Finocchiaro G, Masciadri B, Quarto M,
Francois S, Mancuso F & Muller H (2006) Lap2alpha
expression is controlled by E2F and deregulated in vari-
ous human tumors. Cell Cycle 5, 1331–1341.
58 Zhang G, Gao X, Song YK, Vollmer R, Stolz DB,
Gasiorowski JZ, Dean DA & Liu D (2004) Hydropora-
tion as the mechanism of hydrodynamic delivery. Gene
Ther 11, 675–682.
59 Go
´
mez M, Manzano A, Navarro-Sabate
´
A, Duran J,
Obach M, Perales JC & Bartrons R (2005) Specific
expression of pfkfb4 gene in spermatogonia germ cells
and analysis of its 5¢-flanking region. FEBS Lett 579,
357–362.
60 Van Schaftingen E, Lederer B, Bartrons R & Hers HG
(1982) A kinetic study of pyrophosphate: fructose-
6-phosphate phosphotransferase from potato tubers.
Application to a microassay of fructose 2,6-bisphos-
phate. Eur J Biochem 129, 191–195.
61 Aebi H (1984) Catalase in vitro. Methods Enzymol 105,
121–126.
Pfkfb3 upregulation in STZ-induced diabetic mouse liver J. Duran et al.
4568 FEBS Journal 276 (2009) 4555–4568 ª 2009 The Authors Journal compilation ª 2009 FEBS