Báo cáo khoa học: A novel, promoter-based, target-specific assay identifies 2-deoxy-D-glucose as an inhibitor of globotriaosylceramide biosynthesis docx
Bạn đang xem bản rút gọn của tài liệu. Xem và tải ngay bản đầy đủ của tài liệu tại đây (486.77 KB, 12 trang )
A novel, promoter-based, target-specific assay identifies
2-deoxy-
D-glucose as an inhibitor of globotriaosylceramide
biosynthesis
Tetsuya Okuda
1
, Koichi Furukawa
2
and Ken-ichi Nakayama
1
1 Glycolipids Function Analysis Team, Health Technology Research Center, National Institute of Advanced Industrial Science and Technology,
Kagawa, Japan
2 Department of Biochemistry II, Graduate School of Medicine, Nagoya University, Aichi, Japan
Introduction
Glycosphingolipid (GSL) is commonly found as a
component of the cell membrane in eukaryotic cells.
GSL is composed of ceramide and various ceramide-
linked carbohydrate chains. A large number of GSLs
are found in mammalian tissues, which can be classi-
fied in terms of a difference in their carbohydrate
Keywords
Fabry disease; glycosphingolipid;
glycosyltransferase; hemolytic uremic
syndrome; promoter
Correspondence
T. Okuda, Glycolipids Function Analysis
Team, Health Technology Research Center,
National Institute of Advanced Industrial
Science and Technology (AIST), 2217-14
Hayashi, Takamatsu, Kagawa 761-0395,
Japan
Fax: +81 87 869 3593
Tel: +81 87 869 3563
E-mail:
(Received 27 April 2009, revised 22 June
2009, accepted 15 July 2009)
doi:10.1111/j.1742-4658.2009.07215.x
Abnormal biosynthesis of globotriaosylceramide (Gb3) is known to be
associated with Gb3-related diseases, such as Fabry disease. The Gb3
synthase gene ( Gb3S) codes for a1,4-galactosyltransferase, which is a key
enzyme involved in Gb3 biosynthesis in vivo. Transcriptional repression of
Gb3S is a way to control Gb3 biosynthesis and may be a suitable target
for the treatment of Gb3-related diseases. To find a transcriptional inhibi-
tor for Gb3S, we developed a convenient cell-based chemical screening
assay system by constructing a fusion gene construct of the human Gb3S
promoter and a secreted luciferase as reporter. Using this assay, we identi-
fied 2-deoxy-d-glucose as a potent inhibitor for the Gb3S promoter. In cul-
tured cells, 2-deoxy-d-glucose markedly reduced endogenous Gb3S mRNA
levels, resulting in a reduction in cellular Gb3 content and a corresponding
accumulation of the precursor lactosylceramide. Moreover, cytokine-
induced expression of Gb3 on the cell surface of endothelial cells, which is
closely related to the onset of hemolytic uremic syndrome in O157-infected
patients, was also suppressed by 2-deoxy-d-glucose treatment. These results
indicate that 2-deoxy-d-glucose can control Gb3 biosynthesis through the
inhibition of Gb3S transcription. Furthermore, we demonstrated the
general utility of our novel screening assay for the identification of new
inhibitors of glycosphingolipid biosynthesis.
Abbreviations
2-AA, anthranilic acid; 2DG, 2-deoxy-
D-glucose; asialo-GM2, GalNAcb1,4LacCer; B4GalT6, b1,4-galactosyltransferase 6; BDNF, brain-derived
neurotrophic factor; EC, endothelial cell; FITC, fluorescein isothiocyanate; GlcNAc, N-acetylglucosamine; HUVEC, human umbilical vein
endothelial cell; GA1, asialo-GM1 (Galb1,3GalNAcb1,4LacCer); Gal, galactose; GAPDH, glyceraldehyde-3-phosphate dehydrogenase; Gb3,
globotriaosylceramide (Gala1,4LacCer); Gb3S, Gb3 synthase gene; Gb4, globotetraosylceramide (GalNAcb1,3Gala1,4LacCer); GD1a,
NeuAca2,3Galb1,3GalNAcb1,4(NeuAca2,3)LacCer; GD1b, Galb1,3GalNAcb1,4(NeuAca2,8NeuAca2,3)LacCer; GM1, Galb1,3GalNAcb1,4
(NeuAca2,3)LacCer; GM2, GalNAcb1,4(NeuAca2,3)LacCer; GM3, NeuAca2,3LacCer; GM3S, GM3 synthase; GSL, glycosphingolipid; GT1b,
NeuAca2,3Galb1,3GalNAcb1,4(NeuAca2,8NeuAca2,3)LacCer; HUS, hemolytic uremic syndrome; LacCer, lactosylceramide
(Galb1,4Glcb1Cer); Lc3, lactotriaosylceramide (GlcNAcb1,3LacCer); LPS, lipopolysaccharide; mAb, monoclonal antibody; MDR1, multiple drug
resistance protein 1; TNF-a, tumor necrosis factor-a; TPA, phorbol 12-myristate 13-acetate; TRE, TPA response element.
FEBS Journal 276 (2009) 5191–5202 ª 2009 The Authors Journal compilation ª 2009 FEBS 5191
structure [1]. Globotriaosylceramide (Gb3) is the initial
structure of the globo-series GSL [2]. Gb3 is known as
the blood group P
k
antigen [3], or the CD77 antigen,
which is associated with a subset of immature B-cell or
Burkitt’s lymphomas [4].
Although the molecular function of Gb3 is poorly
understood, recent reports have indicated that abnor-
mal expression and ⁄ or accumulation can lead to sev-
eral disease states. For example, patients with Fabry
disease, an X-linked lysosomal storage disease caused
by deficiency of the Gb3 catabolic enzyme a-galacto-
sidase A, have been found to accumulate Gb3 in vari-
ous tissues [5]. As a result of a defect in this enzyme,
depositions of Gb3 are found in numerous tissues,
notably the vascular endothelium, causing a systemic
disorder in patients, which functionally affects the
skin, eyes, kidney, heart and autonomic nervous
system.
Gb3 also plays a role in the well-characterized recep-
tor for verotoxin, a product of Escherichia coli O157
strain [6,7]. Infection of E. coli O157 is frequently
associated with hemolytic uremic syndrome (HUS),
resulting from vetoroxin-induced damage to endo-
thelial cells (ECs). Inflammatory mediators, such as
tumor necrosis factor-a (TNF-a) and lipopolysaccha-
ride (LPS), enhance the Gb3 expression level in ECs
through the up-regulation of Gb3S transcription. These
events are considered to be a progression towards the
onset of HUS [8–10]. Gb3 is synthesized from its pre-
cursor lactosylceramide (LacCer, Galb1,4Glcb1Cer)
and UDP-galactose by a1,4-galactosyltransferase
(EC 2.4.1.228) in the mammalian cell. A single gene,
the Gb3 ⁄ CD77 synthase gene (Gb3S), codes for
a1,4-galactosyltransferase. Indeed, targeted disruption
of Gb3S results in the complete absence of Gb3 and its
derivatives in vivo [10]. From these observations, we
reasoned that the transcriptional inhibition of Gb3S
may be an effective means of treatment of Gb3-related
diseases.
Previously, we have identified and characterized
the human Gb3S promoter [11]. The Gb3S promoter
is specifically activated in cells that express Gb3,
which indicates the importance of this promoter
activity for Gb3 expression. In this study, we devel-
oped a simple and convenient assay for monitoring
Gb3S promoter activity by using a secreted luciferase
reporter gene. Because this assay is able to measure
Gb3S promoter activity in a one-step reaction, the
method can be used to readily identify potential
transcriptional inhibitors of Gb3S. Using this assay,
we identified 2-deoxy-d -glucose (2DG) as a candidate
inhibitor for Gb3S transcription, and confirmed that
treatment with 2DG suppresses Gb3 biosynthesis
in vivo.
Results
Development of Gb3S promoter-driven luciferase
secretion cells
To identify a novel inhibitor for Gb3 biosynthesis, we
have recently developed a cell-based screening assay
using the pML reporter vector and the Gb3S pro-
moter. The pML reporter vector includes the Metridia
longa secreted luciferase gene [12] as a reporter gene.
The human Gb3S promoter has previously been identi-
fied in the 5¢-flanking region ()1893 bp to +84 bp
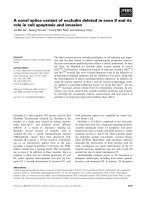
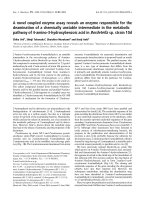
Fig. 1. Establishment of Gb3S promoter-driven luciferase secretion
cells. (A) The scheme of the constructed vector plasmid (pML-
Gb3Sp). Open box, Gb3S promoter; bold black arrow, reporter gene
(secreted Metridia luciferase); TB, transcriptional blocker; Kan
R
⁄
Neo
R
, kanamycin and neomycin resistance gene. (B) Luciferase
activity of vector transfectants. HeLa cells were transiently transfect-
ed with pML-Gb3Sp (Gb3Sp) or empty vector (pML). The luciferase
activity of the culture medium was measured as described in Experi-
mental procedures. The relative luciferase activity was determined
from the ratio of the activity in the transfectant with pML (open bar).
After G418 selection, stable pML-Gb3p or pML mutants were estab-
lished, and relative luciferase activities were calculated (filled bar).
A novel strategy for the inhibition of glycosphingolipid biosynthesis T. Okuda et al.
5192 FEBS Journal 276 (2009) 5191–5202 ª 2009 The Authors Journal compilation ª 2009 FEBS
from the transcriptional initiation site; GenBank acces-
sion number AB473818) of the human Gb3S gene
locus [11,13]. We amplified this region by PCR and
inserted it into the pML reporter vector as shown in
Fig. 1A. The resultant plasmid (pML-Gb3Sp) was
transfected into Gb3-positive HeLa cells. The stable
mutant HML-Gb3 (HeLa cells stably transfected with
pML-Gb3Sp) was subsequently established by G418
selection. A stable transfectant of pML empty vector,
named HML, was also established as a negative con-
trol to monitor background expression levels. As
shown in Fig. 1B, more than seven-fold overexpression
of luciferase reporter activity was observed in HML-
Gb3. Furthermore, the reporter activity was moder-
ately stronger than that of the transient transfectants.
This result is presumably because of the difference in
transfection efficiency between stable and transient
transfectants.
Characterization of the reporter activity
of HML-Gb3
For the purposes of chemical screening, we deter-
mined the optimal culture time and seeding cell
number of HML-Gb3 in a 24-well plate format. The
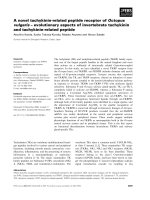
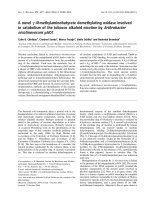
time course of the reporter activity of HML-Gb3 is
shown in Fig. 2 (left). The reporter activity of
HML-Gb3 increased in proportion to the culture
time and reached a plateau at around 48 h, whereas
the background ratio (HML-Gb3 ⁄ HML) reached a
plateau after around 16 h. The reporter activity of
HML-Gb3 also increased with cell number and
reached a plateau at around 4 · 10
5
cells (Fig. 2,
right). In this case, the background ratio reached a
plateau at around 2 · 10
5
cells (Fig. 2, left). From
these results, we conclude that the optimal culture
time and seeding cell number of HML-Gb3 in the
24-well plate format were 16 h and 2 · 10
5
cells,
respectively, for the rapid and highly sensitive moni-
toring of reporter activity. We used these conditions
in all subsequent experiments.
Identification of 2DG as a transcriptional inhibitor
of Gb3S
We examined the effects of a number of bioactive sub-
stances on the reporter activity of HML-Gb3 cells
(Fig. 3). First, we examined potential inhibitors for
transcriptional factor Sp1 (mithramycin A, strepto-
zotocin, 2DG, high glucose treatment), which has been
Fig. 2. Characterization of the reporter activ-
ity of HML-Gb3. Cells (2 · 10
5
) of HML-Gb3
(filled squares) or HML (open circles) were
seeded into a 24-well (15.49 mm diameter)
culture plate. Luciferase activity in the
culture medium was then measured at the
relevant incubation time (time course, top
left). A variety of cell numbers were exam-
ined (cell number, top right). The luciferase
activity was then measured after 16 h of
incubation. The ratios (HML-Gb3 ⁄ HML) of
these experiments are shown in the bottom
panels.
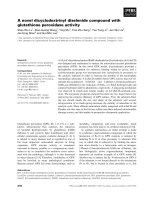
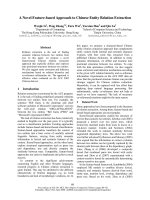
Fig. 3. Effect of candidate inhibitors on Gb3S promoter activity.
HML-Gb3 cells were treated with the following substances or con-
ditions for 16 h; 1, untreated control; 2, 10 m
M 2DG; 3, 30 mM glu-
cose (high glucose treatment); 4, 10 m
M streptozotocin; 5, 200 nM
mithramycin A; 6, 100 lM citrate; 7, 10 mM pyruvate; 8, 50 lM spli-
tomicin; 9, 100 l
M nicotinamide; 10, 20 ngÆmL
)1
TNF-a; 11, glucose
starvation; 12, 10 m
M GlcNAc; 13, 10 mM galactose; 14, 10 mM
2-deoxy-D-galactose; 15, 10 mM 2DG with 10 mM pyruvate; 16,
10 m
M 2DG with 50 lM splitomicin; 17, 10 mM 2DG with 100 lM
nicotinamide. After the treatment with each inhibitor, luciferase
activity in the culture medium was measured as described previ-
ously. The luciferase activity of the HML cell (HML) is indicated as
a negative control. The results represent relative luciferase activity
as a percentage of the untreated control. Error bars, mean ± SD,
n =4.
T. Okuda et al. A novel strategy for the inhibition of glycosphingolipid biosynthesis
FEBS Journal 276 (2009) 5191–5202 ª 2009 The Authors Journal compilation ª 2009 FEBS 5193
identified previously as an essential factor for Gb3S
promoter regulation [11]. Mithramycin A is a well-
characterized inhibitor of Sp1 transcriptional activity.
This compound inhibits the interaction of Sp1 protein
with its consensus DNA sequence [14,15]. Treatment
with 2DG, streptozotocin or high levels of glucose has
been reported to down-regulate the transcriptional
activity of Sp1 protein via O-GlcNAc modification
[16–19]. Surprisingly, only 2DG displayed a strong
inhibitory effect in the reporter activity assays using
HML-Gb3 cells.
2DG had a strong dose-dependent suppressive effect
on the Gb3S promoter (Fig. 4A), which was not dis-
played by any of the other chemicals examined.
Because 2DG is a well-known glycolytic inhibitor, as a
result of its inhibitory effect on glucose hexokinase
[16,20,21], it was suspected that the observed decrease
in reporter activity was caused by a depletion of ATP
in these cells. As expected, glucose starvation of HML-
Gb3, which diminishes ATP production, decreased the
reporter activity of HML-Gb3 cells (Fig. 3, bar 11).
However, the decreased reporter activity by 2DG
could not be salvaged by treatment with pyruvate,
which directly activates the tricarboxylic acid cycle to
generate ATP (Fig. 3, bar 15). Therefore, we con-
cluded that there was a very poor correlation between
the suppression of ATP generation and the effect of
2DG on the Gb3S promoter.
It is known that glycolytic inhibition stress induces
gene silencing [21]. Indeed, 2DG, citrate and pyruvate
are known to act as glycolytic inhibitors, which could
induce gene silencing via the same mechanism. How-
ever, these compounds showed no inhibitory effect on
the reporter activity of HML-Gb3 cells (Fig. 3, bars 6
and 7).
Previously, 2DG has been identified as an activator
for a class III histone deacetylase SIRT1, which
induced gene silencing through chromatin remodeling
[22]. To confirm the relationship between 2DG and
SIRT1 in HML-Gb3 cells, we examined the effects of
the SIRT1 inhibitors (splitomicin and nicotinamide)
[22,23] on 2DG treated HML-Gb3 cells. Treatment
with these SIRT1 inhibitors slightly enhanced reporter
activity in HML-Gb3 control cells (Fig. 3, bars 8 and
9). This result indicates that the reporter activity is
partly affected by SIRT1 activity in the cells. However,
reporter activity in 2DG-treated HML-Gb3 cells
did not recover. These results indicate that SIRT1 is
unrelated to the decrease in reporter activity in 2DG-
treated HML-Gb3 cells.
TNF-a is an inducer of Gb3 expression in ECs
[8–10]. It has been reported that TNF-a induces Gb3
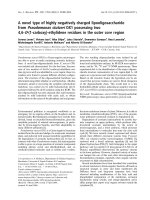
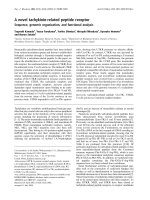
Fig. 4. The effect of 2DG on the HML-Gb3
cells. (A) Dose-dependent inhibitory effect
of 2DG on luciferase activity of HML-Gb3
cells. HML-Gb3 cells were treated with the
indicated concentration of 2DG for 16 h.
The results represent the relative luciferase
activity as a percentage of the luciferase
activity of untreated cells. Error bars,
mean ± SD, n = 2. (B) Time-dependent
alteration of luciferase activity of HML-Gb3
cells after 2DG treatment. The HML-Gb3
cells were incubated in the presence (open
squares) or absence (filled squares) of 2DG
(10 m
M) for the indicated times (individually
for 0, 4, 8 or 16 h). (C) Luciferase activity
of cell lysates (Cell) and culture medium
(Medium) from HML-Gb3 cells treated with
(+) or without ()) 2DG (10 m
M) for 16 h.
Error bars, mean ± SD, n = 4. (D) The num-
ber of viable (squares with full lines) and
dead (circles with dotted lines) cells after
treatment or not with 2DG (10 m
M) for the
indicated times (0, 24, 48 and 72 h). Filled
squares and circles, non-treated cells; open
squares and circles, 2DG-treated cells. Error
bars, mean ± SD, n =4.
A novel strategy for the inhibition of glycosphingolipid biosynthesis T. Okuda et al.
5194 FEBS Journal 276 (2009) 5191–5202 ª 2009 The Authors Journal compilation ª 2009 FEBS
expression via transcriptional up-regulation of Gb3S
[10,11]. The parent cell line of HML-Gb3 is also
known to be sensitive to TNF-a [24]. Thus, we fully
anticipated that TNF-a treatment would enhance the
reporter activity of HML-Gb3 cells. However, no such
change was observed after TNF-a treatment (Fig. 3,
bar 10).
To determine the key structure in 2DG for the inhi-
bition of the reporter activity of HML-Gb3 cells, we
examined the effects of structural analogues of 2DG,
such as N-acetylglucosamine (GlcNAc), galactose
(Gal) and 2-deoxy-d-galactose on HML-Gb3 cells
(Fig. 3, bars 12 and13). After treatment with these
compounds, we found a slight, but significant, decrease
in reporter activity only in the 2-deoxy-d-galactose-
treated HML-Gb3 cells. This result indicates that the
glucose backbone and deoxygenation of the hydroxy
group in carbon position 2 are important in decreasing
the reporter activity of HML-Gb3 cells.
2DG inhibits Gb3 biosynthesis via the
transcriptional repression of Gb3S in cells
To confirm whether 2DG inhibits Gb3S promoter
activity, we characterized several other effects of 2DG
on HML-Gb3 cells. Because 2DG treatment represses
human papillomavirus early in gene transcription
[16,20], which is essential for HeLa cell viability, pro-
longed exposure to 2DG causes cell growth inhibition
and death (Fig. 4D). These effects were observed in
cells 24 h after 2DG treatment. Indeed, almost all cells
were dead within 72 h. However, decreased reporter
activity of HML-Gb3 cells was detected immediately
after 2DG treatment (Fig. 4B). This result supports
the observation that 2DG toxicity barely affects the
reporter activity of HML-Gb3 16 h after treatment.
Our assay system used a secreted form of luciferase
as reporter. Hence, there is the possibility that the
apparent transcriptional repression of Gb3S could be
the result of 2DG-induced inhibition of protein secre-
tion. Thus, we measured the reporter activity in the
cell lysate from HML-Gb3 cells (Fig. 4C). Decreased
reporter activity was observed in the culture medium
of HML-Gb3 cells after 2DG treatment. However, no
reporter activity could be detected in the cell lysate
prepared from the same cells. From these results, we
conclude that 2DG treatment almost certainly
represses Gb3S promoter activity in HML-Gb3 cells.
To verify this conclusion, we analyzed the expression
levels of Gb3S mRNA and GSLs after 2DG treatment.
In order to decrease endogenous Gb3 or Gb3S mRNA
levels, long-term exposure of 2DG seems to be impor-
tant. Therefore, we used a Gb3 highly expressed
teratocarcinoma (NCCIT cells) in the following experi-
ments because the cell viability and growth were unaf-
fected by 2DG treatment (Fig. 5A). As expected, 2DG
treatment for 1 week strongly suppressed Gb3S expres-
sion (Fig. 5B). The mRNA expression of other major
glycolipid synthase genes, such as GM3 (Neu-
Aca2,3LacCer) synthase [25] and b1,4-galactosyltrans-
ferase 6, which is a LacCer synthase [26], were
unaffected by 2DG treatment. Next, we examined the
GSL components in NCCIT cells before and after
treatment with 2DG. TLC analysis showed that the
major neutral GSL of the NCCIT cell was Gb3
(Fig. 6B). After 2DG treatment, the level of Gb3
markedly decreased, which was followed by an accu-
mulation of LacCer and the appearance of another
GSL (Fig. 6A, asterisk). Based on the HPLC elution
time (Fig. 6B, asterisk), it seems that the newly
Fig. 5. The effects of 2DG on NCCIT cells. (A) The number of via-
ble (squares with full lines) and dead (circles with dotted lines) cells
after treatment or not with 2DG (10 m
M) for the indicated days
(1, 2, 4 and 7 days). Filled squares and circles, nontreated cells;
open squares and circles, 2DG-treated cells. Error bars,
mean ± SD, n = 4. (B) RT-PCR analysis of glycolipid synthase gene
mRNA expression in NCCIT cells treated with (+) or without ())
2DG (10 m
M) for 1 week. Expression of GAPDH mRNA in the cells
was monitored as an internal control. Gb3S, Gb3 synthase;
B4GalT6, b1,4-galactosyltransferase 6; GM3S, GM3 synthase.
T. Okuda et al. A novel strategy for the inhibition of glycosphingolipid biosynthesis
FEBS Journal 276 (2009) 5191–5202 ª 2009 The Authors Journal compilation ª 2009 FEBS 5195
generated GSL is the amino-CTH [lactotriaosylcera-
mide (Lc3, GlcNAc b1,3LacCer) or asialo-GM2 (Gal-
NAcb1,4LacCer)]. To determine the expression levels
of each of the GSLs, we carried out semi-quantitative
HPLC analyses (Fig. 6B). The results are shown in
Table 1. The cellular Gb3 levels were reduced by
approximately 40% after 2DG treatment, and then its
derivative globotetraosylceramide (Gb4) became unde-
tectable. By contrast, the level of the Gb3 precursor
LacCer increased 3.5-fold after 2DG treatment. More-
over, 2DG resulted in increased levels of amino-CTH,
which is synthesized from LacCer by enzymes other
than Gb3S. Although gangliosides were a minor com-
ponent compared with neutral GSLs in NCCIT cells,
HPLC analysis also detected these compounds (Fig. 7).
GM3 was found to be a major ganglioside in NCCIT
Fig. 6. Neutral GSL analysis of 2DG-treated NCCIT cells. (A) TLC analysis for neutral glycolipids from NCCIT cells, visualized by orcinol–
H
2
SO
4
. Lane 1, standard neutral glycolipids, lane 2, glycolipids from NCCIT cells; lane 3, glycolipids from 2DG-treated NCCIT cells. The
experiment was performed with a solvent system consisting of chloroform–methanol–water (60 : 35 : 8, v ⁄ v ⁄ v). Asterisk indicates a newly
appeared GSL. (B) HPLC analysis of neutral GSL-derived oligosaccharides. Oligosaccharides released from neutral GSLs by endoglycocerami-
dase were labeled with the fluorescent compound 2-AA and analyzed using an HPLC system, as described in Experimental procedures.
GSLs were purified from NCCIT cells (top panel) or 2DG-treated (10 m
M, 7 days) NCCIT cells (bottom panel). The elution positions of stan-
dard 2-AA-labeled oligosaccharides, which were generated from commercially available GSLs (1, LacCer; 2, Gb3; 3, Gb4; 4, GA1), are shown
as arrowheads. Asterisk indicates estimated elution areas of amino-CTH.
Table 1. The composition of neutral GSL in NCCIT cells before and
after 2DG treatment. The relative expression level of each GSL-
derived oligosaccharide is represented as a ratio of the LacCer level
in nontreated cells. Each value is shown as a mean of two indepen-
dent experiments.
GSL
Relative expression level
Nontreated 2DG-treated
LacCer 1.00 3.47
Amino-CTH 0.21 1.49
Gb3 3.24 1.94
Gb4 0.19 0.03
Others 0.33 0.49
Fig. 7. HPLC analysis of GSL-derived oligosaccharides of NCCIT
cells. Oligosaccharides released from gangliosides by endoglyco-
ceramidase were labeled with the fluorescent compound 2-AA and
analyzed using an HPLC system as described in Experimental
procedures. Gangliosides were purified from NCCIT cells (middle
panel) or 2DG-treated (10 m
M, 7 days) NCCIT cells (bottom panel).
The elution pattern of standard 2-AA-labeled oligosaccharides,
which were generated from commercially available GSLs (arrow-
heads: 1, LacCer; 2, GM3; 3, GM2; 4, GA1; 5, GM1; 6, GD1a; 7,
GD1b; 8, GT1b), are shown in the top panel. Only the elution pat-
tern of GM3-derived oligosaccharide was detected as a double
peak. This result is presumably derived from the difference in the
molecular species of sialic acid in the GM3 oligosaccharide.
A novel strategy for the inhibition of glycosphingolipid biosynthesis T. Okuda et al.
5196 FEBS Journal 276 (2009) 5191–5202 ª 2009 The Authors Journal compilation ª 2009 FEBS
cells, and some complex-type gangliosides were also
detected. After 2DG treatment, increased expression of
GM3, GM2 [GalNAcb1,4(NeuAca2,3)LacCer] and
GM1 [Galb1,3GalNAcb1,4(NeuAca2,3)LacCer] was
detected. We also detected a slight decrease in the level
of some complex gangliosides following treatment with
2DG. These changes are summarized in Table 2.
From these observations, we concluded that 2DG
treatment inhibits cellular Gb3 synthesis through the
transcriptional inhibition of Gb3S, but the effect is
considerably restricted to Gb3 in GSL synthesis of
NCCIT cells.
The effects of 2DG on the cell surface expression
of Gb3 in ECs
Recent studies have demonstrated that inflammation-
induced Gb3 expression on the cell surface of ECs is
closely related to the onset of HUS in O157-infected
patients [8,9]. In particular, enhancement of Gb3
expression levels by cytokine stimulation in ECs is
considered as a progression step to HUS in O157-
infected patients.
We found that Gb3 expression on the cell surface
could be detected in primary cultured human umbilical
vein endothelial cells (HUVECs) by flow cytometric
analysis using a Gb3-specific monoclonal antibody
(mAb) 52, which is enhanced by TNF-a stimulation
(Fig. 8). Using this model, we examined whether 2DG
could control Gb3 expression. We treated HUVEC
with 10 mm of 2DG for 24 h with or without TNF-a
stimulation. In both cases, 2DG treatment significantly
suppressed the cell surface Gb3 expression at
constantly low levels.
Discussion
We have established a simple and convenient method
for screening inhibitors of Gb3 biosynthesis by
employing a Gb3S promoter assay. Using this proce-
dure, we successfully identified a glucose analogue
2DG as a candidate inhibitor. Furthermore, we found
that 2DG treatment strongly repressed Gb3S transcrip-
tion and decreased the Gb3 content in the cells. Con-
versely, 2DG caused an increase in the level of the
Gb3 precursor lactosylceramide and other neutral
glyocolipids in the NCCIT teratocarcinoma cell line. A
similar result was found by analyzing the glycolipid
composition of genetically engineered Gb3S null mice
tissues [10]. These results are entirely consistent with
the concept that a reduction in cellular Gb3 content is
a result of the inhibitory effect of 2DG on Gb3S tran-
scription. The expression of gangliosides, although a
Table 2. The composition of gangliosides in NCCIT cells before
and after 2DG treatment. The relative expression level of each
GSL-derived oligosaccharide is represented as a ratio of the LacCer
level in nontreated cells. ND, not detected.
GSL
Relative expression level
Nontreated 2DG-treated
GM3 0.12 0.15
GM2 0.03 0.08
GM1 ND 0.02
GD1a 0.04 0.02
GD1b 0.08 0.01
Others 0.15 0.05
Fig. 8. Gb3 expression on the surface of HUVEC. (A) Flow cytomet-
ric analysis of HUVEC stained by mAb 52. The cell surface Gb3 was
stained with primary mouse monoclonal anti-Gb3 IgG3 52 (mAb 52)
and FITC-labeled secondary antibody (thin line) before (untreated) or
after treatment for 24 h with 10 m
M 2DG (2DG), 20 ngÆmL
)1
TNF-a
(TNF) or both (TNF + 2DG). These negative controls were prepared
by primary treatment with control mouse IgG and secondary
FITC-labeled antibody (thin line with dark shading). The numbers of
mAb 52-stained HUVEC in the marked areas (M) are shown in (B) as
the percentage of total cells (Gb3-positive cells). Error bars,
mean ± SE, n = 4, from two independent experiments. *P < 0.05.
T. Okuda et al. A novel strategy for the inhibition of glycosphingolipid biosynthesis
FEBS Journal 276 (2009) 5191–5202 ª 2009 The Authors Journal compilation ª 2009 FEBS 5197
minor glycolipid component of NCCIT cells, was
detectable by HPLC analysis (Fig. 7). Indeed, our
results showed that 2DG treatment also affected the
expression levels of gangliosides in the NCCIT cells.
Moreover, an increase in the expression of GM3 and
its derivatives results in a slight decrease in the ratio of
some complex-type gangliosides. These alterations are
mainly caused by the increased expression of GM3 as
a result of the accumulation of its precursor LacCer.
From these observations, we concluded that the sup-
pressive effect of 2DG is substantially targeted towards
the synthesis of Gb3 or its derivatives in NCCIT cells.
2DG, a nonmetabolizable glucose analogue, acts as
a glycolytic inhibitor by inhibiting glucose hexokinase.
Thus, 2DG has frequently been used as a glucose star-
vation mimetic. Recently, its repressive effect on gene
transcription has been reported [16,20,21], and some of
the mechanisms have already been investigated [16,21].
For example, 2DG treatment reduces the expression of
brain-derived neurotrophic factor (BDNF) and its
receptor TrkB by generating a repressive chromatin
environment around the BDNF promoter [21]. This
event is caused by glycolytic inhibition stress, because
other glycolytic inhibitors, such as citrate or pyruvate,
also reduce BDNF promoter activity. The repressive
effect of 2DG on the Gb3S promoter was not dis-
played by other glycolytic inhibitors (Fig. 3). Thus,
2DG presumably regulates the Gb3S promoter in a dif-
ferent way to that of other inhibitors of the BDNF
promoter. In addition, it has been reported that one of
the mechanisms for generating a repressive chromatin
environment by 2DG is the activation of the class III
histone deacetylase SIRT1 [22]. We examined the
effects of SIRT1 inhibitors on the 2DG-decreased
reporter activity of HML-Gb3 cells. However, we were
unable to detect any changes in the reporter activity of
these cells (Fig. 3).
It has also been reported that 2DG [16], as well as
streptozotocin [17] and high glucose treatment [18,19],
enhances O-GlcNAc modification of the transcrip-
tional factor Sp1, thereby reducing its transcriptional
capability [17]. Previously, we have identified the Sp1
protein as a key regulator for the Gb3S promoter [11].
Thus, we expected that the inhibitory effect of 2DG
on the Gb3S promoter would be controlled in this
manner. However, we could not detect any changes in
the Gb3S promoter activity after treatment with high
glucose or streptozotocin (Fig. 3). Even mithra-
mycin A, which directly inhibits the binding between
Sp1 and its consensus DNA sequence [14,15], did not
show an inhibitory effect (Fig. 3). Our results raise the
possibility that 2DG indirectly down-regulates Gb3S
transcription through the interaction between the Sp1
and Gb3S promoter. Previously, it has been reported
that Gb3S transcription is up-regulated in mega-
karyoblastic leukemia during phorbol 12-myristate 13-
acetate (TPA)-induced differentiation [27]. TPA is a
strong inducer for the transcription of several genes,
which are controlled by TPA response elements
(TREs). As TRE is absent from the transcriptional
regulatory domain of Gb3S [11], TPA-induced up-reg-
ulation of Gb3S should be regulated by TRE-induced
gene products. 2DG treatment also induces various
changes in the expression levels of several genes, which
suggests that 2DG suppresses Gb3S transcription
through a very complicated process.
In this study, we could not elucidate the precise
silencing mechanism of the Gb3S gene by 2DG. We
are currently investigating the means by which 2DG
regulates the Gb3S promoter.
Several reports have indicated that inflammatory
mediators, such as LPS and cytokines, enhance the
expression level of Gb3 on the EC surface [8,9]. It is
known that Gb3 is the sole receptor for verotoxin
in vivo [10] and that HUS is caused by verotoxin-
induced damage to ECs. Thus, the enhancement of
Gb3 expression on ECs by cytokines induced by
E. coli infection is considered as a progression step for
the onset of HUS in O157-infected patients. In this
study, we demonstrated that 2DG could suppress Gb3
expression on the surface of ECs even after TNF-a
stimulation (Fig. 8). It has been considered that this
event is based on the up-regulation of Gb3S gene
mRNA expression. Although we could not detect any
enhancement of Gb3S promoter activity by TNF-a
treatment (Fig. 3), increased Gb3 expression in ECs
was able to suppress the effect of 2DG treatment. This
result indicates that basal Gb3S promoter activity is
needed for TNF-a to induce the expression of Gb3 in
ECs. Thus, the suppression of promoter activity may
be a method of preventing the progression of HUS in
O157-infected patients. Hence, the development of
a nontoxic inhibitor for the suppression of Gb3
promoter activity could be a useful treatment for HUS
in O157-infected patients.
Fabry disease is also a major target for this study.
In this disease, the accumulation of Gb3 is observed in
a number of tissues, which causes a systemic disorder
[5]. Because a genetic deficit of a-galactosidase A, a
Gb3 catabolic enzyme, is the cause of this disease,
enzyme replacement therapy is performed with a
recombinant a-galactosidase. Unfortunately, this ther-
apy is very costly because it uses a large amount
of recombinant enzyme. Thus, an alternative more
economical approach needs to be developed to treat
this condition.
A novel strategy for the inhibition of glycosphingolipid biosynthesis T. Okuda et al.
5198 FEBS Journal 276 (2009) 5191–5202 ª 2009 The Authors Journal compilation ª 2009 FEBS
Previously, a therapeutic strategy using small mole-
cular chaperones (1-deoxgalactonojirimycin) has been
proposed [28]. This chemical is able to increase resid-
ual enzyme activity by rescuing misfolded mutant
a-galactosidase protein from endoplasmic reticulum-
associated degradation. Such a therapeutic strategy is
anticipated to be effective for some Fabry disease
patients carrying missense mutations in the coding
region of the a-galactosidase A gene that lead to
misfolding of the mutant protein.
Direct blockade of neutral GSL synthesis by the
inhibition of multiple drug resistance protein 1
(MDR1) has also been proposed as a potential treat-
ment for Fabry disease [29]. MDR1 can translocate
glucosylceramide into the Golgi apparatus for neutral
GSL synthesis, including Gb3 [30]. A recent report has
shown that the inhibition of MDR1 by cyclosporin A
results in a reduction in Gb3 accumulation in several
tissues of a Fabry model mouse.
Reduction of Gb3 by substrate deprivation using a
synthetic inhibitor for glucosylceramide synthase has
also been proposed as a potential means of treating
Fabry disease [31]. This study reported a drastic reduc-
tion in Gb3 accumulation in Fabry model mice and
cell lines from Fabry disease patients [32] by treatment
with glucosylceramide synthase inhibitors.
There is, however, no abnormality in the genetic-
based deficient form of Gb3S in mice [10] or humans
[33,34]. We believe that specific inhibition of Gb3S
transcription by a chemical agent will be a primary
target for the treatment of Fabry disease with no asso-
ciated adverse effects. Although 2DG cannot be used
directly as a drug for the treatment of Gb3-related
diseases because of its intrinsic toxicity, modification
of the molecule promises to be a way forward. More-
over, the assay described in this report makes it possi-
ble to efficiently screen for further drug candidates to
combat this disease. We believe that the development
of the principles outlined in this study will bring about
the identification of molecules of therapeutic utility.
Experimental procedures
Cell culture
HeLa cells, provided by the RIKEN CELL BANK (Tsu-
kuba, Japan), were maintained in Dulbecco’s modified
Eagle’s minimal essential medium supplemented with 10%
fetal bovine serum. Human teratocarcinoma cells, NCCIT,
were obtained from the American Type Culture Collection
(Manassas, VA, USA), and were maintained in RPMI-1640
medium supplemented with 10% fetal bovine serum and
2mml-glutamine. HUVEC, purchased from KURABO
(Osaka, Japan), were maintained in HuMedia-EG2 (KU-
RABO). Passages 4–9 were used in these experiments.
When stimulated by TNF-a (PeproTech, Rocky Hill, NJ,
USA), 5 · 10
5
cells were seeded onto a culture dish
(100 mm in diameter) and then incubated for 24 h. After
incubation, medium was replaced with fresh HuMedia-EG2
containing 20 ngÆmL
)1
of TNF-a, and incubated for
another 24 h. All cells were cultured at 37 °C in a humidi-
fied atmosphere containing 5% CO
2
.
Construction of plasmids
The pMet-Luciferase (pML) reporter vector (Clontech,
Mountain View, CA, USA) was used for the reporter
assay. In order to improve the sensitivity of the reporter
assay, the background transcription was reduced by insert-
ing a synthetic transcriptional blocker into the 5¢-upstream
region of the multiple cloning site of this vector (Fig. 1A).
Specifically, the blocker was composed of adjacent poly-
adenylation and transcription pause sites [35]. The
promoter region of the Gb3S gene was amplified by PCR
using HeLa cell genomic DNA as a template. The follow-
ing PCR primers were used: 5¢-TGAGTCGACTCAG
CTCTTGGAGGGGCAACA-3¢ and 5¢-GCGCGCACAAA
TGTCGCCTCCAGAACA-3¢. The amplified product was
then digested with SalI and BamHI and subcloned into
the corresponding recognition sites of the pML vector.
This DNA insert comprised the )1893 bp to +84 bp
region of the 5¢-flanking region of the Gb3S gene, as
reported previously [11]. All PCR experiments were per-
formed using PrimeSTAR HS DNA polymerase (Takara
Bio, Shiga, Japan). The DNA insert in each plasmid
construct was verified by sequencing.
Establishment of stable transfectants and the
luciferase assay
An aliquot of 0.4 lg of each plasmid was transfected into
2 · 10
5
HeLa cells with lipofectamine2000 (Invitrogen,
Carlsbad, CA, USA) according to the manufacturer’s
instructions. To establish stable mutants, these cells were
incubated for 2 weeks in the presence of 400 lgÆmL
)1
of
G418. The G418-resistant clones were subsequently isolated.
For the luciferase assay, transient or stable transfectants
were incubated with 500 lL of culture medium for 16 h in a
24-well (15.49 mm diameter) cell culture plate. In this assay,
the reporter protein (luciferase) was secreted into the culture
medium. A 50 lL aliquot of culture medium from each
transfectant was used to measure luciferase activity. The
luciferase activity was measured using the Ready-To-GlowÔ
Secreted Luciferase Reporter Assay kit (Clontech) and Lumi-
nescencer JNRII (ATTO, Tokyo, Japan). 2DG, streptozoto-
cin and mithramycin A (Sigma-Aldrich, St Louis, MO,
USA) were diluted with culture medium, and added to the
T. Okuda et al. A novel strategy for the inhibition of glycosphingolipid biosynthesis
FEBS Journal 276 (2009) 5191–5202 ª 2009 The Authors Journal compilation ª 2009 FEBS 5199
cells 4 h after seeding. After a further 16 h, the culture
medium was collected and analyzed for luciferase activity.
Cell lysates for measuring the intracellular luciferase
activity were prepared as follows. The cells in each well
were lysed with 100 lL of lysis buffer containing 1%
NP-40, 0.5% sodium deoxycholate, 0.1% SDS, 0.1 mm
phenylmethylsulfonyl fluoride and a proteinase inhibitor
cocktail (Complete mini EDTA-freeÔ; Roche, Penzberg,
Germany) in NaCl ⁄ P
i
.
Cell viability assays
HML-Gb3 (2 · 10
5
) or NCCIT (1 · 10
5
) cells were seeded
into a 24-well plate in culture medium with or without
10 mm 2DG. After the indicated culture time (shown in
Figs 4D, 5A), the cells were harvested and 0.1 vol of 0.4%
(w ⁄ v) trypan blue was added to the cell suspension. The
number of stained and unstained cells was then determined
using a hemocytometer.
RT-PCR
RT-PCR analysis of the Gb3S gene was carried out accord-
ing to the previously reported method [13] with some modi-
fications. Total RNA was isolated using Trizol reagent
(Invitrogen) from NCCIT cells before and after treatment
with 10 mm 2DG. The amplification of the target gene
cDNA was carried out using gene-specific primers and a
SuperScriptÔ One-Step RT-PCR System with PlatinumÔ
Taq DNA polymerase (Invitrogen), according to the manu-
facturer’s instructions. Briefly, total mRNA (0.5 lg) and
forward and reverse primers (5 pmol each) were mixed with
SuperScriptÔ RT ⁄ Platinum Taq Mix (0.5 lL) in reaction
buffer (25.0 lL) containing dNTP (0.2 mm) and MgSO
4
(1.2 mm) in distilled water, and these were reacted in a ther-
mal cycler. The reactions were performed using the follow-
ing conditions: 55 °C for 30 min, 94 °C for 2 min, and then
40 cycles [for Gb3S, b1,4-galactosyltransferase 6 (B4GalT6)
and GM3 synthase (GM3S)] or 25 cycles [for glyceralde-
hyde-3-phosphate dehydrogenase (GAPDH)] of 94 °C for
15 s, 59 °C for 30 s and 72 °C for 30 s, with a final exten-
sion of 72 °C for 5 min. For the amplification of Gb3S
cDNA, the sense primer 5¢-TGGAAGTTCGGCGGCATC
TA-3¢ and the antisense primer 5¢-CAGGGGGC
AGGGTGGTGACG-3¢ were used. The PCR products cor-
responded to nucleotides +550 to +844 of the ORF region
of the Gb3S gene. For amplification of B4GalT6, GM3S
and GAPDH cDNA, the following primers were used: for
B4GalT6, the forward primer 5¢-TGAACAGACTGGCA
CACAACC-3¢ and the reverse primer 5¢-TGTCAGCCC
ACTTACACCAC-3¢; for GM3S, the forward primer 5¢-
CGTCCCCACAATCGGTGTCA-3¢ and the reverse primer
5¢-ACCACTCCCTCTTTGACCAG-3¢; for GAPDH, the
forward primer 5¢-CCACCCATGGCAAATTCCATGGCA
-3¢ and the reverse primer 5¢-TCTAGACGGCAGGT
CAGGTCCACC-3¢. The PCR products were analyzed by
agarose gel electrophoresis (1.5% gel) and the DNA was
visualized using ethidium bromide under UV illumination.
Glycolipid extraction and TLC analysis
Glycolipid extraction and TLC immunostaining were per-
formed as reported previously [11]. Briefly, total lipids from
1 · 10
7
cells were sequentially extracted with chloroform–
methanol–water 2 : 1 : 0 and 1 : 2 : 0.8 (v ⁄ v ⁄ v), respec-
tively. Gangliosides and neutral glycolipids were separated
by column chromatography using DEAE Sephadex A-25
(Sigma-Aldrich) and Iatrobeads 6RS-8060 (Mitsubishi
Kagaku Iatron, Tokyo, Japan), respectively. Purified glycol-
ipids were analyzed on HPTLC plates (Merck, Darmstadt,
Germany) with a solvent system consisting of chloroform–
methanol–water (60 : 35 : 8, v ⁄ v ⁄ v). Glycolipids were
visualized by orcinol–H
2
SO
4
.
HPLC analysis
Semi-quantitative analysis of GSLs was carried out by
HPLC using a published carbohydrate fluorescent labeling
method for GSLs described by Neville et al. [36] with slight
modifications. Neutral GSLs from 1 · 10
6
cells or ganglio-
side from 2 · 10
6
cells or 10 lg of GSL standards in chloro-
form–methanol (2 : 1, v ⁄ v) were evaporated to dryness in a
glass vial. The carbohydrate moieties were then digested by
the addition of 4 mU of recombinant endoglycocera-
midase II (Takara Bio) and incubation at 37 °C for 16 h in
10 lLof50mm sodium acetate buffer (pH 5.0) containing
1mgÆmL
)1
sodium cholate. The liberated oligosaccharide
was fluorescently labeled using anthranilic acid (2-AA;
Sigma-Aldrich). Samples were sequentially mixed with 80 lL
of labeling mixture (30 mgÆmL
)1
2-AA, 40 mgÆmL
)1
sodium
acetate trihydrate, 20 mgÆmL
)1
boric acid and 45 mgÆmL
)1
sodium cyanoborohydride in methanol) and incubated at
80 °C for 1 h. Labeled oligosaccharides were purified using a
discovery DPA-6S column (Supelco, Poole, UK) and ana-
lyzed using a TSK gel-amide 80 column (Tosoh, Tokyo,
Japan) and the HPLC system LC Module I plus (Waters,
Milford, MA, USA). The chromatography system and fluo-
rescence detection ⁄ gradient conditions were identical to
those described in the published methodology [36].
Flow cytometric analysis
Expression of Gb3 on the cell surface was analyzed by flow
cytometry. After treatment with 20 ngÆmL
)1
TNF-a or
10 mm 2DG, cells were harvested in 0.05% trypsin–EDTA
solution. Approximately 1 · 10
6
cells were then suspended
in 100 lL of cold NaCl ⁄ P
i
. The suspensions were incubated
with 1 lg mouse monoclonal anti-Gb3 IgG3 52 (mAb 52)
(Y. Kondo et al., unpublished results) on ice, and were
A novel strategy for the inhibition of glycosphingolipid biosynthesis T. Okuda et al.
5200 FEBS Journal 276 (2009) 5191–5202 ª 2009 The Authors Journal compilation ª 2009 FEBS
sequentially labeled with fluorescein isothiocyanate (FITC)-
conjugated rat monoclonal anti-mouse-IgG3 IgG2a R40-82
(BD Biosciences, San Jose, CA, USA). The labeled cells
were analyzed using a flow cytometer (FACS CaliburÔ;
BD Biosciences). Statistical analysis was performed by
Student’s t-test.
References
1 Hakomori S (2008) Structure and function of glycos-
phingolipids and sphingolipids: recollections and future
trends. Biochim Biophys Acta 1780, 325–346.
2 Hakomori S, Siddiqui B, Li YT, Li SC & Hellerqvist
CG (1971) Anomeric structure of globoside and
ceramide trihexoside of human erythrocytes and
hamster fibroblasts. J Biol Chem 246, 2271–2277.
3 Marcus DM, Kundu SK & Suzuki A (1981) The P
blood group system: recent progress in immunochemis-
try and genetics. Semin Hematol 18, 63–71.
4 Wiels J, Fellous M & Tursz T (1981) Monoclonal
antibody against a Burkitt lymphoma-associated
antigen. Proc Natl Acad Sci USA 78, 6485–6488.
5 Clarke JT (2007) Narrative review: Fabry disease. Ann
Intern Med 146, 425–433.
6 Jacewicz M, Clausen H, Nudelman E, Donohue-Rolfe
A & Keusch GT (1986) Pathogenesis of shigella diar-
rhea. XI. Isolation of a shigella toxin-binding glycolipid
from rabbit jejunum and HeLa cells and its identifica-
tion as globotriaosylceramide. J Exp Med 163,
1391–1404.
7 Lingwood CA, Law H, Richardson S, Petric M,
Brunton JL, De Grandis S & Karmali M (1987)
Glycolipid binding of purified and recombinant
Escherichia coli produced verotoxin in vitro. J Biol
Chem 262, 8834–8839.
8 van de Kar NC, Monnens LA, Karmali MA & van
Hinsbergh VW (1992) Tumor necrosis factor and inter-
leukin-1 induce expression of the verocytotoxin receptor
globotriaosylceramide on human endothelial cells:
implications for the pathogenesis of the hemolytic
uremic syndrome. Blood 80, 2755–2764.
9 Obrig TG, Louise CB, Lingwood CA, Boyd B, Barley-
Maloney L & Daniel TO (1993) Endothelial heterogene-
ity in Shiga toxin receptors and responses. J Biol Chem
268, 15484–15488.
10 Okuda T, Tokuda N, Numata S, Ito M, Ohta M,
Kawamura K, Wiels J, Urano T, Tajima O,
Furukawa K et al. (2006) Targeted disruption of
Gb3 ⁄ CD77 synthase gene resulted in the complete
deletion of globo-series glycosphingolipids and loss of
sensitivity to verotoxins. J Biol Chem 281, 10230–
10235.
11 Okuda T & Nakayama K (2008) Identification and
characterization of the human Gb3 ⁄ CD77 synthase
gene promoter. Glycobiology 18, 1028–1035.
12 Markova SV, Golz S, Frank LA, Kalthof B & Vysotski
ES (2004) Cloning and expression of cDNA for a
luciferase from the marine copepod Metridia longa. A
novel secreted bioluminescent reporter enzyme. J Biol
Chem 279, 3212–3217.
13 Iwamura K, Furukawa K, Uchikawa M, Sojka BN,
Kojima Y, Wiels J, Shiku H, Urano T & Furukawa K
(2003) The blood group P1 synthase gene is identical to
the Gb3 ⁄ CD77 synthase gene. A clue to the solution of
the P1 ⁄ P2 ⁄ p puzzle. J Biol Chem 278, 44429–44438.
14 Ray R, Snyder RC, Thomas S, Koller CA & Miller
DM (1989) Mithramycin blocks protein binding and
function of the SV40 early promoter. J Clin Invest 83,
2003–2007.
15 Blume SW, Snyder RC, Ray R, Thomas S, Koller CA
& Miller DM (1991) Mithramycin inhibits SP1 binding
and selectively inhibits transcriptional activity of the
dihydrofolate reductase gene in vitro and in vivo. J Clin
Invest
88, 1613–1621.
16 Kang HT, Ju JW, Cho JW & Hwang ES (2003)
Down-regulation of Sp1 activity through modulation of
O-glycosylation by treatment with a low glucose
mimetic, 2-deoxyglucose. J Biol Chem 278, 51223–
51231.
17 Yang X, Su K, Roos MD, Chang Q, Paterson AJ &
Kudlow JE (2001) O-linkage of N-acetylglucosamine to
Sp1 activation domain inhibits its transcriptional capa-
bility. Proc Natl Acad Sci USA 98, 6611–6616.
18 Walgren JL, Vincent TS, Schey KL & Buse MG (2003)
High glucose and insulin promote O-GlcNAc modifica-
tion of proteins, including alpha-tubulin. Am J Physiol
Endocrinol Metab 284, E424–E434.
19 Clark RJ, McDonough PM, Swanson E, Trost SU,
Suzuki M, Fukuda M & Dillmann WH (2003) Diabe-
tes and the accompanying hyperglycemia impairs
cardiomyocyte calcium cycling through increased
nuclear O-GlcNAcylation. J Biol Chem 278,
44230–44237.
20 Maehama T, Patzelt A, Lengert M, Hutter KJ,
Kanazawa K, Hausen H & Ro
¨
sl F (1998) Selective
down-regulation of human papillomavirus transcription
by 2-deoxyglucose. Int J Cancer 76, 639–646.
21 Garriga-Canut M, Schoenike B, Qazi R, Bergendahl K,
Daley TJ, Pfender RM, Morrison JF, Ockuly J,
Stafstrom C, Sutula T et al. (2006) 2-Deoxy-D-glucose
reduces epilepsy progression by NRSF-CtBP-dependent
metabolic regulation of chromatin structure. Nat
Neurosci 9, 1382–1387.
22 Zhang Q, Wang SY, Fleuriel C, Leprince D, Rocheleau
JV, Piston DW & Goodman RH (2007) Metabolic
regulation of SIRT1 transcription via a HIC1:CtBP
corepressor complex. Proc Natl Acad Sci USA 104,
829–833.
23 Bitterman KJ, Anderson RM, Cohen HY, Latorre-
Esteves M & Sinclair DA (2002) Inhibition of silencing
T. Okuda et al. A novel strategy for the inhibition of glycosphingolipid biosynthesis
FEBS Journal 276 (2009) 5191–5202 ª 2009 The Authors Journal compilation ª 2009 FEBS 5201
and accelerated aging by nicotinamide, a putative nega-
tive regulator of yeast sir2 and human SIRT1. J Biol
Chem 277, 45099–45107.
24 Smith RA & Baglioni C (1989) Multimeric structure of
the tumor necrosis factor receptor of HeLa cells. J Biol
Chem 264, 14646–14652.
25 Ishii A, Ohta M, Watanabe Y, Matsuda K, Ishiyama
K, Sakoe K, Nakamura M, Inokuchi J, Sanai Y &
Saito M (1998) Expression cloning and functional char-
acterization of human cDNA for ganglioside GM3
synthase. J Biol Chem 273, 31652–31655.
26 Nomura T, Takizawa M, Aoki J, Arai H, Inoue K,
Wakisaka E, Yoshizuka N, Imokawa G, Dohmae N,
Takio K et al. (1998) Purification, cDNA cloning, and
expression of UDP-Gal: glucosylceramide beta-
1,4-galactosyltransferase from rat brain. J Biol Chem
273, 13570–13577.
27 Furukawa K, Yokoyama K, Sato T, Wiels J, Hirayama
Y, Ohta M & Furukawa K (2002) Expression of the
Gb3 ⁄ CD77 synthase gene in megakaryoblastic leukemia
cells: implication in the sensitivity to verotoxins. J Biol
Chem 277, 11247–11254.
28 Fan JQ, Ishii S, Asano N & Suzuki Y (1999) Acceler-
ated transport and maturation of lysosomal
alpha-galactosidase A in Fabry lymphoblasts by an
enzyme inhibitor. Nat Med 5, 112–115.
29 Mattocks M, Bagovich M, De Rosa M, Bond S,
Binnington B, Rasaiah VI, Medin J & Lingwood C
(2006) Treatment of neutral glycosphingolipid lysosomal
storage diseases via inhibition of the ABC drug trans-
porter, MDR1. Cyclosporin A can lower serum and
liver globotriaosyl ceramide levels in the Fabry mouse
model. FEBS J 273, 2064–2075.
30 De Rosa MF, Sillence D, Ackerley C & Lingwood C
(2004) Role of multiple drug resistance protein 1 in
neutral but not acidic glycosphingolipid biosynthesis.
J Biol Chem 279, 7867–7876.
31 Abe A, Gregory S, Lee L, Killen PD, Brady RO,
Kulkarni A & Shayman JA (2000) Reduction of
globotriaosylceramide in Fabry disease mice by
substrate deprivation. J Clin Invest 105, 1563–1571.
32 Abe A, Arend LJ, Lee L, Lingwood C, Brady RO &
Shayman JA (2000) Glycosphingolipid depletion
in Fabry disease lymphoblasts with potent inhibitors
of glucosylceramide synthase. Kidney Int 57,
446–454.
33 Steffensen R, Carlier K, Wiels J, Levery SB, Stroud
M, Cedergren B, Nilsson Sojka B, Bennett EP, Jersild
C & Clausen H (2000) Cloning and expression of the
histo-blood group Pk UDP-galactose: Galb1-4Glcb1-
Cera1,4-galactosyltransferase. Molecular genetic
basis of the p phenotype. J Biol Chem 275,
16723–16729.
34 Furukawa K, Iwamura K, Uchikawa M, Sojka BN,
Wiels J, Okajima T, Urano T & Furukawa K (2000)
Molecular basis for the p phenotype. Identification of
distinct and multiple mutations in the a1,4-galactosyl-
transferase gene in Swedish and Japanese individuals.
J Biol Chem 275, 37752–37756.
35 Eggermont J & Proudfoot NJ (1993) Poly(A) signals
and transcriptional pause sites combine to prevent
interference between RNA polymerase II promoters.
EMBO J 12, 2539–2548.
36 Neville DC, Coquard V, Priestman DA, te Vruchte DJ,
Sillence DJ, Dwek RA, Platt FM & Butters TD (2004)
Analysis of fluorescently labeled glycosphingolipid-
derived oligosaccharides following ceramide glycanase
digestion and anthranilic acid labeling. Anal Biochem
331, 275–282.
A novel strategy for the inhibition of glycosphingolipid biosynthesis T. Okuda et al.
5202 FEBS Journal 276 (2009) 5191–5202 ª 2009 The Authors Journal compilation ª 2009 FEBS