SECURING A HEALTHY FUTURE - The Commonwealth Fund State Scorecard on Child Health System Performance, 2011 doc
Bạn đang xem bản rút gọn của tài liệu. Xem và tải ngay bản đầy đủ của tài liệu tại đây (3.97 MB, 92 trang )
SECURING A HEALTHY FUTURE
The Commonwealth Fund
State Scorecard on Child Health
System Performance, 2011
Sabrina K. H. How, Ashley-Kay Fryer, Douglas McCarthy,
Cathy Schoen, and Edward L. Schor
February 2011
Photo Credits
Front cover top: Fotosearch. Front cover middle and bottom, pages 2 and 4: Dwight Cendrowski. Page 8: Bill Gallery.
ABSTRACT
The State Scorecard on Child Health System Performance, 2011, examines
states’ performance on 20 key indicators of children’s health care access,
affordability of care, prevention and treatment, the potential to lead healthy
lives, and health system equity. The analysis finds wide variation in performance
across states. If all states achieved benchmark performance levels, 5 million
more children would be insured, 10 million more would receive at least one
medical and dental preventive care visit annually, and nearly 9 million more
would have a medical home. The findings demonstrate that federal and state
policy actions maintained and, in some cases, expanded children’s insurance
coverage during the recent recession, even as many parents lost coverage. The
report also highlights the need for initiatives specifically focused on improving
health system performance for children. The report includes state-by-state
insurance coverage projections for children once relevant provisions of the
Affordable Health Act are implemented.
Support for this research was provided by The Commonwealth Fund. The views presented here are
those of the authors and not necessarily those of The Commonwealth Fund or its directors, officers,
or staff. This and other Fund publications are available online at www.commonwealthfund.org. To
learn more about new publications when they become available, visit the Fund’s Web site and register
to receive e-mail alerts. Commonwealth Fund pub. no. 1468.
Sabrina K. H. How, Ashley-Kay Fryer, Douglas McCarthy,
Cathy Schoen, and Edward L. Schor
February 2011
SECURING A HEALTHY FUTURE
The Commonwealth Fund
State Scorecard on Child Health
System Performance, 2011
5 List of Exhibits
6 About the Authors
7 Acknowledgments
9 Executive Summary
14 Highlight: Iowa
20 Introduction
21 What the
Scorecard
Measures
22 Access and Affordability
25 Highlight: Alabama
31 Prevention and Treatment
34 Highlight: Colorado
36 Highlight: North Carolina
38 Highlight: Massachusetts
40 Highlight: Cincinnati, Ohio
41 Children’s Potential to Lead Healthy Lives
44 Highlight: Minnesota
47 Equity
54 Impact of Improved Performance
55 Policy Implications: Moving Forward to Improve Children’s Health, Access,
and Care Experiences and Address Costs Concerns
58 Highlight: Oregon
60 Conclusion
62 Notes
67 Appendices
88 Further Reading
LIST OF EXHIBITS
EXHIBIT 1 Indicators of State Child Health System Performance
EXHIBIT 2 State Scorecard Summary of Child Health SystemPerformance Across Dimensions
EXHIBIT 3 State Ranking on Child Health System Performance
Access and Affordability
EXHIBIT 4 State Ranking on Access and Affordability Dimension
EXHIBIT 5 Percent of Children Ages 0–18 Uninsured by State
EXHIBIT 6 Percent of Parents Ages 19–64 Uninsured by State
EXHIBIT 7 Uninsured Rates and Medicaid/CHIP Income Eligibility Standards by State
EXHIBIT 8 Affordability of Health Insurance: Premiums for Employer-Based Family Coverage Relative to
Median Incomes for Family Households Under Age 65
EXHIBIT 9 State Ranking on Access and Affordability Dimension vs. Prevention and Treatment Dimension
Prevention and Treatment
EXHIBIT 10 State Ranking on Prevention and Treatment Dimension
EXHIBIT 11 State Variation: Medical Home and Preventive Care
EXHIBIT 12 State Initiatives to Advance Medical Homes in Medicaid/CHIP
EXHIBIT 13 State Rates of Hospital Admissions for Asthma Among Children, 2006
Healthy Lives
EXHIBIT 14 State Ranking on Potential to Lead Healthy Lives Dimension
EXHIBIT 15 Infant Mortality by State Deaths per 1,000 Live Births, 2006
EXHIBIT 16 State Rates on Infant Mortality and Low-Birthweight Babies
EXHIBIT 17 State Variation: Healthy Lives
Equity
EXHIBIT 18 Equity Dimension and Equity Type Ranking
EXHIBIT 19 Children Without a Medical Home by Income and Insurance
EXHIBIT 20 Children Without Both Preventive Medical and Dental Care Visits by Income and Insurance
EXHIBIT 21 Children with Oral Health Problems by Income and Insurance
Impact of Improved Performance
EXHIBIT 22 National Cumulative Impact if All States Achieved Top State Rate
Policy Implications
EXHIBIT 23 Post-Reform: Percent of Children Ages 0–18 Uninsured by State
EXHIBIT 24 Post-Reform: Percent of Parents Ages 19–64 Uninsured by State
6 Securing a Healthy Future: The Commonwealth Fund State Scorecard on Child Health System Performance, 2011
About the Authors
Sabrina K. H. How, M.P.A., is senior research
associate for the Commonwealth Fund’s Health
System Scorecard and Research Project, a three-
person research team based in Boston at the Institute
for Healthcare Improvement with responsibilities
for developing and producing national, state, and
substate regional analyses on health care system
performance. She also served in this capacity from
2006 until July 2010, when the project team was
created. Previously, Ms. How was a program associate
for the Fund’s former Health Care in New York City
and Medicare’s Future programs. Prior to joining the
Fund in 2002, she was a research associate for a
management consulting firm focused on the health
care industry. Ms. How holds a B.S. in biology from
Cornell University and an M.P.A. in health policy and
management from New York University.
Ashley-Kay Fryer is research associate for the
Commonwealth Fund’s Health System Scorecard and
Research Project, a three-person research team based
in Boston at the Institute for Healthcare Improvement
with responsibilities for developing and producing
national, state, and substate regional analyses
on health care system performance. She provides
research and writing support for the ongoing series of
national and state scorecard reports and new health
care market analyses and supports the work of the
team. Ms. Fryer joined the Fund in June 2009 as
the program assistant for Health System Quality and
Efficiency. Upon graduation from Harvard College
in 2008, she worked at J.P. Morgan Chase as an
investment banking equity sales analyst. Ms. Fryer
graduated cum laude from Harvard College with a
B.A. in a self-designed major, “The Determinants of
Population Health,” and a minor in health policy.
Douglas McCarthy, M.B.A., president of Issues
Research, Inc., in Durango, Colorado, is senior research
adviser to The Commonwealth Fund. He supports
the Commonwealth Fund Commission on a High
Performance Health System Scorecard and Research
Project, conducts case studies on high-performing
health care organizations, and is a contributing editor
to the Fund’s bimonthly newsletter, Quality Matters.
He has more than 20 years of experience working and
consulting for government, corporate, academic, and
philanthropic organizations in research, policy, and
operational roles, and has au thored or coauthored
reports and peer-reviewed articles on a range of
health care–related topics. Mr. McCarthy received
his bachelor’s degree with honors from Yale College
and a master’s degree in health care management
from the University of Connecticut. During 1996–
1997, he was a public policy fellow at the Hubert H.
Humphrey Institute of Public Affairs at the University
of Minnesota.
Cathy Schoen, M.S., is senior vice president for Policy,
Research, and Evaluation at The Commonwealth
Fund. Ms. Schoen is a member of the Fund’s
executive management team and research director
of the Fund’s Commission on a High Performance
Health System. Her work includes strategic oversight
and management of surveys, research, and policy
initiatives to track health system performance. From
1998 through 2005, she directed the Fund’s Task
Force on the Future of Health Insurance. Prior to
joining the Fund in 1995, Ms. Schoen taught health
economics at the University of Massachusetts School
of Public Health and directed special projects at the
UMASS Labor Relations and Research Center. During
the 1980s, she directed the Service Employees
International Union’s research and policy department.
In the late 1970s, she was on the staff of President
Carter’s national health insurance task force, where
she oversaw analysis and policy development. Prior
to federal service, she was a research fellow at the
Brookings Institution in Washington, D.C. She has
authored numerous publications on health policy
issues, insurance, and national/international health
system performance and coauthored the book, Health
and the War on Poverty. She holds an undergraduate
degree in economics from Smith College and a
graduate degree in economics from Boston College.
Edward L. Schor, M.D., is vice president of The
Commonwealth Fund, where he directs the State
Health Policy and Practices program. The goal of that
program is to help state leaders create the policies
www.commonwealthfund.org 7
and programs that will lead to higher health system
performance, especially for low-income populations,
emphasizing the integration of services to achieve
better coordination of care and efficiency. He
previously directed the Fund’s Child Development and
Preventive Care program. He is a pediatrician and
has held a number of positions in pediatric practice,
academic pediatrics, health services research, and
public health. Prior to joining The Commonwealth
Fund he was medical director for Family and
Community Health in the Iowa Department of Public
Health.
Acknowledgments
The authors owe sincere appreciation to Christina
Bethell, Ph.D., M.P.H., M.B.A., and her team at
the Child and Adolescent Health Measurement
Initiative for their thoughtful review and assistance
in interpreting data from the National Survey of
Children’s Health and National Survey of Children with
Special Health Care Needs. We thank Paul Fronstin,
Ph.D., at the Employee Benefit Research Institute, for
providing uninsured rates derived from the Current
Population Survey; Jonathan Gruber, Ph.D., and Ian
Perry at the Massachusetts Institute of Technology for
providing projected uninsured rates using the Gruber
Microsimulation Model; and Nicholas Tilipman,
Columbia University Mailman School of Public Health,
for programming support. We are especially grateful
to the Fund’s communications team, including Barry
Scholl, Chris Hollander, Martha Hostetter, Mary
Mahon, Christine Haran, Suzanne Barker Augustyn,
and Paul Frame, for their guidance, editorial and
production support, and public dissemination
efforts. The authors also wish to acknowledge the
Institute for Healthcare Improvement for its support
of the research unit, which enabled the analysis and
development of the report.
8 Securing a Healthy Future: The Commonwealth Fund State Scorecard on Child Health System Performance, 2011
www.commonwealthfund.org 9
EXECUTIVE SUMMARY
A child’s health, ability to participate fully
in school, and capacity to lead a productive,
healthy life depend on access to preventive and
eective health care—starting well before birth
and continuing throughout early childhood and
adolescence. Since healthy children are key to the
well-being and economic prosperity of families
and society, investing in child health has long been
a high priority for federal and state policy. is
State Scorecard on Child Health System Performance,
2011, nds that federal action to extend insurance
to children has made a critical dierence in
reducing the number of uninsured children across
states and maintaining children’s coverage during
the recent recession. However, the report also nds
that where children live and their parent’s incomes
signicantly aect their access to aordable
care, receipt of preventive care and treatment,
and opportunities to survive past infancy and
thrive. Better and more equitable results will
require improving the quality of children’s health
care across the continuum of their needs as well
as holding health care systems accountable for
preventing health problems and promoting health,
not just caring for children when they are sick or
injured.
e Scorecard’s ndings on children’s health
insurance attest to the pivotal role of federal and
state partnerships. Until the start of this decade,
the number of uninsured children had been rising
rapidly as the levels of employer-sponsored family
coverage eroded for low- and middle-income
families. is trend was reversed across the nation
as a result of state-initiated Medicaid expansions
and enactment and renewal of the Children’s
Health Insurance Program (CHIP). Currently,
Medicaid, CHIP, and other public programs fund
health care for more than one-third of all children
nationally. Children’s coverage has expanded in 35
states since the start of the last decade and held
steady even in the middle of a severe recession.
At the same time, coverage for parents—lacking
similar protection—deteriorated in 41 states.
With the goal of identifying opportunities
to improve, this Scorecard examines state
performance on 20 key health system indicators
for children clustered into three dimensions: access
and aordability, prevention and treatment, and
potential to lead healthy lives. It also examines
state performance by family income, insurance
status, and race/ethnicity to assess the equity of the
child health care system—the fourth dimension
of performance. e analysis ranks states and the
District of Columbia on each indicator and the
four dimensions. e analysis nds wide variation
in system performance, with often a two- to
threefold dierence across states, as illustrated in
Exhibit 1.
Benchmark levels set by leading states show
there are abundant opportunities to improve
health system performance to benet children. If
all states achieved top levels on each dimension
of performance, 5 million more children would
be insured and 10 million more children would
receive at least one medical and dental preventive
care visit per year. About six hundred thousand
more children ages 19 to 35 months would be
up to date on all recommended doses of six key
vaccines, and 370,000 fewer children with special
health care needs would have problems getting
referrals to specialty care services. Likewise, nearly
9 million additional children would have a medical
home to help coordinate their care.
e 14 states in the top quartile of the overall per-
formance ranking—Iowa, Massachusetts, Vermont,
10 Securing a Healthy Future: The Commonwealth Fund State Scorecard on Child Health System Performance, 2011
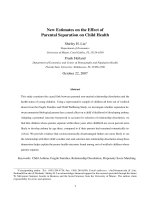
EXECUTIVE SUMMARY Exhibit 1
Indicators of State Child Health System Performance
Dimension and indicator Year
All
states
median
Range of
performance
(Bottom state
rate—Top
state rate) Best state
Access & Affordability
1 Children ages 0–18 insured 2008–09 91.4 82.0–96.7 MA
2 Parents ages 19–64 insured 2008–09 83.7 65.5–95.6 MA
3 Currently insured children whose health insurance
coverage is adequate to meet needs
2007 77.0 68.7–83.8 HI
4 Average total premium for employer-based family
coverage as percent of median income for family
household (all members under age 65)
2009 18.6 24.9–13.9 CT
Prevention & Treatment
5 Children with a medical home 2007 60.7 45.4–69.3 NH
6 Young children (ages 19–35 months) received all
recommended doses of six key vaccines
2009 74.4 64.6–84.1 IA
7 Children with a preventive medical care visit in the
past year
2007 87.8 76.7–97.7 RI
8 Children ages 1–17 with a preventive dental care visit
in the past year
2007 79.1 68.5–86.9 HI
9 Children ages 2–17 needing mental health treatment/
counseling who received mental health care in the
past year
2007 63.0 41.7–81.5 PA
10 Young children (ages 10 months–5 years) received
standardized developmental screening during visit
2007 18.8 10.7–47.0 NC
11 Hospital admissions for pediatric asthma per 100,000
children ages 2–17
2006 128.7 251.0–44.1 OR
12 Children with special health care needs who had no
problems receiving referrals when needed
2005–06 80.3 70.3–89.8 RI
13 Children with special health care needs whose families
received all needed family support services
2005–06 72.8 56.7–83.0 IN
Potential to Lead Healthy Lives
14 Infant mortality, deaths per 1,000 live births 2006 6.8 11.9–4.7 WA
15 Child mortality, deaths per 100,000 children ages 1–14 2007 20.0 34.0–9.0 RI
16 Young children (ages 4 months–5 years) at moderate/
high risk for developmental or behavioral delays
2007 25.8 35.2–18.6 ME & MN
17 Children ages 10–17 who are overweight or obese 2007 30.6 44.4–23.1 MN & UT
18 Children ages 1–17 with oral health problems
2007 25.8 31.6–20.0 MN
19 High school students who currently smoked cigarettes 2009 18.3 26.1–8.5 UT
20 High school students not meeting recommended
physical activity level
2009 56.0 66.7–46.4 ID
Source: Commonwealth Fund State Scorecard on Child Health System Performance, 2011.
www.commonwealthfund.org 11
Maine, New Hampshire, Rhode Island, Hawaii,
Minnesota, Connecticut, North Dakota, Penn-
sylvania, Wisconsin, Kansas, and Washington—
often perform well on multiple indicators and
across dimensions (Exhibit 2). At the same time,
the Scorecard nds that even the leading states have
opportunities to improve: no state ranks in the top
half of the performance distribution on all indica-
tors. At the other end of the spectrum, states in
the bottom quartile generally lag in multiple areas,
with worse access to care, lower rates of recom-
mended prevention and treatment, poorer health
outcomes, and wide disparities related to income,
race/ethnicity, and insurance status.
roughout, the ndings underscore the
importance of policy action to sustain children’s
access to care in the midst of rising health care
costs and nancial stress on families. Access to care
must be coupled with statewide initiatives and
community eorts to improve health care system
performance for children.
e State Scorecard on Child Health System
Performance, 2011, nds that some states do
markedly better than others in promoting
the health and development of their youngest
residents, and in ensuring that all children are
on course to lead healthy and productive lives.
As states, clinicians, and hospitals prepare to
implement health reforms, the Scorecard provides a
framework to take stock of where they stand today
and what they could gain by reaching and raising
benchmark performance levels.
e ndings reveal crucial areas in which
comprehensive federal, state, and community
policies are needed to improve child health system
performance for all families. States that invest
in children’s health reap the benets of having
children who are able to learn in school and
become healthy, productive adults. Other states
can learn from models of high performance to
shape policies that ensure all children are given the
opportunity to lead long, healthy lives and realize
their potential.
Greater investment in measurement and
data collection at the state level could enrich
understanding of variations in child health system
performance. For many dimensions, only a limited
set of indicators is available. Moreover, there is
often a time lag in the availability of data. National
surveys of children’s health care are conducted at
four-year intervals, for example. Hence, a large
number of indicators discussed in this Scorecard
date from 2007. e indicators of child health
care quality presented here are also largely parent-
reported. e collection of more robust clinical
data on children’s health care quality is integral to
future state and federal child health policy reform
and could modify the state rankings provided in
this report. e CHIP program reauthorization
has begun to lead the way by creating a set of
standardized quality measures for use by CHIP,
Medicaid, and health plans. e availability of core
measures and information on community-level
variation will enable states to learn from innovative
models. Work under way in many states as well
as eorts supported by CHIP and the Aordable
Care Act should lay a foundation for public and
private action.
12 Securing a Healthy Future: The Commonwealth Fund State Scorecard on Child Health System Performance, 2011
State Scorecard Summary of Child Health System
Performance Across Dimensions
State Rank
Top Quartile
Second Quartile
Third Quartile
Bottom Quartile
1 Iowa
1 Massachusetts
3 Vermont
4 Maine
5 New Hampshire
6 Rhode Island
7 Hawaii
8 Minnesota
9 Connecticut
10 North Dakota
10 Pennsylvania
12 Wisconsin
13 Kansas
13 Washington
15 Michigan
16 Nebraska
17 West Virginia
18 Maryland
19 Ohio
20 Colorado
21 Missouri
21 New York
23 Utah
24 Virginia
25 Indiana
26 Tennessee
27 South Dakota
28 Illinois
29 New Jersey
30 Alaska
31 Delaware
32 North Carolina
33 South Carolina
34 Montana
35 Wyoming
36 Kentucky
37 Alabama
38 Oregon
39 District of Columbia
40 Louisiana
41 Idaho
42 Arkansas
43 Georgia
44 California
45 Oklahoma
46 New Mexico
47 Florida
48 Texas
49 Arizona
50 Mississippi
51 Nevada
Access & Affordability
Prevention & Treatment
Potential to Lead Healthy Lives
Equity
6127
1474
9832
7510 1
2213 11
9214 14
312233
18 11 112
8266 6
16 23 11 17
11 17 24 15
21 14 825
19 62026
12 26 12 21
14 29 21 9
22 16 14 23
24 10 39 5
4182634
14 83627
28 28 427
26 19 30 13
27 34 17 10
17 25 5 42
4342527
31 15 33 22
32 7 44 19
25 13 33 35
33 22 31 32
23 41 16 39
34 38 40 8
13 33 32 45
35 20 28 43
44 23 45 15
42 49 17 20
36 31 22 41
40 30 46 17
29 32 48 27
39 46 9 47
20 39 51 33
43 21 47 37
38 50 17 44
41 37 49 23
29 34 42 46
44 42 27 39
36 47 41 31
46 40 37 35
49 44 35 38
50 48 29 50
47 45 38 49
51 43 50 48
48 51 43 51
RANK STATE
Source: Commonwealth Fund State Scorecard on Child Health System Performance, 2011.
Exhibit 2
EXECUTIVE SUMMARY
www.commonwealthfund.org 13
Highlights
Children’s health insurance coverage has
expanded in many states, while parents’ cov-
erage has eroded. Yet the number of unin-
sured children continues to vary widely
across states.
Currently 10 percent of children are uninsured
nationally, and the uninsured rate for children
exceeds 16 percent in three states. In contrast, 19
percent of parents are uninsured nationally, and
there are nine states in which 23 percent or more
of parents are uninsured. e dierence between
children’s and parents’ coverage rates reects federal
action taken early in the last decade to insure
children, as well as continued federal support for
children’s coverage. ere is no national standard
for coverage of parents, however poor. Still, the
percent of uninsured children continues to vary
widely across states, ranging from a low of 3
percent in Massachusetts to a high of 17 percent
to 18 percent in Nevada, Florida, and Texas. e
range underscores the importance of state as well
as federal action to ensure access and continuity of
care.
e passage of the Aordable Care Act will—
for the rst time—provide health insurance to
all low- and middle-income families. To achieve
this, the law will expand Medicaid to low-income
parents as well as childless adults with incomes
up to 133 percent of the federal poverty level,
beginning in 2014. is represents a substantial
change in Medicaid’s coverage of adults. e law
will also assist families with low and moderate
incomes to purchase coverage through insurance
exchanges and tax credits. ese policies will
directly benet children as families gain nancial
security, and parents’ health improves.
Across states, the extent to which children
have access to care is closely related to their
receipt of preventive care and treatment. Yet
insurance does not guarantee receipt of rec-
ommended care or positive health outcomes.
Seven of the 13 leading states in the access and
aordability dimension also rank among the
top quartile of states in terms of prevention and
treatment. Children in states with the lowest
uninsured rates are more likely to have a medical
home and receive preventive care or referrals to
needed care than children in states with the highest
uninsured rates. While insurance matters, good
care and outcomes are also a function of a well-
functioning health care delivery system. Securing
coverage and access to aordable care for families
is only a rst step to ensure that children obtain
essential care that is well coordinated and patient-
centered.
Children’s access to care, health care qual-
ity, and health outcomes vary widely across
states.
e Scorecard ndings show that where a child
lives has an impact on his or her potential to lead
a healthy life into adulthood. States vary widely
in their provision of children’s health care that is
eective, coordinated, and equitable. is variability
extends to states’ ability to ensure opportunities for
children to achieve optimal health.
ere is a twofold or greater spread between the
best and worst states across important indicators of
access and aordability, prevention and treatment,
and potential to lead healthy lives (Exhibit 1).
e performance gaps are particularly wide on
indicators assessing developmental screening rates,
provision of mental health care, hospitalizations
because of asthma, prevalence of teen smoking,
and mortality rates among infants and children.
Lagging states would need to improve their
14 Securing a Healthy Future: The Commonwealth Fund State Scorecard on Child Health System Performance, 2011
performance by 60 percent on average to achieve
benchmarks set by leading states.
If all states were to improve their performance
to levels achieved by the best states, the cumulative
eect would translate to thousands of children’s
lives saved because of more accessible and
improved delivery of high-quality care. In fact,
improving performance to benchmark levels across
the nation would mean: 5 million more children
would have health insurance coverage, nearly 9
million children would have a medical home to
help coordinate care, and some 600,000 more
children would receive recommended vaccines by
the age of 3 years.
Leading states—those in the top quartile—
often do well on multiple indicators across
dimensions of performance; public policies
and state/local health systems make a
difference.
e 14 states at the top quartile of the overall
performance rankings generally ranked high on
multiple indicators and dimensions (Exhibit 2).
In fact, the ve top-ranked states—Iowa, Massa-
chusetts, Vermont, Maine, and New Hampshire—
Iowa, tied in first place with Massachusetts in terms
of overall children’s health system performance, has
had a long-standing commitment to children. In the
past decade, the state paid particular attention to the
needs of its youngest residents, from birth to age 5.
After piloting a variety of programs in the early 1990s
to identify and serve at-risk children and families, the
Iowa legislature established a statewide initiative to
fund “local empowerment areas” across the state.
The partnerships among clinicians, parents, child care
representatives, and educators seek to ensure children
receive needed preventive care.
State leaders have focused on child health outcomes
by promoting the federal Early and Periodic Screening,
Diagnosis, and Treatment (EPSDT) program. In 1993,
an EPSDT Interagency Collaborative was formed with
a fourfold purpose: to increase the number of Iowa
children enrolled in EPSDT; to increase the percent-
age of children who receive well-child screenings; to
ensure effective linkages to diagnostic and treatment
services; and to promote the overall quality of services
delivered through EPSDT. As a result of these efforts,
the statewide rate of well-child screenings rose from 9
percent to 95 percent in just over five years.
Iowa has also been making strides in providing high-
quality mental health care for children. Its 1st Five
Healthy Mental Development Initiative focuses on a
child’s first five years. The state-led initiative helps pri-
vate providers to develop a sound structure for assess-
ing young children’s social and developmental skills.
Under the 1st Five system, a primary care provider
screens children and their caregivers when they come
in for a visit; if a concern is identified, the provider
notifies the 1st Five Child Health Center. The center’s
care coordinator then contacts the family to link them
to appropriate services in the community or help coor-
dinate referrals.
Iowa also has expansive policies in place to ensure chil-
dren have health care coverage. The State Children’s
Health Insurance Program covers all children under
age 19 in families with income levels up to 133 per-
cent of the federal poverty level (FPL). Children ages
6–18 whose family income is between 100 percent and
133 percent of FPL and infants whose family income is
between 185 percent and 300 percent of FPL are cov-
ered through an expansion of Medicaid. Meanwhile,
children in families with income from 133 percent to
300 percent of FPL are covered through private insur-
ance, in a program known as Healthy and Well Kids
in Iowa (hawk-i). Iowa contracts with private health
plans to provide covered services to children enrolled
in the hawk-i program, with little or no cost-sharing
for families. Recently, in the spring of 2010, hawk-i
implemented a dental-only plan.
Iowa’s innovative policies and public–private partner-
ships to improve children’s health care serve as ev-
idence-based models that other states can follow to
move toward a higher-performing child health system.
For more information see N. Kaye, J. May, and M. K. Abrams,
State Policy Options to Improve Delivery of Child Development
Services: Strategies from the Eight ABCD States (Portland,
Maine, and New York: National Academy for State Health
Policy and The Commonwealth Fund, Dec. 2006); and S. Silow-
Carroll, Iowa’s 1st Five Initiative: Improving Early Childhood
Developmental Services Through Public–Private Partnerships,
(New York: The Commonwealth Fund, Sept. 2008).
IOWA’S COMPREHENSIVE PUBLIC POLICIES MAKE A DIFFERENCE FOR CHILDREN’S HEALTH
www.commonwealthfund.org 15
performed in the top quartile on each of the four
dimensions of performance. Many have been lead-
ers in improving their health systems by taking
steps to cover children or families, promote public
health, and improve care delivery systems (See box
on Iowa).
In contrast, states at the bottom quartile of
overall child health system performance lagged
well behind the leaders on multiple indicators of
performance. ese states had rates of uninsured
children and parents that were, on average, more
than double those in the top quartile of states. Re-
ecting the strong association between access to
care and the quality and continuity of care, chil-
dren in the lowest-quartile states were among the
least likely to receive routine preventive care vis-
its or mental health services when needed, or to
report having a primary care practice that serves as
a medical home to provide care and care coordi-
nation. Notably, rates of developmental delays and
infant mortality are more than 20 percent to 30
percent higher, respectively, in the lowest-quartile
states compared with top-quartile states.
ese patterns indicate that public policies,
as well as state and local health systems, can
make a dierence to children’s health and health
care. But socioeconomic factors also play a role—
underscoring the importance of federal and state
policies in areas with high rates of poverty.
Regional performance patterns provide
valuable insight.
e Scorecard revealed regional patterns in
child health system performance (Exhibit 3).
Across dimensions, states in New England and
the Upper Midwest often rank in the highest
quartile of performance, whereas states with
the lowest rankings tend to be concentrated
in the South and Southwest. Yet within any
region, there are exceptions. For example, West
Virginia and Tennessee face high rates of poverty,
unemployment, and disease yet rank in the top half
of performance on indicators of children’s health.
West Virginia does exceptionally well in ensuring
access and high-quality care for its most vulnerable
children, ranking fth in terms of equity. Alabama
is in the top quartile for children’s insurance, with
nearly 94 percent insured. And North Carolina
leads in providing developmental screening for
young children.
Leading states as well as those that outperform
neighboring states within a region have often made
concerted eorts to improve through coverage and
quality improvement initiatives. Learning about
these initiatives can oer insights for other states,
particularly those starting with similar health
systems or resource constraints.
There is room to improve in all states. Even in
the best states, performance falls short on at
least some indicators and state averages are
below what should be achievable.
All states have room to improve. None ranked in
the top half of the performance distribution across
all indicators. For some indicators, performance
was not outstanding even in the high-ranked
states. For example, North Carolina ranked rst
in terms of screening children for developmental
or behavioral delays, yet more than half of
children in the state were not screened, based on
parents’ reports. Nearly a third of children did
not have access to care meeting the denitions of
a medical home, even in the top-ranked state in
this indicator. Conversely, states that performed
poorly overall outperformed higher-ranking states
on some indicators. ere is value in learning from
best practices around the nation.
Rising rates of childhood overweight or
obesity plague all states. Moreover, many children
live with oral health problems that could be
16 Securing a Healthy Future: The Commonwealth Fund State Scorecard on Child Health System Performance, 2011
addressed with timely, aordable access to eective
preventive dental care and treatment. Even in the
top-ranked state on this indicator, Minnesota, one
of ve children has oral health problems such as
tooth decay, pain, or bleeding gums.
Inequitable care and outcomes by insurance
status, income, and race/ethnicity remain a large
concern. Uninsured, low-income, and minority
children have less than equal opportunity to thrive
in nearly all states. Yet in some higher-performing
states, these vulnerable children do nearly as well
as the national average and rival performance levels
achieved for children in higher-income families,
indicating that gains in statewide performance
are achievable by focusing on the most vulnerable
children.
POLICY IMPLICATIONS
Overall, the Scorecard indicates that multiple
dimensions of health system performance
for children are related. Reducing high rates
of admission to the hospital or emergency
department for children’s asthma requires primary
care resources and, potentially, public health
interventions to reduce the triggers of asthma
attacks. Poor access undermines the quality of care
and drives up costs for complications that could
have been prevented. High rates of infant mortality
are related to high rates of low-birthweight babies,
which in turn are related to the mother’s health
and care during pregnancy. Promoting healthy
family behaviors in medical and community
settings is a key component to preventing
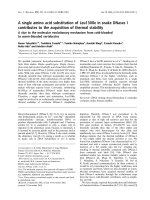
State Ranking on Child Health System Performance
EXECUTIVE SUMMARY Exhibit 3
Source: Commonwealth Fund State Scorecard on Child Health System Performance, 2011.
WA
OR
MT
ND
WY
NV
UT
KS
NE
MN
MO
WI
TX
IA
IL
IN
LA
AL
SC
TN
NC
KY
FL
VA
OH
MI
WV
PA
NY
AK
ME
DC
HI
CO
GA MS
NJ
SD
CT
VT
NH
MD
AR
CA
AZ
NM
OK
ID
DE
MA
RI
State Rank
Top Quartile
Second Quartile
Third Quartile
Bottom Quartile
www.commonwealthfund.org 17
unnecessary deaths, chronic conditions, and
complications among both children and adults.
Ensuring well-coordinated, high-quality care,
including preventive care, will require physicians
and hospitals to work together with families and
share accountability for children’s health. Clinical
care systems also need to work hand in hand with
public health professionals and community-based
groups to implement programs and evaluate
progress toward achieving population health
goals.
1
e report indicates that federal action is
essential to support state and community eorts
for children. is year will mark the second
anniversary of the Children’s Health Insurance
Program Reauthorization Act (CHIPRA), an
event that armed the national commitment
to expanding coverage of children in low- and
modest-income families. e federal stimulus bill
strengthened this support by increasing federal
matching rates for Medicaid to enable states to
maintain these programs in the midst of a severe
recession.
By expanding coverage to adults, as well as
to children, the Aordable Care Act will for the
rst time ensure that coverage will be accessible
and aordable for families in all states. Insurance
expansion to parents will enhance children’s
health and nancial security, based on studies
that nd that children are more likely to be
enrolled in coverage and receive care when their
parents are also insured and have the ability to
pay for care.
Health system provisions of the Aordable
Care Act will improve primary care in all states
by enhancing Medicaid as well as Medicare
payments for primary care and encouraging
physician practices to serve as medical homes.
2
Provisions for support of pediatric accountable care
organizations through state Medicaid programs will
promote innovative, integrated care systems that
emphasize the “triple aim” of better health, better
care experiences, and slower cost growth.
3
Overall, the State Scorecard on Child Health
System Performance, 2011, reveals that—in the
period leading up to the enactment of federal health
care reforms—there were wide geographic variations
in health care system performance for children and
ample opportunities to improve. e gaps between
benchmarks set by top-performing states and
average performance, as well as the wide range of
performance across the nation, indicate that the
United States is failing to ensure that all children
receive the timely, eective, and well-coordinated
care they need for their health and development.
is Scorecard documents geographic variations in
risk factors such as developmental delay and obesity,
pointing out the need for comprehensive medical
and public health interventions to support children
and their families in obtaining needed services and
adopting healthy lifestyles.
While top-performing states provide examples
for other states, the fact remains that none of the
states performed well on all indicators and many
performed at levels that are far from optimal—
highlighting the need for systemic change. Compared
with other states, poorly performing states often
have fewer resources, larger uninsured populations,
and greater socioeconomic challenges that may
limit their capacity for improvement.
4
e formula
for determining federal funding of state Medicaid
programs recognizes this inequality among states.
Likewise, the recent economic recession illustrates
how federal funding plays a countercyclical role to
help all states maintain coverage during times of
scal duress. e Aordable Care Act will continue
18 Securing a Healthy Future: The Commonwealth Fund State Scorecard on Child Health System Performance, 2011
this precedent with a ow of resources into states
with the highest rates of poverty.
Hence, a coherent set of national and state
policies is essential to sustain improvements in
children’s health care across the nation. Federal
health reform provides the common foundation
on which states can build to help eliminate the
variations, gaps, and disparities in children’s
coverage and care documented in this Scorecard.
Notably for children, the Aordable Care Act
strengthens and depends on successful federal–
state partnership—not only to expand coverage
but also to improve the quality of care for children.
State action and leadership will be essential
to implement reforms eectively and to support
initiatives tailored to specic state circumstances.
Actions states can take include:
1. Ensure continuous insurance coverage for all
children by making it easy to sign up for and
keep insurance for children and families. is
includes: removing administrative barriers,
streamlining applications, and coordinating
public and private coverage for lower-income
families through health insurance exchanges.
2. Strengthen Medicaid and CHIP provider
networks with support of care systems that
provide high-quality care and superior
outcomes for children and their families.
3. Align provider incentives to promote access
and high-value care. is includes participat-
ing in multipayer initiatives that support care
coordination in primary care medical homes,
which can help reduce hospitalizations and
emergency department use.
4. Promote accountable, accessible, patient-
centered, and coordinated care for children
by participating in various Medicaid
pilots and demonstrations as well as grant
opportunities to create integrated care
delivery models to improve care in local
communities.
5. Support information systems to inform
and guide eorts to improve quality, health
outcomes, and eciency. is includes:
adoption of pediatric quality measures to
report on CHIP performance; expanded use
of children’s outcome measures, including
tracking potentially preventable rates of
hospital and emergency department use; and
promoting eective use of health information
technology with exchange across sites of care
to enhance coordination and safety and to
support clinicians caring for children and
their families.
6. Participate in statewide initiatives, including
support for shared resources such as after-
hours care and community health teams,
to provide the accountable leadership and
collaboration essential to set and achieve
goals for children’s health.
With costs rising faster than incomes and
pressuring families and businesses, eective public
policies as well as improvement eorts within care
systems are needed. Realizing the potential of recent
federal reforms that focus on children will require
a team eort, calling upon both community-level
interventions and eective state policies. One of
www.commonwealthfund.org 19
the strengths of the U.S. health care system is its
examples of excellence and innovation. Ensuring
that all children have the opportunity to thrive
through a health care system that responds to their
needs will depend on learning from these diverse
experiences and spreading successful improvement
strategies. Investing in children’s health yields
long-term payos: healthy children are better able
to learn in school and are more likely to become
healthy, productive adults. Individuals, families,
and society as a whole benet from reduced
dependency and disability, a healthier future
workforce, and a stronger economy.
20 Securing a Healthy Future: The Commonwealth Fund State Scorecard on Child Health System Performance, 2011
INTRODUCTION
e early years of a child’s life are pivotal to their
future health and development. Disparities in
health and development emerge during children’s
rst few years and worsen with age.
5
e nation’s
health care system plays a vital role in helping
children get a healthy start so they can lead
long, healthy, and productive lives, laying the
groundwork for a strong workforce and economy.
A high-performing health care system would
ensure that all children have equal access to high-
quality and eciently delivered care and would
partner with schools and community organizations
to support families in eectively meeting children’s
health and developmental needs.
Despite the best eorts of health care
professionals, our current health system
underperforms in accomplishing these goals in
comparison with other industrialized countries.
6
Recent reports, for example, nd the United States
falling further behind other wealthy countries on
one key indicator: survival of children past age 5.
7
Within the United States, children’s health and the
care they receive, to a certain extent, depends on
where they live. National and state-level analyses
repeatedly nd that the performance of the health
care system varies widely across states in terms of access
to care as well as the quality, cost, and equity of
care that children receive.
8
e Children’s Health
Insurance Program Reauthorization Act of 2009
(CHIPRA) and enactment of federal health reform
provide a strong foundation on which the nation
and states can build more eective systems of care
for children, who are the future of our nation.
As states implement reforms to achieve higher-
value, aordable health care systems for children
and their families, they need a way to take stock
of their performance and identify areas for
improvement. Canvassing states to identify top
performers on child health system measures is one
such way; it provides achievable benchmarks and
focuses attention on opportunities to improve.
e State Scorecard on Child Health System
Performance, 2011, builds on e Commonwealth
Fund’s series of scorecards assessing national and
state health care systems across core dimensions
of performance. Prepared for state policymakers,
national leaders, and other health care
stakeholders, this Scorecard oers information on
states’ performance with respect to children’s access
to care, health care quality, population health, and
equity. It also provides a means to gauge the impact
of reform eorts as states, communities, providers,
and other constituencies work to organize more
eective local delivery systems that, collectively,
determine statewide performance.
is report follows and expands on a report
published in 2008 on state variations in child
health system performance.
9
It expands the set
of indicators and omits others that could not be
updated. Changes in the denitions of several
indicators subsequent to the 2008 report made it
impossible to compare trends for those indicators.
As a result, this 2011 report provides a new state
baseline rather than trends, and is not directly
comparable to the 2008 report.
is report follows the methodology used in
the earlier report and e Commonwealth Fund’s
general state health system scorecards. e analysis
ranks states relative to the performance of other
states based on the most recent data available—
typically from 2007 to 2009—and clusters
indicators into four dimensions of performance.
Specically, the report includes 20 key indicators of
health system performance for children along the
dimensions of access and aordability, prevention
and treatment, the potential to lead healthy lives,
and equity. e methods box below explains the
www.commonwealthfund.org 21
Dimensions and Indicators
The State Scorecard on Child Health System
Performance, 2011, measures health system perfor-
mance for all 50 states and the District of Columbia us-
ing 20 key indicators (Exhibit 1). It organizes indicators
by four broad dimensions that capture critical aspects
of health system performance:
• Access and Affordability—includes rates of in-
surance coverage for children and parents as
well as indicators of coverage adequacy and the
affordability of care.
• Prevention and Treatment—includes indicators
that measure three related quality-of-care com-
ponents: effective primary and preventive care,
provision of mental health services, and care
coordination, including supportive services for
children with special health care needs.
• Potential to Lead Healthy Lives—includes in-
dicators that measure the degree to which a
state’s children enjoy long and healthy lives.
• Equity—includes differences in performance
on selected indicators from the other three
dimensions associated with children and par-
ent’s income level, type of insurance, or race or
ethnicity.
Where possible, indicators for this report were se-
lected to be equivalent to those used in the National
Scorecard on U.S. Health System Performance.
However, for some areas, there are no child measures
available across states that are comparable to indica-
tors that are available in the National Scorecard. For
instance, databases do not currently track effective
management of chronic conditions, adverse medical
or medication events, utilization of the emergency
department, or potential overuse or duplication of
health services across all states for adults or children.
As child-specific indicators evolve, future child health
system scorecards will add new measures to enrich the
cross-state comparisons.
Appendix B describes the 20 indicators, years, and
data sources for the State Scorecard on Child Health
System Performance, 2011.
Scorecard Ranking Methodology
The State Scorecard on Child Health System
Performance, 2011, first ranks states from best to worst
on each of the 20 performance indicators. We aver-
aged rankings for those indicators within each of the
four dimensions to determine a state’s dimension rank
and then averaged the dimension rankings to arrive
at an overall ranking on health system performance.
This approach gives each dimension equal weight and,
within dimensions, weights indicators equally. We use
average state rankings for the Scorecard because we
believe that this approach is easily understandable.
This ranking method follows that used by Stephen
Jencks and colleagues when assessing the quality of
care for Medicare beneficiaries at the state level across
multiple indicators.*
For the equity dimension, we ranked states based on
the difference between the most vulnerable subgroup
(i.e., low-income, uninsured, or racial/ethnic minority)
and the national average on selected indicators. The
gap indicates how the vulnerable subgroup fares com-
pared with the U.S. average—an absolute standard.
*S. F. Jencks, T. Cuerdon, D. R. Burwen et al., “Quality of
Medical Care Delivered to Medicare Beneficiaries: A Profile at
State and National Levels,” Journal of the American Medical
Association, Oct. 4, 2000 284(13):1670–76; and S. F. Jencks,
E. D. Huff, and T. Cuerdon, “Change in the Quality of Care
Delivered to Medicare Beneficiaries, 1998–1999 to 2000–
2001,” Journal of the American Medical Association, Jan. 15,
2003 289(3):305–12.
WHAT THE SCORECARD MEASURES
Scorecard methodology and limitations on data
currently available at the state level. e Appendix
to this report provides data for all indicators
organized by dimension and shows the states’
rates and rankings on each indicator. e rst two
appendix tables display summary information:
Appendix A1 shows overall state rankings and
where each state ranks on the four dimensions,
and Appendix A2 shows how many indicators
each state had in each performance quartile. e
Appendix also includes demographic tables that
prole states by incidence of poverty, health risks,
and race/ethnicity.
e State Scorecard Data Tables, which are
available online at monwealthfund.
org/~/media/Files/Publications/Fund%20
Report/2011/Feb/Child%20Health%20Scorecard/
state_data_tables.pdf, show dierences by family
22 Securing a Healthy Future: The Commonwealth Fund State Scorecard on Child Health System Performance, 2011
income as well as insurance status and race/
ethnicity for the subset of indicators used in the
equity dimension. State proles, available online
at />and-Maps/State-Data-Center/Child-Health.aspx,
provide estimates for each state of the potential
gain it could achieve if it met the benchmark
performance level set by the leading state for each
indicator.
ACCESS AND AFFORDABILITY
Access to health care is the foundation and
hallmark of a high performance health system.
e foremost factor in determining whether
people have access to care when needed is having
insurance that covers essential care. Consequently,
the extent to which families are able to obtain
coverage that is both comprehensive and aordable
plays a critical role. e access and aordability
dimension of this Scorecard looks at the percent
of children and parents with health insurance
coverage, the percent of currently insured children
whose health coverage is adequate based on reports
by their parents, and the average total premium
for employer-based family coverage as a percent of
median income for family households.
is analysis nds that signicant gaps and
variability in access to care persist across the nation.
Children in the Northeast and Midwest as well as
in the Pacic states of Hawaii and Washington
generally were more likely to be insured and have
better access to care than their peers in the West
and South (Exhibit 4). e three top-ranked
states in this dimension—Massachusetts, New
Hampshire, and Hawaii—performed well on all
four access indicators. ese states are among those
with the most expansive policies supporting public
health insurance for low- and moderate-income
families and insurance market reforms to expand
coverage. Massachusetts achieved top ranking on
this dimension because it has the lowest rates of
uninsured children and parents in the country.
Health Insurance Coverage
Over the last decade there has been considerable
expansion of health coverage for children (Exhibit
5). From 1999–2000 to 2008–09, the number of
states with high rates of uninsured children (16%
or more) has declined from 11 to three states.
e remaining three states—Florida, Nevada,
and Texas—fall within the bottom ve states on
this Scorecard’s access dimension. West Virginia
is particularly notable for having reduced their
children’s uninsured rate by half in the last 10 years,
as is Alabama for having one of the lowest rates
of uninsured children among Southern states and
ranking high among all states—with 94 percent
of children insured as of 2008–09. e high rates
of children insured in Alabama compared with
other states in the region reect that state’s targeted
eort to expand insurance to children. (See box on
Alabama.)
Much of the success in expanding the number
of insured children can be attributed to federal and
state action to cover low- and moderate-income
families. Medicaid expanded coverage to young
children living in poverty by providing states with
federal matching funds for this purpose. In 1997,
the State Children’s Health Insurance Program
(CHIP) was enacted to provide a capped amount
of federal matching funds to states for coverage
of children and some parents with incomes
too high to qualify for Medicaid, but for whom
private health insurance was either unavailable or
unaordable. Covering nearly 8 million children
in 2009, CHIP has played an important role in
reducing the number of uninsured children.
10
In particular, investments in CHIP and
Medicaid support to states have largely oset the
www.commonwealthfund.org 23
impact of the economic downturn and resulting
loss of employer-based coverage. Unlike adult
coverage rates, which declined during the recent
recession, coverage of children held and improved
slightly, with one of 10 children uninsured, on
average, in 2008–09. e coverage landscape
for children would have looked far worse had
states not had federal nancial support to expand
eligibility for children and increase outreach and
enrollment eorts, as well as the enhanced federal
support of Medicaid with the stimulus funds.
With the congressional reauthorization of CHIP
in 2009, as well as additional Medicaid funds made
available to states under the American Recovery
and Reinvestment Act (ARRA) of 2009, states have
managed to preserve and in some cases broaden
health coverage for children. Such federal action
made it possible for more than half of states to
increase eligibility levels or streamline enrollment
and retention procedures since the passage of
CHIPRA, despite coping with excruciating budget
pressures.
11
Still, children’s risk of being uninsured remains
uneven across states (Appendix A3). In 2008–09,
the percentage of children age 18 and under who
were uninsured ranged from a low of 3 percent in
Massachusetts to a high of 18 percent in Texas.
is gap in part reects the dierences in current
eligibility standards in addition to enrollment
and retention barriers for public health insurance
programs across states. Varying Medicaid/CHIP
policies across states are illuminated by the even
wider variation in insurance coverage among
children living in low-income families. (e Equity
State Ranking on Access and Affordability Dimension
ACCESS AND AFFORDABILITY Exhibit 4
Source: Commonwealth Fund State Scorecard on Child Health System Performance, 2011.
State Rank
Top Quartile
Second Quartile
Third Quartile
Bottom Quartile
WA
OR
MT
ND
WY
NV
UT
KS
NE
MN
MO
WI
TX
IA
IL
IN
LA
AL
SC
TN
NC
KY
FL
VA
OH
MI
WV
PA
NY
AK
ME
DC
HI
CO
GA MS
NJ
SD
CT
VT
NH
MD
AR
CA
AZ
NM
OK
ID
RI
MA
DE