Báo cáo khoa học: Analysis and biological relevance of advanced glycation end-products of DNA in eukaryotic cells ppt
Bạn đang xem bản rút gọn của tài liệu. Xem và tải ngay bản đầy đủ của tài liệu tại đây (384.6 KB, 12 trang )
Analysis and biological relevance of advanced glycation
end-products of DNA in eukaryotic cells
Viola Breyer1,*, Matthias Frischmann1,*, Clemens Bidmon1, Annelen Schemm2, Katrin Schiebel2
and Monika Pischetsrieder1
1 Department of Chemistry and Pharmacy, University of Erlangen-Nuremberg, Germany
2 Institute for Biochemistry, University of Erlangen-Nuremberg, Germany
Keywords
advanced glycation end-products; DNA;
eukaryotic cells; Maillard reaction;
N 2-carboxyethyl-2¢-deoxyguanosine
Correspondence
M. Pischetsrieder, Department of Chemistry
and Pharmacy, Henriette Schmidt-Burkhardt
Chair of Food Chemistry, Schuhstr. 19,
91052 Erlangen, Germany
Fax: +49 9131 8522587
Tel: +49 9131 8524102
E-mail: pischetsrieder@lmchemie.
uni-erlangen.de
Website: ensmittelchemie.
pharmazie.uni-erlangen.de
*These authors contributed equally to this
work
(Received 23 October 2007, revised 17
December 2007, accepted 19 December
2007)
Advanced glycation end-products (AGEs) of DNA are formed spontaneously by the reaction of carbonyl compounds such as sugars, methylglyoxal
or dihydroxyacetone in vitro and in vivo. Little is known, however, about
the biological consequences of DNA AGEs. In this study, a method was
developed to determine the parameters that promote DNA glycation in
cultured cells. For this purpose, the formation rate of N2-carboxyethyl-2¢deoxyguanosine (CEdG), a major DNA AGE, was measured in cultured
hepatic stellate cells by liquid chromatography (LC)-MS ⁄ MS. In resting
cells, a 1.7-fold increase of CEdG formation rate was observed during
14 days of incubation. To obtain insights into the functional consequences
of DNA glycation, CEdG was introduced into a luciferase reporter gene
vector and transfected into human embryonic kidney (HEK 293 T) cells.
Gene activity was determined by chemiluminescence of the luciferase. Thus,
CEdG adducts led to a dose-dependent and highly significant decrease in
protein activity, which is caused by loss of functionality of the luciferase in
addition to reduced transcription of the gene. When the CEdG-modified
vector was transformed into Escherichia coli, a loss of ampicillin resistance
was observed in comparison to transformation with the unmodified plasmid. These results indicate that CEdG accumulates in the genomic DNA
of resting cells, which could lead to diminished protein activity.
doi:10.1111/j.1742-4658.2008.06255.x
Sugars and other reactive carbonyl compounds bind
spontaneously to nucleophilic amino groups of amino
acids and proteins in a nonenzymatic process (glycation) [1]. It is well established that proteins are readily
glycated in vivo. The first glycation product to be
detected in vivo was hemoglobin (Hb) A1c, the Amadori
product of Hb A [2]. Hb A1c is now an established clinical marker for medium-term hyperglycemia in diabetic
patients. In vivo, early glycation products, such as the
Amadori product, are further converted into the heterogeneous group of advanced glycation end-products
(AGEs). AGEs accumulate on serum proteins and in
various tissues, particularly during aging, diabetes, and
renal failure [3]. Elevated AGE levels contribute to the
development of diabetic and uremic complications, such
as atherosclerosis [4], nephropathy, and retinopathy [5].
In analogous reactions, glycation may also affect
DNA. In vitro, nucleobases and dsDNA react with
Abbreviations
AGE, advanced glycation end-product; CEdG, N2-carboxyethyl-2¢-deoxyguanosine; DAD, diode array detector; dG, 2¢-deoxyguanosine
monohydrate; DHA, dihydroxyacetone; Hb, hemoglobin; LC, liquid chromatography; TMB, 3,3¢,5,5¢-tetramethylbenzidine dihydrochloride;
TY, tryptan yeast medium.
914
FEBS Journal 275 (2008) 914–925 ª 2008 The Authors Journal compilation ª 2008 FEBS
V. Breyer et al.
sugars in a similar way as proteins [5–7]. The exocyclic
amino group of 2¢-deoxyguanosine is particularly
prone to glycation reactions, leading to the formation
of N2-carboxyethyl, N2-carboxymethyl, N2-(1-carboxy3-hydroxypropyl), and N2-(1-carboxy-3,4,5-trihydroxypentyl) modifications, as well as cyclic dicarbonyl
adducts [6,8–10]. The two diastereomers of N2-carboxyethyl-2¢-deoxyguanosine (CEdGA,B; Scheme 1) are
stable reaction products that are formed from a variety
of glycating agents, such as glucose, ascorbic acid,
glyceraldehyde, dihydroxyacetone (DHA), or methylglyoxal [10–12]. Recently, carboxyethylated nucleobases were detected in human urine [13], indicating the
formation of DNA AGEs in the healthy human
organism. A significantly increased number of CEdGpositive cells were immunostained in glomeruli of
patients with diabetic nephropathy as compared to
healthy controls [14], as well as in glomeruli of diabetic
rats [15].
DNA AGEs are potentially genotoxic compounds
because they induce depurination [9] as well as singlestrand breaks and lead to mutations [16] in vitro.
In vivo, it was shown, for example, that 3-deoxyglucosone, a glucose degradation product, induces embryonic malformation and teratogenicity, effects that may
be related to DNA AGEs [17].
DNA glycation in cultured cells was observed using
radioactively labeled glucose [18] or a 32P-postlabeling
technique [19]. Furthermore, the presence of CEdGA,B
was detected in cultured cells by HPLC–diode array
detector (DAD) after immunoaffinity chromatography
[20]. In order to investigate factors that influence
cellular DNA glycation, reliable analytical methods are
required to measure the DNA glycation rate in cell
models.
In this study, we developed a liquid chromatography (LC)-MS ⁄ MS method for the analysis of
the CEdG formation rate in genomic DNA of
cultured cells. Furthermore, the influence of CEdG
DNA advanced glycation end-products in cells
formation on cellular protein expression was investigated.
Results
LC-MS ⁄ MS analysis of CEdGA,B
In this study, an LC-MS ⁄ MS method was developed
to determine the formation rate of CEdGA,B in genomic DNA of cultured HSC-T6 hepatic stellate cells.
In the first step, chromatographic conditions were
optimized with a CEdGA,B standard to minimize the
detection limit. For sufficient sensitivity of the mass
analysis, the analytes should elute with a maximal
proportion of organic solvent into the ion source. On
the other hand, the LC should lead to the separation
of CEdGA,B from major interfering compounds. Thus,
optimal chromatography conditions were achieved
using an ammonium formate ⁄ acetonitrile buffer that
eluted CEdGA,B as a peak pair at 8.3 and 9.5 min
(Fig. 1A). The sensitivity was greatly increased by the
use of ammonium formate to support ESI and by mass
analysis in the negative mode [21].
As guanosine, which coelutes with CEdGB under
these chromatographic conditions, leads to quenching
of the analyte signal, it was necessary to remove RNA
thoroughly during sample work-up by isolation of the
nuclei and adequate RNase treatment. Deoxycytidine,
which coelutes with CEdGA, showed no interference
with the analysis. After the extraction step, the DNA
was hydrolyzed enzymatically and subjected to LCMS ⁄ MS. Thus, a detection limit of about 0.5 ngỈmL)1
CEdGA,B was achieved.
Identification of CEdGA,B and assessment of the
glycation rate
For unequivocal identification of CEdGA,B in the
genomic DNA of HSC-T6 cells, several parameters
Scheme 1. Formation of DNA-bound CEdGA,B from different carbonyl sources.
FEBS Journal 275 (2008) 914–925 ª 2008 The Authors Journal compilation ª 2008 FEBS
915
DNA advanced glycation end-products in cells
V. Breyer et al.
1800
A
Mass transition (m/z)
1600
338 – 178
338 – 106
338 – 149
Intensity (cps)
1400
1200
CEd GA
1000
800
CE dGB
600
400
200
0
B
6
7
8.0E+05
8
1.2E+06
Intensity
5
10
11
Time (min)
12
13
14
178
[M- CO2-dRib - H]
15
338
[M-CO2-H]-
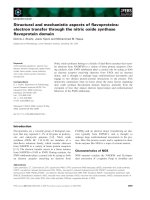
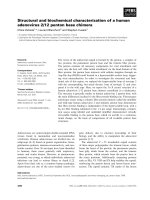
Fig. 1. LC-MS ⁄ MS analysis of CEdGA,B. (A)
LC-MS ⁄ MS chromatogram of a synthesized
CEdGA,B standard showing the three main
mass transitions (338 fi 178, 338 fi 106,
338 fi 149). (B) Product ion scan of CEdG.
The three main mass transitions
338 fi 178, 338 fi 106 and 338 fi 149
were used as qualifiers; the mass transition
338 fi 178 was used as quantifier.
106
4.0E+05
0.0E+00
9
294
[M- CO2- H]
149
0
25
50
75
100 125 150 175 200 225 250 275 300 325 350
m/z
Accumulation of CEdGA,B in hepatic stellate cells
in vitro
In order to investigate factors that influence DNA
glycation, a cell culture model was established that
allowed the analysis of cellular CEdGA,B formation.
HSC-T6 hepatic stellate cells were chosen as an adequate model, because of the high yield of extractable
916
Intensity (cps)
A
4.0E+06
3.0E+06
2.0E+06
1.0E+06
0.0E+00
0
5
10
15
20
Time (min)
B
Intensity (cps)
were applied: (a) the appearance of a peak pair with
retention times of 8.3 and 9.5 min, and (b) the presence
and (c) the correct proportion of the three major mass
transitions of CEdGA,B that were used for MS ⁄ MS
detection. The main transition is 338 fi 178 m ⁄ z, which
arises from the loss of deoxyribose and CO2, followed
by the transitions 338 fi 106 m ⁄ z, and 338 fi 149 m ⁄ z
(Fig. 1B). Furthermore, some of the biological samples
were spiked with synthesized CEdGA,B standard to
verify peak assignment.
CEdGA,B was quantified by MS ⁄ MS using the transition 338 fi 178 m ⁄ z as quantifier and then normalized by the concentration of 2¢-deoxyguanosine. The
nucleotide 2¢-deoxyguanosine monohydrate (dG) eluted
with a retention time of 10.6 min, and the three major
mass transitions 266 fi 150 m ⁄ z, 266 fi 133 m ⁄ z, and
266 fi 107 m ⁄ z in the MS ⁄ MS identified the correct
peak (Fig. 2A). For quantification, the main transition
at 266 fi 150 m ⁄ z was used.
500
450
400
350
300
250
200
150
100
50
0
CEdGB
CEdGA
5
6
7
8
9
10
11
12
13
14
15
Time (min)
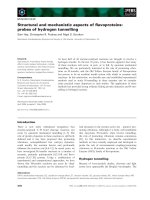
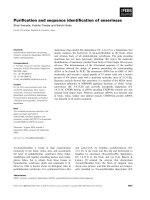
Fig. 2. LC-MS ⁄ MS analysis of CEdGA,B in the DNA of HSC-T6 cells.
(A) Analysis of dG in genomic DNA. The LC-MS ⁄ MS chromatogram
shows the main transitions for dG (266 fi 150, 266 fi 133,
266 fi 108). (B) Detection of CEdGA,B in the genomic DNA of cultured HSC-T6 cells after enzymatic hydrolysis. The LC-MS ⁄ MS chromatogram shows the main mass transition for CEdG (338 fi 178).
DNA from these cells and their relatively high glycation rate as compared to several other tested cell lines.
Although CEdGA,B concentrations were rather low
FEBS Journal 275 (2008) 914–925 ª 2008 The Authors Journal compilation ª 2008 FEBS
V. Breyer et al.
DNA advanced glycation end-products in cells
300
Glycation rate (%)
250
200
150
100
50
0
0 days of incubation
14 days of incubation
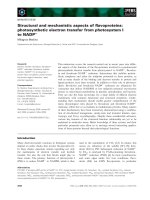
Fig. 3. Increase in the glycation rate of genomic DNA from HSC-T6
cells, which were incubated for 14 days in reduced medium. The
DNA was extracted, enzymatically hydrolyzed, and analyzed by LCMS ⁄ MS. For each data point, cells from 10 culture flasks were
combined. The results from two experiments are shown.
under normal growing conditions, DNA glycation
could be unequivocally detected when a sufficient number of cells was analyzed (Fig. 2B). In order to investigate whether CEdG has the potential to accumulate in
genomic DNA of nongrowing cells, HSC-T6 cells were
kept in minimal medium containing 1.5% fetal bovine
serum for 2 weeks. The composition of the medium
was adjusted to minimize growth and cell death during
14 days of incubation. The cell number was determined by the total amount of 2¢-deoxyguanosine. One
half of the confluent HSC-T6 cells was harvested
immediately and the other half after 14 days of incubation in minimal medium. Then, genomic DNA was
extracted from the cells, digested, and analyzed by LCMS ⁄ MS. For each data point, the DNA of 10 culture
flasks was pooled, and a 1.7-fold increase of CEdG
formation rate was measured (Fig. 3).
Influence of CEdG adducts on luciferase activity
in HEK 293 T cells in vitro
As these data indicated that CEdG accumulates in
resting cells, we investigated whether CEdG adducts of
DNA have an impact on protein expression. For this
purpose, CEdG was introduced into the luciferase
reporter gene vector pGL3 Control. CEdG-modified
and unmodified vectors were transfected in parallel
into HEK 293 T cells, and gene expression was investigated by measurement of luciferase activity.
CEdG was specifically introduced into the vector
pGL3 Control by mixtures containing 0.1 lgỈlL)1
plasmid and 100 lm, 1 mm or 5 mm DHA, respectively. CEdG concentrations were determined by an
anti-CEdG ELISA. Samples were taken every 3 h
over a period of 9 h. The results are shown in
Table 1. The amount of CEdG formed during the
DHA incubation of the vector pGL3 Control
increased with both incubation time and quantity of
glycating reagent. The reaction mixture containing the
highest concentration of DHA generated the highest
CEdG levels.
CEdG-modified and unmodified vectors (as control) were transfected into HEK 293 T cells via calcium phosphate precipitation. A b-galactosidase
vector was cotransfected in order to determine the
transfection efficiency. The relative luciferase activities were determined using a luciferase reporter gene
assay. Relative luciferase activities were defined as
the ratio of the firefly luciferase to b-galactosidase
value of each sample to the mean ratio of the
unmodified pGL3 Control vector. The results of the
luciferase reporter gene assay with the CEdG-modified vector showed that the plasmid with the highest
CEdG level yielded the lowest protein activity. Incubation of the vector pGL3 Control with 100 lm
DHA resulted in a significant reduction of about
50% (P < 0.01) of the relative luciferase activity
(Fig. 4A). The modified plasmids derived by the
incubation with 1 mm DHA led to a highly significant reduction in the protein activity of about 70%
(P < 0.001) (Fig. 4B). A significant decrease of 90%
(P < 0.01) was observed for plasmids incubated with
5 mm DHA (Fig. 4C). These data indicate that
CEdG modification led to reduced protein activity,
increasing with higher modification rates of the
encoding vector.
Table 1. Concentrations of CEdG (nmolỈlg)1 plasmid) measured by ELISA. CEdG adducts were introduced by incubation of 0.1 lgỈlL)1 plasmid and 100 lM, 1 mM and 5 mM DHA for 0, 3, 6 and 9 h at 70 °C, respectively. Each data point represents the mean value of three ELISA
measurements.
DHA concentration
0h
3h
6h
9h
100 lM
1 mM
5 mM
Not detectable
Not detectable
Not detectable
1.58 · 10)4
2.00 · 10)3
6.42 · 10)3
6.37 · 10)4
8.36 · 10)3
1.55 · 10)2
1.54 · 10)3
9.95 · 10)3
1.94 · 10)2
FEBS Journal 275 (2008) 914–925 ª 2008 The Authors Journal compilation ª 2008 FEBS
917
DNA advanced glycation end-products in cells
V. Breyer et al.
100
100
100
80
80
*
**
60
40
60
RLU (%)
C 120
RLU (%)
B 120
RLU (%)
A 120
**
40
***
***
80
60
40
20
20
0
0
0
**
20
Control
0h
3h
6h
9h
Control
0h
3h
6h
9h
**
Control
0h
3h
**
6h
9h
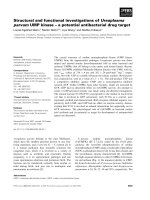
Fig. 4. Chemiluminescence measurement of luciferase activity after transformation of a CEdG-modified vector pGL3 Control into HEK 293 T
cells. For CEdG formation, 0.1 lgỈlL)1 plasmid was incubated with 100 lM (A), 1 mM (B) and 5 mM (C) DHA for 0, 3, 6 and 9 h at 70 °C. Relative luciferase units (RLU) were defined as the ratio of the firefly luciferase to a cotransfected b-galactosidase mean value relative to the
unmodified pGL3 Control vector. Each assay was performed in triplicate, and mean and standard deviations are shown. *P < 0.05,
**P < 0.01, ***P < 0.001.
Cytotoxic effect on transfected HEK 293 T cells
To ensure that the observed reduction of the luciferase activity was not a result of cytotoxic activity of
the CEdG-modified plasmid DNA, the viability of
transfected HEK 293 T cells was determined. The
data shown in Fig. 5 indicate that transfection in
general had a cytotoxic effect. Transfection with the
unmodified vector reduced the cell viability from
92.7% to 64.8%, whereas CEdG-modified plasmid
DNA led to a decrease to 49.8%. The difference
between transfection with CEdG-modified and
unmodified plasmid DNA is around the significance
level of 0.05.
Survival of transfected HEK
293 T cells (%)
100
90
80
70
60
50
40
In addition to the luciferase gene, the vector pGL3 Control contains the Amp+ gene, which confers resistance
to ampicillin as a selection marker for propagation in
bacterial cells. This gene was used to determine the
potential of CEdG–DNA adducts to induce mutations
by the parallel transformation of equal amounts of
CEdG-modified and unmodified DNA into the electrocompetent Escherichia coli strain JM 109. An additional
mock transformation and plating without ampicillin
resistance selection resulted in a strong cytotoxic effect
of the transformation procedure itself and so in far
fewer colonies on culture plates. The addition of DNA
further increased the cytotoxic effect, but the effect was
not significantly different between unmodified and
CEdG-modified DNA (data not shown). In contrast, a
10 000-fold reduction of viable cells was observed when
bacteria transformed with modified DNA (5 mm DHA,
9 h) were compared with those transformed with
unmodified DNA after plating on ampicillin-supplemented plates. Furthermore, the reduction of the
number of ampicillin-resistant colonies correlated with
increasing CEdG concentration (Fig. 6).
30
20
Restriction enzyme digestion of CEdG-modified
plasmid DNA
10
0
Mock transfection
Control plasmid
CEdG modified
plasmid
Fig. 5. Cytotoxic effect of unmodified and CEdG-modified DNA on
transfected HEK 293 T cells. Equal amounts of the unmodified control plasmid DNA and the CEdG-modified plasmid DNA were transfected into HEK 293 T cells via calcium phosphate precipitation. For
the introduction of CEdG adducts, 0.1 lgỈlL)1 plasmid DNA and
5 mM DHA were incubated for 9 h at 70 °C. The cell viability was
determined 24 h after transfection. Mean and standard deviation
are shown.
918
Influence of CEdG adducts on the functionality
of the ampicillin resistance gene
Restriction enzymes recognize a palindromic DNA
sequence and cut the DNA endonucleolytically within
this sequence. To determine whether CEdG-modified
plasmid DNA is differentially recognized and digested
by restriction enzymes, CEdG-modified and unmodified plasmid DNA was digested in parallel by six
restriction endonucleases, which were known to cut the
plasmid DNA at a single position, at two positions, or
at three positions, respectively. Enzymes were chosen
FEBS Journal 275 (2008) 914–925 ª 2008 The Authors Journal compilation ª 2008 FEBS
V. Breyer et al.
DNA advanced glycation end-products in cells
enzymes, the CEdG-modified plasmid DNA often
yielded higher amounts of the open circular undigested
and of only partially digested plasmid as compared to
the unmodified plasmid DNA (Fig. 7).
(cfu·mL–1)
A 1.E+09
1.E+08
1.E+07
1.E+06
1.E+05
1.E+04
1.E+03
1.E+02
1.E+01
1.E+00
Quantification of plasmid transcription
Control
In order to determine whether reduced luciferase
activity after transfection with CEdG-modified plasmid DNA is due to reduced expression of the gene,
mRNA of transfected cells was isolated, reverse transcribed, and amplified with luciferase-specific primers.
For normalization, unmodified b-galactosidase plasmid was cotransfected and amplified in parallel. Two
independent transfection experiments resulted in a
60% reduced expression level of the luciferase gene
(Fig. 8).
9h
B 7.E+04
(cfu·mL–1)
6.E+04
5.E+04
4.E+04
3.E+04
2.E+04
1.E+04
0.E+00
3h
6h
9h
Fig. 6. Colony forming units (cfmL)1) after electroporation of an
unmodified and a CEdG-modified vector in competent E. coli
JM 109 cells and plating on ampicillin-supplemented TY plates. (A)
Comparison of unmodified (treated similarly but in the absence of
DHA) and CEdG-modified DNA (9 h, 5 mM DHA). (B) Incubation
time-dependent reduction of colony forming units (cfmL)1) of
CEdG-modified plasmid DNA (0.1 lgỈlL)1 DNA, 5 mM DHA for 3, 6
and 9 h at 70 °C).
so that they had at least two GC pairs in the recognition site. When the agarose gel electrophoresis patterns
of undigested samples of CEdG-modified and unmodified plasmids were compared, differences in the
amounts of supercoiled, open circular and linear DNA
were observed. After hydrolysis by the restriction
Discussion
In this study, we developed a highly sensitive method to
measure cellular DNA glycation rate in vitro by
LC-MS ⁄ MS, with the goal of studying parameters that
promote cellular DNA glycation. The two diastereomers of CEdG were chosen as important DNA glycation products, because they are formed from a large
variety of glycating agents and represent stable adducts
that can accumulate during a lifetime [12]. Furthermore,
CEdG was detected in vivo, where its formation was
related to diseases, such as diabetic nephropathy
[13–15]. In order to detect low amounts of DNA AGEs
present in cultured cells, maximum analytical sensitivity
of the LC-MS ⁄ MS method had to be achieved by
several measures. In particular, the solvent composition
of the HPLC gradient, the thorough removal of RNA
from the samples and the use of negative ionization for
Fig. 7. Restriction digests of CEdG-modified and unmodified pGL3 Control vector. For the introduction of CEdG adducts, 0.1 lgỈlL)1 plasmid
was incubated with 5 mM DHA for 9 h at 70 °C. The digestions were performed at 37 °C overnight using NcoI, AfeI, MfuI, BspMI, BspHI,
and PvuI, respectively. For control, the vector was treated in parallel, but in the absence of DHA (U, unmodified; M, CEdG modified; k, marker k EcoRI ⁄ HindIII; SS, single stranded; SC, supercoiled; L, linear; OC, open circular).
FEBS Journal 275 (2008) 914–925 ª 2008 The Authors Journal compilation ª 2008 FEBS
919
Relative luciferase
expression (%)
DNA advanced glycation end-products in cells
V. Breyer et al.
100
90
80
70
60
50
40
30
20
10
0
Control
5 mM DHA, 9 h
Fig. 8. Quantification of mRNA expression. CEdG-modified (5 mM
DHA for 9 h at 70 °C) pGL3 Control vector plasmid DNA
(0.1 lgỈlL)1) and the unmodified vector (control) were transfected
in parallel into HEK 293 T cells. The isolated RNAs were reverse
transcribed and amplified with luciferase- and b-galactosidase-specific primers. Amplification products were separated on agarose
gels, and the amount was determined semiquantitatively. Relative
luciferase activity was defined as the ratio of luciferase to a cotransfected b-galactosidase mean value relative to the unmodified
pGL3 Control vector. The experiment was performed in duplicate.
MS analysis were critical parameters. This novel
method was then sensitive enough to detect CEdGA,B in
cultured cells, when a sufficient number of cells was
combined. Thus, the influence of culture conditions on
cellular CEdG formation and the relative glycation rate
could be determined.
Among several tested cell lines, hepatic stellate
cells (HSC-T6) showed the highest glycation rate.
Even after only 4 h of incubation of the confluent
cells, CEdGA,B could be measured by LC-MS ⁄ MS.
This system proved to be suitable for the investigation of factors that influence cellular DNA glycation.
First, we investigated whether CEdG accumulates in
resting HSC-T6 cells. After 14 days of incubation, a
1.7-fold increase of CEdG content in the genomic
DNA of the cells was measured. These results indicated that CEdG can accumulate at least in vitro
under conditions of limited cell proliferation. In vivo,
nonproliferating cells are found in postmitotic tissue,
such as the brain. DNA repair activity in adult
brain is only present at a very low level [22], leading
to an accumulation of DNA damage and DNA
adducts during aging [23,24]. CEdG formation is
caused by the reaction of reactive carbonyl compounds with DNA. As reactive carbonyl compounds
are ubiquitously present in cells, the current results
suggest that DNA glycation contributes to the
observed accumulation of DNA damage during
aging. DNA glycation could be further promoted by
conditions of increased carbonyl stress, such as diabetes or uremia [25]. It was hypothesized before that
DNA glycation is a critical mechanism in aging:
920
DNA–carbonyl adducts may be readily removed by
the cellular repair systems. As these processes are
error-prone, they may gradually lead to DNA mutations and – as a consequence – to a gradual loss of
genomic integrity [26]. On the basis of the present
study, a second mechanism can be added in which
DNA glycation leads to an accumulation of CEdG
adducts in postmitotic tissues with decreased repair
efficiency. Unrepaired CEdG adducts may influence
both replication and transcription by steric hindrance
and ⁄ or mispairing. Less efficient replication may be
caused by modification of the origin of replication
or by inhibition of the replication machinery. It has
been shown that glycation decreases the stability of
the N-glycosidic bond in DNA. This leads to an
increased hydrolysis rate and to depurination in vitro
[9]. The resulting destabilization of the DNA may
also incapacitate the DNA polymerase. As a consequence, generalized DNA degradation may occur,
which could lead to apoptosis, indicating a cytotoxic
effect of CEdG-modified DNA. A cytotoxic effect
around the significance level was observed in HEK
293 T cells after transfection, whereas transformation
of CEdG-modified plasmids into E. coli cells showed
only a slight cytotoxic effect. Hence, eukaryotic cells
may have developed a mechanism to eliminate cells
with an increased level of glycated DNA.
To analyze the consequences of DNA glycation for
protein expression, different levels of CEdG adducts
were introduced into the luciferase-containing reporter
gene vector pGL3 Control by a preparative method
using DHA. The advantage of this method is that
defined concentrations of CEdG can be introduced
into the DNA by varying DHA concentration and ⁄ or
incubation time. Under these conditions, formation of
byproducts was not observed [9]. As a consequence,
any observed biological effects can clearly be related
to the presence of CEdG. In contrast, incubation of
DNA with other glycation precursors may lead to
ambiguous results, due to the presence of modifications different from CEdG.
There may be different reasons for the CEdGdependent loss of luciferase activity observed after
transfection of DHA-treated DNA into HEK 293 T
cells: DNA modification could lead to a generally
reduced transcription level, or may inactivate the promoter by preventing transcription factors from binding to the template. Furthermore, it is possible that
CEdG-induced mutations result in a nonfunctional
protein. Gene mutations were observed before, when
E. coli cells were transfected with carboxyethylated
DNA [16]. Mutation events, mainly transposition,
were also detected when a plasmid, preincubated with
FEBS Journal 275 (2008) 914–925 ª 2008 The Authors Journal compilation ª 2008 FEBS
V. Breyer et al.
a reaction mixture of glucose 6-phosphate and lysine,
was transfected into murine lymphoid cells [27]. These
changes may be caused, for example, by glycation or
oxidation reactions that have taken place during the
pretreatment. In addition, transfection of a glyoxaltreated plasmid into COS-7 cells led to mutations,
which were mainly caused by G:C fi T:A transversions [28,29]. Glyoxal, however, is not a precursor for
CEdG [30]. Treatment with 5 mm DHA for 9 h leads
to 67 modified bases per plasmid. Therefore, theoretically, two or three CEdG adducts were created in the
promoter region and a further 21 in the luciferaseencoding gene.
Agarose gel electrophoresis of the CEdG-modified
and unmodified plasmid showed, for the latter, a
higher prevalence of the intact supercoiled structure.
Both heat treatment and CEdG modification have
been shown previously to diminish the amount of
supercoiled DNA [11,31]. As CEdG-modified and
unmodified plasmids have been heated in parallel, the
observed changes in the DNA structure are most likely
caused by the CEdG adducts. Comparative restriction
digests of CEdG-modified and unmodified plasmid
DNA clearly showed that enzymatic interaction with
CEdG-modified DNA is disturbed, resulting in a
reduced completeness of the digest. The inability to
digest the CEdG-modified DNA by restriction enzymes
can be caused by a steric hindrance of DNA adducts
and by the loss of the symmetry of the recognition
site.
Steric hindrance and error-prone repair mechanisms
might also be one cause for reduced transcription factor binding decreasing the amount of transcripts. Analysis of the amount of luciferase mRNA of transfected
cells by semiquantitative RT-PCR resulted in an
approximately 60% reduction of transcripts. Therefore, reduced expression of functional luciferase is
caused, at least in part, by a reduced amount of
mRNA.
Experiments in bacteria demonstrated that, apart
from a cytotoxic effect of the transformation procedure itself, transfection with CEdG-modified plasmid
DNA had only a minor influence on cell viability as
compared to transfection with the unmodified vector.
Therefore, the 10 000-fold reduction in the formation
of ampicillin-resistant colonies is due to the loss of the
expression of a functional Amp+ gene, which most
likely is caused by mutations altering the correct translation of the protein.
Both the influence of CEdG modifications on the
relative luciferase activity and the influence on the
ampicillin resistance resulted in an inhibition of functional gene expression. As different transfection ⁄ trans-
DNA advanced glycation end-products in cells
formation methods were used (calcium phosphate
precipitation for HEK 293 T cells and electroporation
for E. coli), it is unlikely that the observed effects are
caused only by decreased transfection ⁄ transformation
efficiency. It can be assumed that the CEdG adducts
in a gene lead to a reduced transcription rate, due to
reduced priming or inefficient transcription, and to a
loss of gene function, due to missense or nonsense
mutations.
Experimental procedures
Synthesis of CEdGA,B
dG (Fluka, Buchs, Switzerland; 1.71 g, 0.2 m) and 2.70 g
of DHA (1 m) were suspended in 30 mL of 1 m sodium
phosphate buffer (pH 7.4) and incubated at 70 °C in a
shaking water bath. dG dissolved at 70 °C during the
course of the reaction. After 24 h, the reaction mixture
was pipetted slowly into 130 mL of cold ethanol to
precipitate sodium phosphate. After filtration, ethanol
was removed by vacuum distillation with a rotary
evaporator.
The mixture was separated by preparative HPLC in
order to obtain both diastereomers of CEdG. A Jasco
HPLC system (Gross-Umstadt, Germany) with a PU-1580
intelligent pump, an LG-1580-02 ternary gradient unit, a
DG-1580-53 three-line degasser and an MD-1510 multiwavelength detector was used. Chromatographic conditions
were as follows: Macherey-Nagel Nucleosil 100 column
(Dueren, Germany), 21 · 250 mm with 7 lm particle size;
eluent A, 50 mm aqueous ammonium formate buffer
(pH 4.5); eluent B, methanol HPLC grade (Fisher Scientific, Loughborough, UK); eluent C, water; gradient elution
(time ⁄ %B; eluent A was constantly 10%), 0 min ⁄ 20,
30 min ⁄ 50, 35 min ⁄ 90, 45 min ⁄ 90, 50 min ⁄ 20, 70 min ⁄ 20,
flow rate 6 mLỈmin)1.
Two main fractions, which eluted at about 15 and
19 min, were collected, lyophilized, and purified a second
time with 100% water as eluent. MS and NMR data
identified the two products as the diastereomers of
CEdG. CEdGA and CEdGB were assigned randomly
according to the appearance in the HPLC chromatograms.
LC-MS ⁄ MS instrument setup
An Agilent 1100 series HPLC system (Palo Alto, USA)
with degasser, binary pump, column compartment, and
DAD, a Perkin-Elmer PE200 autosampler (Boston, USA)
and an Applied Biosystems API 2000 ESI-MS ⁄ MS instrument (Foster City, CA, USA) were used. Chromatographic
conditions were as follows: Agilent Zorbax Eclipse XDBC8 column, 4.6 · 150 mm, with 5 lm particle size;
FEBS Journal 275 (2008) 914–925 ª 2008 The Authors Journal compilation ª 2008 FEBS
921
DNA advanced glycation end-products in cells
V. Breyer et al.
eluent A, 5 mm aqueous ammonium formate buffer (freshly
prepared) (pH 6.2); eluent B, acetonitrile HPLC grade
(Fisher Scientific); gradient elution (time ⁄ %A), 0 min ⁄ 95,
6 min ⁄ 40, 8 min ⁄ 10, 17 min ⁄ 10, 20 min ⁄ 95, 25 min ⁄ 95,
flow rate 300 lLỈmin)1. Unmodified DNA and RNA bases
were detected by DAD at their absorption maximum of
254 nm.
MS parameters were as follows: negative ionization; ion
spray voltage )4500 V; nebulizer gas, 30 lb in)2, heater gas,
75 lb in)2; heater gas temperature, 420 °C; declustering
potential, )21 V; focusing potential, )340 V; entrance
potential, )10.5 V.
LC-MS ⁄ MS (negative MRM mode): collision gas N2,
collision gas setting 9, transitions 338 ⁄ 178 (quantifier),
338 ⁄ 106, 338 ⁄ 149 (CEdG), 266 ⁄ 150 (quantifier), 266 ⁄ 133,
266 ⁄ 108 (dG), scan time 150 ms per mass transition. For
the MRM method, six different collision energies between
–20 V and )50 V were used, so that maximum intensity
was achieved for each fragment ion.
DNA extraction from HSC-T6 cells
After incubation, the confluent cells of 10 tissue culture
flasks were scraped and combined in one 15 mL reaction
tube. DNA was extracted by a modified chaotropic method
[32]. After centrifugation (1700 g, 4 °C, 5 min), 1.5 mL of
lysis buffer A [320 mm saccharose, 5 mm MgCl2Ỉ6H2O,
10 mm Tris, 1% Triton X-100 (Fluka), pH adjusted to 7.5
with 1 m HCl] was added to the pellet. The mixture was
shaken vigorously and centrifuged (10 min, 1500 g, 4 °C).
This step was repeated once. Next, 35 lL of 10% SDS
(Fluka) and 600 lL of buffer B (10 mm Tris, 5 mm
Na2-EDTA, pH adjusted to 8.0 with 1 m NaOH) were
added to the pellet and shaken vigorously. After centrifugation (5 min, 1500 g, 4 °C), the supernatant was incubated
with 15 lL of RNase A ⁄ T1-Mix (Fermentas, St Leon-Rot,
Germany; 75 U, 15 min, 50 °C) and 30 lL of proteinase K
(Fermentas; 600 lg, 60 min, 37 °C). In the next step,
1.2 mL of NaI (7.6 m) and 2 mL of isopropanol were
added, and the DNA was precipitated by shaking carefully.
After centrifugation (15 min, 5000 g, 4 °C), the pellet was
washed with 1 mL of isopropanol (40%), centrifuged
(15 min, 5000 g, 4 °C), washed again with 1 mL of ethanol
(70%), centrifuged again (15 min, 5000 g, 4 °C), and air
dried. The DNA was then dissolved in 100 lL of water and
subjected to enzymatic hydrolysis.
Enzymatic DNA hydrolysis
For enzymatic DNA hydrolysis, a modified protocol
according to Crain [33] was used. After addition of 10 lL
of ammonium acetate buffer (0.1 m, pH 5.3) and 10 lL of
S1 nuclease EC 3.1.30.1 (Fermentas) (10 U), the samples
were incubated for 2 h at 45 °C. Then, 10 lL of ammonium bicarbonate buffer (1 m, pH 8.0) and 10 lL of
922
phosphodiesterase EC 3.1.4.1 (Sigma-Aldrich, Munich,
Germany; 0.008 U) were added and incubated for 2 h at
37 °C. Finally, the samples were incubated with alkaline
phosphatase EC 3.1.3.1 (1 U; Fluka) for 1 h at 37 °C and
centrifuged through a 10 kDa cut-off filter (Nanosep spin
columns; Pall Life Science, Dreieich, Germany) for 10 min
at 14 000 g to remove the enzymes. The combined filtrates
were frozen immediately, stored at )21 °C, and lyophilized
directly before LC-MS ⁄ MS analysis. Storage of the hydrolyzed samples for more than 24 h at room temperature or
for several days at 4 °C can lead to overestimation of the
CEdG concentration.
LC-MS ⁄ MS measurement
The dry samples were resolved in 70 lL of water, 50 lL of
which was injected into the LC-MS ⁄ MS instrument.
CEdGA,B and dG were identified by their retention times as
well as by their specific mass transitions. The detection limit
for CEdGA,B was about 0.5 ngỈmL)1 in the solution that
was injected into the HPLC. The relative glycation rate was
determined by the ratio of the peak area of CEdGA,B and
dG. The glycation rate of the lowest control was set to
100%.
Cell culture
Hepatic stellate cells (HSC-T6) were incubated in growth
media (MEM; Biochrom, Berlin, Germany) with Earle’s
salts containing 20% fetal bovine serum (Biochrom) and
1% penicillin ⁄ streptomycin solution (10 000 ImL)1;
Biochrom). For each experiment, 10 tissue culture flasks
(75 cm2) were used. The growth medium was removed from
the confluent cells. The cells were washed twice with
NaCl ⁄ Pi for cell culture (Biochrom). Half of the cells were
harvested immediately, combined, washed three times with
NaCl ⁄ Pi, and stored frozen for further analysis. The other
half of the cells were incubated with 10 mL of reduced
medium [MEM with Earle’s salts containing 1% fetal
bovine
serum
and
1%
penicillin ⁄ streptomycin
(10 000 ImL)1)] per flask for 14 days. After the incubation time, cells were harvested by scraping, and the medium
was removed by centrifugation. The cell pellets of the samples were combined and washed three times with NaCl ⁄ Pi.
The experiment was performed in duplicate.
HEK 293 T cells were cultured in MEM with Earle’s
salts supplemented with 10% fetal bovine serum, 1% l-glutamine (200 mm; PAA Coelbe, Germany) and 1% penicillin ⁄ streptomycin (10 000 E, 10 000 lgỈlL)1) at 37 °C in a
humidified atmosphere containing 5% CO2.
Plasmid DNA preparation
The plasmid pGL3 Control (Promega, Mannheim,
Germany) was amplified in the competent E. coli strain
FEBS Journal 275 (2008) 914–925 ª 2008 The Authors Journal compilation ª 2008 FEBS
V. Breyer et al.
JM 109, and DNA was extracted using a commercial
purification kit (Jetstar Plasmid Kit; Genomed, Loehne,
Germany) according to the manufacturer’s instructions. Purified plasmid DNA was checked by gel
electrophoresis after restriction endonuclease digestion
and quantified by absorbance measurement (260 and
280 nm).
Treatment of plasmid DNA with DHA
For the introduction of CEdG, 0.1 lgỈlL)1 of the reporter
vector pGL3 Control plasmid was incubated with 100 lm,
1 mm or 5 mm DHA (VWR International, Darmstadt,
Germany), respectively, in NaCl ⁄ Pi (pH 7.4) at 70 °C for
9 h. Samples were taken every 3 h. Modified vectors
derived by incubation with 100 lm DHA were diluted
1 : 2 in NaCl ⁄ Pi, and samples of the incubation mixtures
containing 1 mm and 5 mm DHA were diluted 1 : 7 prior
to ELISA measurement. To remove DHA, plasmid DNA
was precipitated with isopropanol and resolved in H2O to
a final concentration of 1 lgỈlL)1. The unmodified plasmid was treated in the same way, but in the absence of
DHA.
Competitive ELISA for CEdG
The formation of CEdG modifications of plasmid DNA
was monitored by ELISA. Ninety-six-well microtiter
plates were coated with 100 lL per well of a carboxyethylguanine ⁄ BSA solution (0.2 lgỈmL)1 BSA conjugate
in 0.2 m sodium carbonate buffer, pH 9.7) at 4 °C overnight. The plates were washed twice with washing
buffer [1 mm KH2PO4, 7 mm K2HPO4, 15 mm NaCl,
0.02 mm potassium sorbate, and 0.05% (v ⁄ v) Tween-20
(Sigma-Aldrich)] after each step. Unspecific binding was
minimized by blocking the wells for 1.5 h at room
temperature with 150 lL per well of skimmed milk
powder (Fluka) in water (3%). Aliquots of 50 lL of the
sample as well as 50 lL of the mAb M-5.1.6 [13] diluted
1 : 100 in diluting buffer [0.2% BSA (Sigma-Aldrich) and
0.05% Tween-20 in NaCl ⁄ Pi] were added per well and
incubated for 1 h at room temperature. Labeling was performed with anti-(mouse IgG) horseradish peroxidase
conjugate (Sigma-Aldrich) diluted 1 : 2500 in NaCl ⁄ Pi
containing 1 mgỈmL)1 BSA. The plates were incubated
for 45 min at room temperature. After the plates had
been washed three times, antibody binding was detected
using 100 lL of 3,3¢,5,5¢-tetramethylbenzidine dihydrochloride solution (TMB) (Sigma-Aldrich). The reaction
was stopped after 15 min by adding 25 lL of 1 m sulfuric acid. The absorbance was measured at 450 nm. The
concentrations of carboxyethyl-modified nucleobases were
calculated from a calibration curve using CEdGA,B as a
standard.
DNA advanced glycation end-products in cells
Transient transfection
All transient transfection experiments were carried out in sixwell multi-dishes. HEK 293 T cells were seeded 24 h before
transfection at 5 · 105 cells per well. Transfection of CEdGmodified plasmid DNA was performed using calcium phosphate precipitation [34]. Cells were transfected with 3 lg per
well of DHA-treated plasmid DNA and cotransfected with
2 lg per well of an unmodified pSV–b-galactosidase (Promega) plasmid to determine the transfection efficiency. After
transfection, cells were grown for 48 h at 37 °C. For the
determination of b-galactosidase and luciferase activity in
transfected cells, a b-galactosidase and a luciferase reporter
gene assay were used (both Roche Applied Science, Mannheim, Germany). Both assays were conducted following the
manufacturer’s instructions. Relative luciferase activities
were defined as the ratio of the firefly luciferase to the
b-galactosidase value of each sample relative to the mean
value of unmodified pGL3 Control vector. All assays were
carried out in triplicate. Data were reported as mean ± standard deviation. In all cases, statistical comparison was done
between the plasmids just after adding DHA (0 h) and the
plasmid after an incubation time of 3 h, 6 h, or 9 h, respectively. Statistical analyses were performed using the unpaired
Student’s t-test. The significance level was set to P < 0.05.
Cytotoxic effect on transfected HEK 293 T cells
CEdG-modified and unmodified plasmid DNA was transfected into HEK 293 T cells using calcium phosphate precipitation. After 24 h, Tryptan blue was added, and the
number of viable cells was determined using a Neubauer
counting chamber.
Transformation of DNA to a bacterial host
CEdG adducts were introduced into the vector pGL3 Control by incubation of 0.1 lgỈmL)1 plasmid and 5 mm DHA
for 0, 3, 6 and 9 h at 70 °C. At each point, aliquots of
50 lL were taken for further analysis. The samples were
purified by isopropanol precipitation. To ensure equal
amounts in the electroporation mixtures, the concentration
after isopropanol precipitation was determined by UV spectrometry. Quantities of 100 ng of each sample as well as
100 ng of the unmodified control vector were added to
50 lL of the electrocompetent bacterium E. coli JM 109.
Electroporation was performed at 240 V. An aliquot of
1 mL of 2 · tryptan yeast medium (TY; Roth, Karlsruhe,
Germany) was then added per cuvette and incubated for
45 min at 37 °C. Finally, 10 lL, 20 lL and 50 lL of each
sample was plated on ampicillin-supplemented 2 · TY
plates. Colonies were counted after an overnight incubation
at 37 °C. In parallel, transformation assays were plated on
2 · TY plates (without ampicillin) to analyze cell viability.
FEBS Journal 275 (2008) 914–925 ª 2008 The Authors Journal compilation ª 2008 FEBS
923
DNA advanced glycation end-products in cells
V. Breyer et al.
Restriction digestion of CEdG-modified plasmids
References
CEdG-modified pGL3 Control vector was produced by a
9 h treatment with 5 mm DHA. Aliquots of 0.5 lg of
CEdG-modified and unmodified vector were incubated in
parallel with restriction endonucleases NcoI, AfeI, MluI,
BspMI, BspHI, and PvuI, respectively (NEB, Ipswich,
USA). The digests were incubated overnight at 37 °C, and
fragments were separated by 1% agarose gel electrophoresis.
1 Maillard LC (1912) Action des acides amines sur les
`
´
sucres; formation de melanoides par voie methodique.
C R Acad Sci 154, 66–68.
2 Koening R, Blobstein S & Cerami A (1977) Structure
of carbohydrate of hemoglobin A1c. J Biol Chem 252,
2992–2997.
3 Vlassara H, Bucala R & Striker L (1994) Pathogenic
effects of advanced glycosylation: biochemical, biological, and clinical implications for diabetes and aging.
Lab Invest 70, 138–151.
4 Park L, Raman KG, Lee KJ, Lu Y, Ferran LJJ, Chow
WS, Stern D & Schmidt AM (1998) Suppression of
accelerated diabetic atherosclerosis by the soluble receptor for advanded glycation endproducts. Nat Med 4,
1025–1031.
5 Singh R, Barden A, Mori T & Beilin L (2001)
Advanced glycation end-products: a review. Diabetologia 44, 129–146.
6 Knerr T & Severin T (1993) Reaction of glucose with
guanosine. Tetrahedron Lett 34, 7389–7390.
7 Lee A & Cerami A (1987) The formation of reactive
intermediate(s) of glucose 6-phosphate and lysine capable of rapidly reacting with DNA. Mutat Res 179, 151–
158.
8 Ochs S & Severin T (1994) Reaction of 2¢-deoxyguanosine with glyceraldehyde. Liebigs Ann Chem 851–853.
9 Seidel W & Pischetsrieder M (1998) DNA-glycation
leads to depurination by the loss of N2-carboxyethylguanine in vitro. Cell Mol Biol (Noisy-le-grand) 44,
1165–1170.
10 Larisch B, Pischetsrieder M & Severin T (1997) Formation of guanosine adducts from L-ascorbic acid under
oxidative conditions. Bioorg Med Chem Lett 7, 2681–
2686.
11 Seidel W & Pischetsrieder M (1998) Immunochemical
detection of N2-[1-(1-carboxy)ethyl]guanosine, an
advanced glycation end product formed by the reaction
of DNA and reducing sugars or L-ascorbic acid
in vitro. Biochim Biophys Acta 1425, 478–484.
12 Frischmann M, Bidmon C, Angerer J & Pischetsrieder
M (2005) Identification of DNA adducts of methylglyoxal. Chem Res Toxicol 18, 15861592.
13 Schneider M, Thoss G, Hubner-Parajsz C, Kientschă
Engel R, Stahl P & Pischetsrieder M (2004) Determination of glycated nucleobases in human urine by a new
monoclonal antibody specific for N2-carboxyethyl-2¢deoxyguanosine. Chem Res Toxicol 17, 1385–1390.
14 Li H, Nakamura S, Miyazaki S, Morita T, Suzuki M,
Pischetsrieder M & Niwa T (2006) N2-carboxyethyl-2¢deoxyguanosine, a DNA glycation marker, in kidneys
and aortas of diabetic and uremic patients. Kidney Int
69, 388–392.
RNA isolation and RT-PCR
HEK 293 T cells were transfected with CEdG-modified and
unmodified pGL3 Control vector, respectively, and cotransfected with pSV–b-galactosidase plasmid for normalization.
As control, mock transfections were performed by transfecting the b-galactosidase plasmid only. RNA was isolated
24 h after transfection using a peqGOLD RNAPureTM
extraction kit (Peqlab, Erlangen, Germany). The isolated
RNA was dissolved in 30 lL of nuclease-free water (Biorad,
Munich, Germany). RNA concentrations were determined
by UV measurement. RNA was treated with DNAse I
(Fermentas) and purified with phenol ⁄ chloroform prior to
reverse transcription. Five micrograms of RNA were reverse
transcribed using an iScriptTM cDNA Synthesis Kit (Biorad)
according to the manufacturer’s instructions. cDNA was
diluted 1 : 5 and used as a template for PCR to quantify
luciferase and b-galactosidase expression levels. cDNA quality was assayed by a b-actin PCR. The primers used were as
follows: b-actin – hsbact-S3-391 (5¢-TGA GAC CTT CAA
CAC CCC AG-3¢) and hsbact-A5-1046 (5¢-CAT CTG CTG
GAA GGT GGA CA-3¢); b-galactosidase – b_Gal_F (5¢AAT CGT CTG ACC GAT GAT CC-3¢) and b_Gal_R
(5¢-CGG ATA AAC GGA ACT GGA AA-3¢); and luciferase – Luci_F (5¢-TAT CCG CTG GAA GAT GGA AC-3¢)
and Luci_1R (5¢-TTT CTT GCG TCG AGT TTT CC-3¢).
Samples of 250 ng were amplified using 30 cycles of denaturing for 30 s at 96 °C, annealing for 30 s at 60 °C, and
extension for 1 min at 72 °C. PCR products were analyzed
on 1.5% agarose gels. Expression levels were determined by
semiquantification of gel bands using image j (http://rsb.
info.nih.gov/ij/). Luciferase levels were normalized to the
b-galactosidase value. Experiments were carried out in
duplicate.
Acknowledgements
We thank Dr Kristina Becker, Dr Kseniya Kashkevich, Barbara Orlicz-Welcz and Rosa Weber for technical support and helpful advice. AS was supported by
the Interdisciplinary Center for Clinical Research
(IZKF) at the University Hospital of the University of
Erlangen-Nuremberg Project D3 (Prof Dr C.-M.
Becker, Dr Strissel).
924
FEBS Journal 275 (2008) 914–925 ª 2008 The Authors Journal compilation ª 2008 FEBS
V. Breyer et al.
15 Nakamura S, Li H, Adijiang A, Pischetsrieder M &
Niwa T (2007) Pyridoxal phosphate prevents progression of diabetic nephropathy. Nephrol Dial Transplant
22, 2165–2174.
16 Pischetsrieder M, Seidel W, Munch G & Schinzel R
(1999) N(2)-(1-Carboxyethyl)deoxyguanosine, a nonenzymatic glycation adduct of DNA, induces single-strand
breaks and increases mutation frequencies. Biochem
Biophys Res Commun 264, 544–549.
17 Eriksson UJ, Wentzel P, Minhas HS & Thornalley PJ
(1998) Teratogenicity of 3-deoxyglucosone and diabetic
embryopathy. Diabetes 47, 1960–1966.
18 Shires TK, Tresnak J, Kaminsky M, Herzog SL &
Truc-Pham B (1990) DNA modification in vivo by
derivatives of glucose: enhancement by glutathione
depletion. FASEB J 4, 3340–3346.
19 Vaca CE, Nilson JA, Fang JL & Grafstrom RC (1998)
ă
Formation of DNA adducts in human buccal epithelial
cells exposed to acetaldehyde and methylglyoxal
in vitro. Chem Biol Interact 108, 197–208.
20 Schneider M, Georgescu A, Bidmon C, Tutsch M,
Fleischmann EH, Popov D & Pischetsrieder M (2006)
Detection of DNA-bound advanced glycation endproducts by immunoaffinity chromatography coupled to
HPLC-diode array detection. Mol Nutr Food Res 50,
424–429.
21 Bidmon C, Frischmann M & Pischetsrieder M (2007)
Analysis of DNA-bound advanced glycation endproducts by LC and mass spectrometry. J Chromatogr
B Analyt Technol Biomed Life Sci 855, 51–58.
22 Rao KS (1993) Genomic damage and its repair in
young and aging brain. Mol Neurobiol 7, 23–48.
23 Rao KS & Loeb LA (1992) DNA damage and
repair in brain: relationship to aging. Mutat Res 275,
317–329.
24 Randerath K, Zhou GD, Hart RW, Turturro A &
Randerath E (1993) Biomarkers of aging: correlation of
DNA I-compound levels with median lifespan of calorically restricted and ad libitum fed rats and mice. Mutat
Res 295, 247–263.
DNA advanced glycation end-products in cells
25 Thornalley PJ (2003) Protecting the genome: defence
against nucleotide glycation and emerging role of glyoxalase I overexpression in multidrug resistance in cancer
chemotherapy. Biochem Soc Trans 31, 1372–1377.
26 Baynes JW (2002) The Maillard hypothesis on aging:
time to focus on DNA. Ann NY Acad Sci 959, 360–367.
27 Bucala R, Lee A, Rourke L & Cerami A (1993) Transposition of an Alu-containing element induced by
DNA-advanced glycosylation endproducts. Proc Natl
Acad Sci USA 90, 2666–2670.
28 Murata-Kamiya N, Kamiya H, Kaji H & Kasai H
(1997) Glyoxal, a major product of DNA oxidation,
induces mutations at G:C sites on a shuttle vector plasmid replicated in mammalian cells. Nucleic Acids Res
25, 1897–1902.
29 Murata-Kamiya N, Kamiya H, Kaji H & Kasai H
(2000) Methylglyoxal induces G:C to C:G and G:C to
T:A transversions in the supF gene on a shuttle vector
plasmid replicated in mammalian cells. Mutat Res 468,
173–182.
30 Seidel W & Pischetsrieder M (1998) Reaction of guanosine with glucose under oxidative conditions. Bioorg
Med Chem Lett 8, 2017–2022.
31 Levy MS, Lotfian P, O’Kennedy R, Lo-Yim MY &
Shamlou PA (2000) Quantitation of supercoiled circular
content in plasmid DNA solutions using a fluorescencebased method. Nucleic Acids Res 28, E57.
32 Ravanat JL, Douki T, Duez P, Gremaud E, Herbert K,
Hofer T, Lasserre L, Saint-Pierre C, Favier A & Cadet
J (2002) Cellular background level of 8-oxo-7,8-dihydro-2¢-deoxyguanosine: an isotope based method to
evaluate artefactual oxidation of DNA during its
extraction and subsequent work-up. Carcinogenesis 23,
1911–1918.
33 Crain P (1990) Preparation and enzymatic hydrolysis of
DNA and RNA for mass spectrometry. Methods
Enzymol 193, 783–790.
34 Chen C & Okayama H (1987) High-efficiency transformation of mammalian cells by plasmid DNA. Mol Cell
Biol 7, 2745–2752.
FEBS Journal 275 (2008) 914–925 ª 2008 The Authors Journal compilation ª 2008 FEBS
925