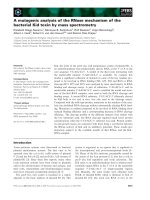
Báo cáo khoa học: A comparative analysis of the transcriptome and signal pathways in hepatic differentiation of human adipose mesenchymal stem cells doc
Bạn đang xem bản rút gọn của tài liệu. Xem và tải ngay bản đầy đủ của tài liệu tại đây (1.04 MB, 14 trang )
A comparative analysis of the transcriptome and signal
pathways in hepatic differentiation of human adipose
mesenchymal stem cells
Yusuke Yamamoto
1,2,
*, Agnieszka Banas
1,
*, Shigenori Murata
3
, Madoka Ishikawa
3
, Chun R. Lim
3
,
Takumi Teratani
1
, Izuho Hatada
4
, Kenichi Matsubara
3
, Takashi Kato
2
and Takahiro Ochiya
1,2
1 Section for Studies on Metastasis, National Cancer Center Research Institute, Tokyo, Japan
2 Graduate School of Science and Engineering, Waseda University, Tokyo, Japan
3 DNA Chip Research Inc., Yokohama, Japan
4 Laboratory of Genome Science, Biosignal Genome Resource Center, Department of Molecular and Cellular Biology, Gunma University,
Maebashi, Japan
Mesenchymal stem cells (MSCs) are the most promis-
ing candidates with respect to clinical applications in
regenerative medicine. MSCs were first isolated from
bone marrow cells by simple plating on plastic dishes
[1]. Further studies demonstrated evidence of their
presence in adipose tissue [2,3], scalp tissue [4], pla-
centa [5], amniotic fluid and umbilical cord blood [6],
as well as in various fetal tissues [7]. Importantly, these
stem cells can differentiate in vitro into multiple types
of cells, including chondrocytes, osteocytes, adipocytes
[8], myocytes [9], neurons [10] and hepatocytes,
depending on the appropriate stimuli and microenvi-
ronment. MSCs are promising candidates for liver
regeneration [11,12], because their usage might over-
come obstacles such as ethical concerns and the risks
of rejection in cell transplantation therapy.
Keywords
adipose tissue; gene ontology; hepatocyte
differentiation; mesenchymal stem cell;
microarray
Correspondence
T. Ochiya, Section for Studies on
Metastasis, National Cancer Center
Research Institute, 1-1 Tsukiji 5-chome,
Chuo-ku, Tokyo 104-0045, Japan
Fax: +81 3 3541 2685
Tel: +81 3 3542 2511(ext 4452)
E-mail:
*These authors contributed equally to this
work
(Received 30 October 2007, revised 26
December 2007, accepted 10 January 2008)
doi:10.1111/j.1742-4658.2008.06287.x
The specific features of the plasticity of adult stem cells are largely
unknown. Recently, we demonstrated the hepatic differentiation of human
adipose tissue-derived mesenchymal stem cells (AT-MSCs). To identify the
genes responsible for hepatic differentiation, we examined the gene expres-
sion profiles of AT-MSC-derived hepatocytes (AT-MSC-Hepa) using
several microarray methods. The resulting sets of differentially expressed
genes (1639 clones) were comprehensively analyzed to identify the path-
ways expressed in AT-MSC-Hepa. Clustering analysis revealed a striking
similarity of gene clusters between AT-MSC-Hepa and the whole liver,
indicating that AT-MSC-Hepa were similar to liver with regard to gene
expression. Further analysis showed that enriched categories of genes and
signaling pathways such as complementary activation and the blood clot-
ting cascade in the AT-MSC-Hepa were relevant to liver-specific functions.
Notably, decreases in Twist and Snail expression indicated that mesenchy-
mal-to-epithelial transition occurred in the differentiation of AT-MSCs into
hepatocytes. Our data show a similarity between AT-MSC-Hepa and the
liver, suggesting that AT-MSCs are modulated by their environmental con-
ditions, and that AT-MSC-Hepa may be useful in basic studies of liver
function as well as in the development of stem cell-based therapy.
Abbreviations
ABC transporter, ATP binding cassette transporter; AT-MSC, adipose tissue-derived mesenchymal stem cells; AT-MSC-Hepa, AT-MSC-
derived hepatocytes; CYP, cytochrome P450; EMT, epithelial-to-mesencyhmal transition; ES, embryonic stem; FGF, fibroblast growth factor;
GO, gene ontology; HGF, hepatocyte growth factor; HIFC, hepatic induction factor cocktail; HNF, hepatocyte nuclear facor; LDL, low-density
lipoprotein; MDR, multi-drug resistance; MET, mesencyhmal-to-epithelial transition; MSCs, Mesenchymal stem cells; OsM, oncostatin M;
TDO2, tryptophan 2,3-dioxygenase.
1260 FEBS Journal 275 (2008) 1260–1273 ª 2008 The Authors Journal compilation ª 2008 FEBS
Seo et al. were the first to show that human adipose
tissue-derived mesenchymal stem cells (AT-MSCs)
differentiate into hepatocyte-like cells upon treatment
with hepatocyte growth factor (HGF), oncostatin M
and dimethyl sulfoxide [13]. These cells expressed albu-
min and a-fetoprotein during differentiation and dem-
onstrated low-density lipoprotein (LDL) uptake and
production of urea. Further studies by Toles-Visconti
et al. also demonstrated the possibility of generating
hepatocyte-like cells from AT-MSCs [14]. Many inves-
tigators have since used MSCs to generate functional
hepatocytes; however, there are still questions regard-
ing cell fusion and poor functionality, which need to
be resolved before clinical use.
Based on a study of embryonic stem (ES) cell trans-
plantation, we have identified a growth factor combi-
nation [HGF and fibroblast growth factors 1 and 4
(FGF1 and FGF4)] to induce mouse ES cells to
develop into functional hepatocytes. These factors,
named HIFC (hepatic induction factor cocktail),
showed clearly up-regulated expression in an injured
liver [15]. Recently, using a modified hepatic differenti-
ation strategy for mouse ES cells, we have successfully
differentiated AT-MSCs to hepatocytes [16]. The cells
generated from AT-MSCs were transplantable hepato-
cyte-like cells with functional and morphological simi-
larities to hepatocytes. AT-MSC-derived hepatocytes
(AT-MSC-Hepa) demonstrated several liver-specific
markers and functions, such as albumin production,
LDL uptake and ammonia detoxification. However,
the molecular mechanisms underlying the differentia-
tion of AT-MSC are largely unknown. Our next goal
is to clarify the molecular events involved in control-
ling the plasticity of AT-MSCs that give rise to
hepatocytes. In this study, we show that the gene
expression pattern of AT-MSC-Hepa is similar to that
of adult human hepatocytes and liver by microarray
analysis. Moreover, the enriched categories of genes
and the signaling pathways in the AT-MSC-Hepa were
relevant to liver-specific functions.
Results
Microarray analysis of AT-MSC-Hepa
We previously established the HIFC differentiation sys-
tem, based on a study of ES cell transplantation into
CCl
4
-injured mouse liver [15]. The identified hepatic
induction factors (a combination of HGF, FGF1 and
FGF4) were clearly up-regulated in the injured mouse
liver. Using a modified HIFC differentiation system,
human AT-MSCs can be differentiated into hepato-
cytes in vitro within approximately 5 weeks [16]. This
novel system is reproducible and allows examination of
the molecular mechanisms underlying hepatic differen-
tiation from stem cells. For microarray analysis, we
confirmed the hepatic differentiation of AT-MSC into
hepatocyte-like cells using the original protocol
(Fig. 1A). The differentiated cells (AT-MSC-Hepa) had
a round epithelial cell-like shape (Fig. 1C), while undif-
ferentiated AT-MSCs showed a fibroblast-like mor-
phology (Fig. 1B). During the transition, contraction
of the cytoplasm progressed, and most of the treated
cells became quite dense and round with clear nuclei
(Fig. 1C). We checked albumin expression by immuno-
chemical staining to examine the cell population of
AT-MSC-Hepa for microarray analysis. This analysis
showed that the AT-MSC-Hepa cell population was
almost totally homogeneous ([16], and data not shown).
Furthermore, glycogen storage was also observed
in AT-MSC-Hepa by periodic acid-Schiff staining
(Fig. 1E), but such staining was only weakly positive in
undifferentiated AT-MSCs (Fig. 1D). In order to con-
firm the hepatic induction of AT-MSCs, we analyzed
genes related to hepatic differentiation by microarray
analyses performed using total RNA from undifferen-
tiated AT-MSCs, AT-MSC-Hepa, human primary
hepatocytes and human liver. The profile for undiffer-
entiated AT-MSCs was compared to that of AT-MSC-
Hepa. Of the 25 721 genes analyzed, 1639 showed a
significant ‡ 10-fold alteration of the expression level,
indicating that the expression levels of these genes were
regulated by hepatic induction factors.
Of the 1639 genes with a ‡ 10-fold alteration in
expression, 1252 genes were up-regulated (supplemen-
tary Table S1), and 387 were down-regulated (supple-
mentary Table S2). Up-regulated genes belonged to
families of metabolic enzymes, such as alcohol dehy-
drogenase, UDP glucuronosyltransferase and serine
protease inhibitor, and liver marker genes, such as
glucose-6-phosphatase and keratin 8 (supplementary
Table S1). Additionally, the gene expression levels of
hepatocyte marker genes [albumin, tryptophan 2,3-
dioxygenase (TDO2), transthyretin and keratin 18] and
liver-specific transcription factors such as FOXA2
[hepatocyte nuclear factor (HNF) 3b] and ONECUT 1
(HNF6) were also up-regulated (Fig. 2). These data
indicate that hepatocyte-related genes are considerably
up-regulated in AT-MSC-Hepa, human hepatocytes
and human liver when compared with undifferentiated
AT-MSCs. We also focused on genes that are responsi-
ble for basic functions of hepatocytes (Table 1). Cyto-
chrome P450 genes, including CYP2A6, CYP2C8 and
CYP3A4, and ABC transporter genes such as MDR1
(multi-drug resistance), which play an important role
in drug metabolism and detoxification, are highly
Y. Yamamoto et al. Transcriptome in hepatic induction of AT-MSCs
FEBS Journal 275 (2008) 1260–1273 ª 2008 The Authors Journal compilation ª 2008 FEBS 1261
induced by hepatic differentiation treatment of AT-
MSCs. A number of genes encoding a blood coag-
ulation factor, a complement component and a
component of the extracellular matrix, which are
involved in hepatocyte maintenance and functionality,
were also up-regulated. Genes that were down-regu-
lated genes after hepatic differentiation of AT-MSCs
include cyclin B2 and E2F1 (supplementary Table S2),
which are responsible for cell-cycle control. Together,
the results suggest that HIFC treatment induced
A
BC
D E
Fig. 1. Hepatic differentiation of human
AT-MSC. (A) Schematic illustration outlining
the differentiation protocol. The CD105
+
fraction was isolated from whole fraction of
AT-MSCs of using CD105-coupled magnetic
microbeads. These cells were treated with
HGF (150 ngÆmL
)1
), FGF1 (300 ngÆmL
)1
) and
FGF4 (25 ngÆmL
)1
) for 3 weeks, and with
oncostatin M (30 ngÆmL
)1
) and dexametha-
sone (2 · 10
5
molÆL
)1
) for the next 2 weeks.
(B,C) Phase-contrast micrographs of
undifferentiated CD105
+
AT-MSCs and
AT-MSC-Hepa, respectively. (D,E) Periodic
acid-Schiff staining of undifferentiated
CD105
+
AT-MSCs and AT-MSC-Hepa,
respectively. Scale bars = 50 l m.
Fig. 2. Comparison of the expression pat-
tern of selected liver-specific genes by
microarray analysis. Expression patterns of
ALB, transthyretin, TDO2, CK18,
HNF3b ⁄ FOXA2 and HNF6 ⁄ ONECUT1:
lane 1, undifferentiated AT-MSCs; lane 2,
human liver; lane 3, AT-MSC-Hepa; lane 4,
human primary hepatocytes. The expression
level of human hepatocytes was set to 1.0.
Transcriptome in hepatic induction of AT-MSCs Y. Yamamoto et al.
1262 FEBS Journal 275 (2008) 1260–1273 ª 2008 The Authors Journal compilation ª 2008 FEBS
Table 1. Liver function genes that were up-regulated in AT-MSC-Hepa.
Accession
number Description
Relative expression levels
AT-MSCs
AT-MSC-derived
hepatocytes
Human
liver
Human
hepatocytes
CYP450
AF355802 CYP3A5 mRNA, allele CYP3A5, exon 5B and partial
CDS, alternatively spliced
0.02 1.75 8.71 1.00
NM_031226 cytochrome P450, family 19, subfamily A, polypeptide 1,
transcript variant 2
0.05 5.51 0.13 1.00
NM_000762 cytochrome P450, family 2, subfamily A, polypeptide 6 0.05 0.61 493.31 1.00
NM_000770 cytochrome P450, family 2, subfamily C, polypeptide 8,
transcript variant Hp1-1
0.06 6.23 348.38 1.00
NM_000775 cytochrome P450, family 2, subfamily J, polypeptide 2 0.01 0.32 2.01 1.00
NM_000500 cytochrome P450, family 21, subfamily A, polypeptide 2 0.18 3.22 3.96 1.00
NM_057157 cytochrome P450, family 26, subfamily A, polypeptide 1,
transcript variant 2
0.02 0.42 1.85 1.00
NM_017460 cytochrome P450, family 3, subfamily A, polypeptide 4 0.01 1.72 16.75 1.00
NM_000765 cytochrome P450, family 3, subfamily A, polypeptide 7 0.01 10.04 5.38 1.00
NM_016593 cytochrome P450, family 39, subfamily A, polypeptide 1 0.02 0.96 4.27 1.00
NM_000779 cytochrome P450, family 4, subfamily B, polypeptide 1 0.65 21.02 1.20 1.00
NM_021187 cytochrome P450, family 4, subfamily F, polypeptide 11 0.02 0.25 3.92 1.00
NM_023944 cytochrome P450, family 4, subfamily F, polypeptide 12 0.01 0.16 1.77 1.00
NM_000896 cytochrome P450, family 4, subfamily F, polypeptide 3 0.04 1.25 10.45 1.00
NM_004820 cytochrome P450, family 7, subfamily B, polypeptide 1 0.09 1.55 4.67 1.00
NM_004391 cytochrome P450, family 8, subfamily B, polypeptide 1 0.01 0.63 24.42 1.00
ABC transporter
NM_173076 ATP-binding cassette, sub-family A, member 12,
transcript variant 1
0.56 6.28 1.37 1.00
NM_001089 ATP-binding cassette, sub-family A, member 3 0.01 0.33 0.13 1.00
NM_080284 ATP-binding cassette, sub-family A, member 6,
transcript variant 1
0.39 4.61 16.06 1.00
NM_000927 ATP-binding cassette, sub-family B, member 1 0.01 0.70 0.76 1.00
NM_003742 ATP-binding cassette, sub-family B, member 11 0.05 1.98 13.24 1.00
NM_018850 ATP-binding cassette, sub-family B, member 4,
transcript variant C
0.01 0.55 6.34 1.00
NM_033151 ATP-binding cassette, sub-family C, member 11,
transcript variant 2
0.03 0.31 9.81 1.00
NM_000392 ATP-binding cassette, sub-family C, member 2 0.02 0.29 0.79 1.00
NM_020038 ATP-binding cassette, sub-family C, member 3,
transcript variant MRP3B
0.02 0.35 0.81 1.00
NM_022436 ATP-binding cassette, sub-family G, member 5 0.02 0.80 2.59 1.00
Coagulation
NM_000506 coagulation factor II 0.01 0.35 2.83 1.00
NM_000133 coagulation factor IX 0.01 2.49 98.68 1.00
NM_000130 coagulation factor V 0.02 3.52 19.54 1.00
NM_000131 coagulation factor VII, transcript variant 1 0.02 1.05 12.16 1.00
NM_000504 coagulation factor X 0.07 0.82 6.36 1.00
NM_000128 coagulation factor XI, transcript variant 1 0.02 2.48 35.85 1.00
NM_000505 coagulation factor XII 0.02 0.25 9.25 1.00
NM_001994 coagulation factor XIII, B polypeptide 0.05 4.36 34.09 1.00
NM_000508 Fibrinogen a chain, transcript variant a-E 0.01 19.55 138.80 1.00
NM_005141 Fibrinogen b chain 0.01 4.41 27.34 1.00
NM_000509 Fibrinogen c chain, transcript variant c-A 0.01 5.72 17.75 1.00
NM_201553 Fibrinogen-like 1, transcript variant 4 0.01 1.40 6.20 1.00
Complement component
NM_015991 complement component 1, q subcomponent,
a polypeptide
0.16 8.98 116.43 1.00
Y. Yamamoto et al. Transcriptome in hepatic induction of AT-MSCs
FEBS Journal 275 (2008) 1260–1273 ª 2008 The Authors Journal compilation ª 2008 FEBS 1263
differentiation of AT-MSCs into cells with a gene
expression profile typical of mature hepatocytes.
To validate the results of the microarray analysis,
we selected several genes expressed in AT-MSCs and
analyzed them using real-time RT-PCR. The expres-
sion level of up-regulated genes such as albumin and
TDO2 was confirmed by this method, and this analysis
indicated the accuracy of the results regarding
Table 1. (Continued).
Accession
number Description
Relative expression levels
AT-MSCs
AT-MSC-derived
hepatocytes
Human
liver
Human
hepatocytes
NM_000491 complement component 1, q subcomponent,
b polypeptide
0.03 12.04 112.80 1.00
NM_000063 complement component 2 0.03 0.61 5.62 1.00
NM_000064 complement component 3 0.01 1.94 6.09 1.00
NM_000715 complement component 4 binding protein, a 0.01 1.23 23.89 1.00
NM_000716 complement component 4 binding protein,
b, transcript variant 1
0.01 0.25 3.24 1.00
NM_000592 complement component 4B 0.02 1.81 11.11 1.00
NM_001735 complement component 5 0.40 24.82 119.11 1.00
NM_000065 complement component 6 0.01 9.27 104.33 1.00
NM_000562 complement component 8, a polypeptide 0.03 0.71 61.32 1.00
NM_000066 complement component 8, b polypeptide 0.01 1.07 39.23 1.00
NM_001737 complement component 9 0.01 1.61 158.48 1.00
NM_000186 complement factor H, transcript variant 1 0.99 19.22 61.60 1.00
NM_002113 complement factor H-related 1 0.66 11.11 45.93 1.00
NM_005666 complement factor H-related 2 0.02 2.55 180.30 1.00
NM_021023 complement factor H-related 3 0.51 8.25 23.81 1.00
NM_006684 complement factor H-related 4 0.03 2.61 119.37 1.00
NM_030787 complement factor H-related 5 0.55 9.08 924.13 1.00
Lipid metabolism
NM_000039 apolipoprotein A-I 0.01 0.21 3.76 1.00
NM_001643 apolipoprotein A-II 0.01 0.36 2.27 1.00
NM_000384 apolipoprotein B 0.01 6.26 29.22 1.00
NM_001645 apolipoprotein C-I 0.01 0.42 3.37 1.00
NM_000483 apolipoprotein C-II 0.01 0.55 0.67 1.00
NM_001647 apolipoprotein D 0.66 808.87 1.20 1.00
NM_000041 apolipoprotein E 0.01 1.62 5.08 1.00
NM_001638 apolipoprotein F 0.07 1.11 361.43 1.00
NM_000042 apolipoprotein H 0.01 0.30 4.60 1.00
NM_001443 fatty acid binding protein 1, liver 0.01 2.17 9.56 1.00
NM_000236 lipase, hepatic 0.01 1.05 1.57 1.00
NM_139248 lipase, member H 0.01 0.66 0.02 1.00
NM_000237 lipoprotein lipase 0.58 314.81 17.32 1.00
NM_018557 Low-density lipoprotein-related protein 1B 0.71 41.48 1.40 1.00
NM_004525 Low-density lipoprotein-related protein 2 0.66 23.96 9.80 1.00
NM_015900 phospholipase A1 member A 0.20 7.46 23.23 1.00
NM_000300 phospholipase A2, group IIA 0.11 1.66 266.80 1.00
NM_005084 phospholipase A2, group VII 0.55 24.55 72.21 1.00
NM_032562 phospholipase A2, group XIIB 0.01 0.87 2.57 1.00
NM_014996 Phospholipase C-like 3 0.52 14.14 1.25 1.00
Matrix
NM_033380 Collagen, type IV, a5, transcript variant 2 6.07 68.67 17.94 1.00
NM_033641 Collagen, type IV, a6, transcript variant B 0.58 15.10 1.38 1.00
NM_030582 Collagen, type XVIII, a1, transcript variant 1 0.08 1.68 2.80 1.00
NM_198129 Laminin, a3, transcript variant 1 0.02 0.44 0.10 1.00
NM_005560 Laminin, a5 0.08 0.81 0.37 1.00
NM_005562 Laminin, c2, transcript variant 1 0.05 0.52 0.01 1.00
NM_000638 Vitronectin 0.04 1.00 7.18 1.00
Transcriptome in hepatic induction of AT-MSCs Y. Yamamoto et al.
1264 FEBS Journal 275 (2008) 1260–1273 ª 2008 The Authors Journal compilation ª 2008 FEBS
transcriptional regulation obtained in the microarray
experiments (data not shown).
Unsupervised clustering analysis of
AT-MSC-Hepa
Unsupervised hierarchical cluster analysis was per-
formed by sorting of 1639 altered genes (Fig. 3A). This
analysis of microarray data revealed a striking similar-
ity of gene clusters among AT-MSC-Hepa, primary
hepatocytes and human liver. This indicates that
AT-MSC-Hepa are similar to human hepatocytes with
respect to the gene expression pattern. Figure 3B
shows a cluster of genes that are up-regulated in
AT-MSC-Hepa, primary hepatocytes and human liver,
and includes a number of liver function genes; for
example, complement components, coagulation factors,
apolipoprotein. Other clusters of genes up-regulated in
AT-MSC-Hepa are also hepatocyte-specific (data not
shown). In addition, to assess robustness, bootstrap
re-sampling was performed with 100 iterations. A clus-
ter of AT-MSCs (lane 1) was a truly robust cluster,
with a bootstrap re-sampling value of approximately
100%, suggesting that the gene expression pattern
in AT-MSCs is significantly different from that in
AT-MSC-Hepa.
Taken together, hierarchical clustering analysis of
the differentiated AT-MSCs indicates a very similar
gene expression pattern to that of primary hepatocytes
and a different pattern from that of AT-MSCs.
BA
Fig. 3. Unsupervised hierarchical analysis of 1639 gene expression profiles. (A) Data were subjected to hierarchical cluster analysis using an
Euclidean distance calculation based on Ward method. Lane 1, undifferentiated AT-MSCs; lane 2, human liver; lane 3, AT-MSC-Hepa; lane 4,
human primary hepatocytes. Samples are linked by the dendrogram above to show the similarity of their gene expression patterns. The
expression profile of each gene is represented in the respective rows. Genes are linked by the dendrogram on the left to show the similarity
in their expression patterns. Bootstrap re-sampling was performed with 100 iterations. Red, black and green represent high, middle and low
expression levels, respectively. The expression level of each gene in the human primary hepatocyte sample was set to 1.0. (B) Representa-
tive gene cluster chosen to show that hepatic function-related genes are up-regulated in human liver, AT-MSC-Hepa and human primary
hepatocytes.
Y. Yamamoto et al. Transcriptome in hepatic induction of AT-MSCs
FEBS Journal 275 (2008) 1260–1273 ª 2008 The Authors Journal compilation ª 2008 FEBS 1265
Gene ontology (GO) classification
of AT-MSC-Hepa
Using a database, the microarray analysis data were
integrated to identify the gene ontology (GO) biological
processes for the up- and down-regulated genes. This
analysis indicated that GO groups were highly signi-
ficant for up- and down-regulated genes compared with
the parent population (Table 2). The probabilities of
observing such a high number of genes in these cate-
gories by chance were extremely small, ranging from
8.9 · 10
)24
to 6.4 · 10
)3
. In up-regulated genes, most
of these GO groups, such as those relating to blood
coagulation, lipid metabolism and fibrinolysis, are rele-
vant to hepatocyte function, suggesting that AT-MSCs
undergo precise hepatic induction. Therefore, the
enrichment of liver function genes in AT-MSC-Hepa
was statistically significant. In contrast, for example,
the gene categories relating to cell cycle and orga-
nelle localization were significantly down-regulated in
AT-MSC-Hepa. This indicates that the cell prolifera-
tion rate of AT-MSCs decreases during hepatic differ-
entiation. Thus, the results of GO analysis suggest that
AT-MSC-Hepa have numerous hepatocyte functions
compared with undifferentiated AT-MSCs.
Gene signaling pathways in AT-MSC-Hepa
Elucidating the gene network pathway functioning in
AT-MSC-Hepa is very important to reveal the pro-
cesses of hepatic induction and maintenance of the
hepatocyte function. Recently, we developed a new
microarray system, ConPath (‘concise pathway’, con-
path.dna-chip.co.jp ⁄ ), to analyze biological pathways.
This microarray system also enables us to re-evaluate
data obtained using the Agilent microarray. The
probes on the ConPath Chip represent genes that are
found in the pathways contributed to the genmapp
database (see Experimental procedures). These biologi-
cal pathways are established pathways contributed by
the biological community and serve as a good refer-
ence to evaluate microarray data in the context of
biological functions and pathways. Expression ratios
of AT-MSC-Hepa, undifferentiated AT-MSCs and
human liver relative to human primary hepatocytes,
obtained using the ConPath microarray, were further
Table 2. Significance of gene ontology category appearance for the up- and down-regulated genes in AT-MSC-Hepa.
GO term
Cluster
frequency
a
Percentage
Sample frequency
of use
b
Percentage P value
c
Up-regulated genes
Inflammatory response 64 ⁄ 739 8.66 227 ⁄ 12 441 1.82 8.88E-24
Complement activation 22 ⁄ 739 2.98 33 ⁄ 12 441 0.27 1.02E-16
Innate immune response 24 ⁄ 739 3.25 59 ⁄ 12 441 0.47 9.70E-12
Blood coagulation 25 ⁄ 739 3.38 78 ⁄ 12 441 0.63 1.58E-09
Adaptive immune response 17 ⁄ 739 2.30 43 ⁄ 12 441 0.35 1.46E-07
Response to chemical stimulus 49 ⁄ 739 6.63 326 ⁄ 12 441 2.62 1.83E-06
Circulation 22 ⁄ 739 2.98 99 ⁄ 12 441 0.80 7.16E-05
Hormone metabolism 15 ⁄ 739 2.03 48 ⁄ 12 441 0.39 7.64E-05
Lipid metabolism 64 ⁄ 739 8.66 539 ⁄ 12 441 4.33 8.74E-05
Steroid metabolism 26 ⁄ 739 3.52 135 ⁄ 12 441 1.09 0.0001
Cytolysis 8 ⁄ 739 1.08 15 ⁄ 12 441 0.12 0.00083
Response to xenobiotic stimulus 10 ⁄ 739 1.35 25 ⁄ 12 441 0.20 0.00093
Carboxylic acid metabolism 48 ⁄ 739 6.50 392 ⁄ 12 441 3.15 0.00167
Nitrogen compound metabolism 42 ⁄ 739 5.68 330 ⁄ 12 441 2.65 0.00287
Fibrinolysis 6 ⁄ 739 0.81 9 ⁄ 12 441 0.07 0.00389
Down-regulated genes
Cell division 31 ⁄ 215 14.42 178 ⁄ 12 441 1.43 9.28E-20
Cell cycle 53 ⁄ 215 24.65 675 ⁄ 12 441 5.43 1.97E-18
Chromosome segregation 12 ⁄ 215 5.58 43 ⁄ 12 441 0.35 3.61E-09
Organelle localization 5 ⁄ 215 2.33 13 ⁄ 12 441 0.10 0.00122
Cytoskeleton organization and biogenesis 19 ⁄ 215 8.84 346 ⁄
12 441 2.78 0.0064
a
Of the genes analyzed, the GO biological process is known for 739 up-regulated genes and 215 down-regulated genes. Others are
unknown.
b
Of the genes in the mother population, the GO biological process is known for 12 441. Others are unknown.
c
The significance
of the appearance of the GO term (biological process) in the up-regulated and down-regulated genes was calculated as a P value by the soft-
ware GO Term Finder.
Transcriptome in hepatic induction of AT-MSCs Y. Yamamoto et al.
1266 FEBS Journal 275 (2008) 1260–1273 ª 2008 The Authors Journal compilation ª 2008 FEBS
analyzed using genmapp software version 2.1 and visu-
alized using ConPath Navigator, a tool that enables
viewing and searching of results obtained by genmapp
analysis (unpublished results; genmapp details avail-
able at ). Biological pathways
relating to liver function selected from the pathways in
this microarray are listed in Table 3. The number of
genes in each pathway that showed elevated expression
(fold change >1, log ratio) were compared with the
total number of genes in each pathway. The number
of genes up-regulated in AT-MSC-Hepa, when com-
pared with human hepatocytes, in each pathway was
similar to that of human liver, indicating that biologi-
cal pathways related to liver function are equivalent
between AT-MSC-Hepa and human liver (Table 3).
Noticeably, of the 20 genes in the blood clotting cas-
cade that are included on the chip, a total of 14 and
15 genes were elevated in AT-MSC-Hepa and human
liver, respectively (Table 3 and supplementary Fig. S1).
Furthermore, in the classical complementary activation
pathway (Fig. 4), the expression pattern of AT-MSC-
Hepa (Fig. 4b) was closer to that of human liver
(Fig. 4c) than to that of undifferentiated AT-MSC
(Fig. 4a). Likewise, the fatty acid omega oxidation and
steroid biosynthesis pathways were clearly up-regulated
in AT-MSC-Hepa, compared to undifferentiated AT-
MSCs (supplementary Figs S1 and S3). Therefore, this
analysis provided evidence that the majority of liver
functions are detected in AT-MSC-Hepa, as well as in
human hepatocytes and human liver.
Mesenchymal-to-epithelial transition
in AT-MSC-Hepa
Although AT-MSCs do indeed differentiate into hepa-
tocyte-like cells in vitro, concern remains about trans-
differentiation and its molecular mechanism. To
address the molecular basis of the transition of AT-
MSCs to a hepatic phenotype, we focused especially
on genes relating to the mesenchymal–epithelial transi-
tion (MET), the process that mesodermal cells (AT-
MSCs) undergo during differentiation to hepatocytes,
which have epithelial-like morphology. Microarray
data indicated that the expression levels of Twist [17]
and Snail [18], which are regulators of the epithelial–
mesenchymal transition (EMT), were down-regulated
during the differentiation process (Table 4). Further-
more, epithelial markers such as E-cadherin and
a-catenin were up-regulated in AT-MSC-Hepa. In
contrast, the expression of mesenchymal markers such
as N-cadherin and vimentin was down-regulated
(Table 4). During hepatic differentiation, morphologi-
cal modification from a fibroblastic shape in AT-MSC
to an epithelial cell-like morphology in AT-MSC-Hepa
was observed. These findings support the notion that
MET occurs in the process of hepatic differentiation
from AT-MSCs. Although further investigations are
required to elucidate the molecular mechanism of
transdifferentiation of AT-MSCs into hepatic cells, the
findings presented here suggest that MET might be a
pivotal factor in determining stem cell transdifferentia-
tion.
Discussion
AT-MSCs may be good candidates as stem cells for
cell transplantation and tissue engineering in regenera-
tive medicine, as a large number of AT-MSCs can be
obtained easily with minimal invasiveness by liposuc-
tion. Recently, we have produced mature hepatocytes
by direct differentiation of AT-MSCs, without the
necessity for co-culture with fetal or adult hepatocytes.
We have shown that our system induced transplantable
cells with morphological and functional characteristics
of hepatocytes [16]. Other groups have also provided
evidence of hepatic differentiation from human AT-
MSC [13,14]. None of the reports, however, provided
a comprehensive analysis of the process underlying the
differentiation of AT-MSCs into hepatocytes. In this
report, we clearly demonstrated the utility of micro-
array analysis in proving the hepatic differentiation of
AT-MSCs. Moreover, analysis of GO groups indicated
that many of the 1639 up- or down-regulated genes
belonged to GO categories relevant to hepatic
Table 3. Comparison of the number of genes up-regulated
a
in AT-
MSC-Hepa and human liver for each liver-related signal pathway.
Signal pathway
AT-MSC-
Hepa
Whole
liver
Number of
genes included
on ConPath chip
Blood clotting cascade 14 15 20
Complement activation,
classical pathway
12 16 17
Eicosanoid synthesis 14 12 19
Fatty acid omega oxidation 6 11 15
Glucocorticoid and
mineralcorticoid metabolism
469
Glutathione metabolism 11 9 20
Glycogen metabolism 7 12 36
Steroid biosynthesis 4 6 9
Synthesis and degradation
of ketone bodies
345
Urea cycle and metabolism
nof amino groups
8920
a
The expression level of the gene is higher (fold change > 1) com-
pared with the expression level in human hepatocytes (reference
sample).
Y. Yamamoto et al. Transcriptome in hepatic induction of AT-MSCs
FEBS Journal 275 (2008) 1260–1273 ª 2008 The Authors Journal compilation ª 2008 FEBS 1267
1 < log ratio
Legend: ConPath Defaul
t
0.5 < log ratio ≤ 1
0.3 < log ratio ≤ 0.5
–0.3 < log ratio ≤ 0.3
–0.5 < log ratio ≤ –0.3
–1 < log ratio ≤ –0.5
log ratio ≤ –1
No criteria met
Not found
Author: Nathan Salomonis
E-mail:
Last modified: 4/20/01
Copyright © 2001, Gladstone Institutes
A
B
C
Transcriptome in hepatic induction of AT-MSCs Y. Yamamoto et al.
1268 FEBS Journal 275 (2008) 1260–1273 ª 2008 The Authors Journal compilation ª 2008 FEBS
function, including steroid and lipid metabolism. In
addition, gene signaling pathway analysis has identi-
fied gene signals that are remarkably activated in
AT-MSC-Hepa, and these signals are also up-regulated
in whole liver. Therefore, the microarray analysis pro-
vides a potentially valuable resource for determination
of the key molecules involved in hepatocyte differentia-
tion and function. These integrative perspectives on
the gene expression profile might be useful for reveal-
ing the control of plasticity of AT-MSCs that give rise
to hepatocytes.
Just prior to birth and shortly thereafter, a large
number of liver metabolic enzymes are induced. After
birth, the liver acquires additional metabolism functions
and becomes fully mature [19]. Some cytochrome P450
genes are also expressed after birth and play an impor-
tant role in drug metabolism. Using microarray analy-
sis, a number of cytochrome P450 genes were clearly
identified as up-regulated in AT-MSC-Hepa. Additional
studies have indicated that several cytochrome P450
proteins were expressed in AT-MSC-Hepa (unpublished
results). Activities of CYP1A2, CYP2B6, CYP2C19,
CYP2D6 and CYP3A were clearly detected, and these
activities were approximately ‡ 10-fold lower than
those of primary hepatocytes. In particular, the enzyme
activity of CYP2C9 in AT-MSC-Hepa was remarkably
high compared to that in primary hepatocytes.
CYP3A4 is a major cytochrome P450 gene that is
expressed in the human liver [20], and its product is
involved in the metabolism of 45–60% of the drugs
metabolized by cytochrome P450 proteins [21,22]. Our
data indicate that the amount of CYP3A4 expressed
in AT-MSC-Hepa is approximately 170 times higher
than that in undifferentiated AT-MSCs. Additionally,
microarray analysis indicated that the expression level
of the ABC transporter gene MDR-1, which is impli-
cated in expelling various drugs from cells, was also
remarkably higher than that in undifferentiated
AT-MSCs [23]. CYP3A4 and MDR-1 are two major
factors that modulate exposure to a large range of
xenobiotics [24]. Clinical studies of biotransformation
of newly developed drugs in humans are subject to
several constraints, including ethics, cost and time.
Considerable emphasis has therefore been placed on
the development of in vitro test systems. Although pri-
mary human hepatocytes are the best source of cells
for such systems, their use for this purpose is limited
by donor shortage and the difficulties involved in ade-
quate propagation and long-term maintenance of
normal human hepatocytes in culture. Thus, our cells
might be suitable as an alternative for the validation
of newly developed drugs, because they express
CYP3A4 and MDR-1 at levels comparable to those in
primary human hepatocytes.
Expression of liver-selective transcription factors,
such as HNFs, CCAAT ⁄ enhancer-binding proteins and
GATA-binding proteins, is essential for the induction
of liver development and its progression. These tran-
scription factors exhibit temporal- and site-specific
expression patterns during organogenesis, with a dis-
tinct narrow time interval of transcription initiation
[25], and regulate transactivation of several endoderm-
and hepatocyte-specific factors, including transthyretin,
albumin and tyrosine aminotransferase [26,27]. It has
been reported that HNF3b ⁄ FOXA2 plays an important
role in endoderm specification and subsequent hepato-
cyte differentiation in vivo and in vitro [28,29]. In this
study, induction of HNF3b ⁄ FOXA2 expression was
clearly seen in AT-MSC-Hepa by microarray analysis.
Furthermore, our data demonstrated that expression of
other hepatic transcription factors, including HNF3a ⁄
FOXA1, GATA4, HNF6 ⁄ ONECUT1 and HNF1, were
‡ 10-fold up-regulated in AT-MSC-Hepa compared
with undifferentiated AT-MSCs. These results suggest
that transcription factor networks are precisely regu-
lated in the hepatic differentiation system, and that the
AT-MSCs differentiate into mature hepatocytes.
Mesencyhmal-to-epithelial transition is the reverse of
the epithelial–mesenchymal transition (EMT) that is a
crucial event in cancer progression and embryonic
development [30]. We found evidence of transdifferen-
tiation by MET in the process of hepatic differen-
tiation of AT-MSCs. No previous report has
demonstrated evidence of transdifferentiation of com-
mitted adult stem cells. In the case of our study, trans-
differentiation, in which AT-MSCs, which have a
mesodermal phenotype, are converted to hepatocytes,
with an epithelial cell-like phenotype, might be caused
by MET [31,32]. As shown in our previous immuno-
cytochemical study and shown by the results of this
microarray analysis, AT-MSCs express a mesenchymal
marker, vimentin. Expression of the epithelial marker
E-cadherin was remarkably up-regulated (81-fold)
in AT-MSC-Hepa, compared with undifferentiated
Fig. 4. Complementary activation, classical pathway. The expression levels of genes of AT-MSC (A), AT-MSC-Hepa (B) and human liver (C),
when compared to human hepatocytes, are shown on this illustration of the classical complementary activation pathway created by Nathan
Salomonis using
GENMAPP version 2.1. Most of the expression levels of genes in this pathway were lower (green, see color legend) or unde-
tected (no coloring) in AT-MSC (A), but were higher (red) in AT-MSC-Hepa (B) and human liver (C).
Y. Yamamoto et al. Transcriptome in hepatic induction of AT-MSCs
FEBS Journal 275 (2008) 1260–1273 ª 2008 The Authors Journal compilation ª 2008 FEBS 1269
AT-MSCs. Furthermore, microarray-based integrated
analysis of methylation by isoschizomers (MIAMI)
[33] was utilized for genome-wide profiling of the
DNA methylation status of AT-MSCs and AT-MSC-
Hepa. Preliminary data show that the promoter region
of 39 genes was hypermethylated and that of eight
genes was hypomethylated in AT-MSC-Hepa. It is
noteworthy that the promoter region of the Twist was
hypermethylated in AT-MSC-Hepa, indicating that
expression of the Twist gene was suppressed by epige-
netical modification (unpublished results). These data
support the evidence for transdifferentiation by MET
in AT-MSC-Hepa. Although the relationship between
the altered DNA methylation status for the other
genes identified and hepatic differentiation is not yet
understood, these genome-wide methylation findings
will also help to clarify the mechanism of hepatic dif-
ferentiation from AT-MSCs.
This report provides evidence that the transcriptome
and signal pathways of AT-MSC-Hepa are similar to
those of human primary hepatocytes and that hepatic
differentiation has occurred through MET. Human
fetal hepatocytes are the current standard model sys-
tem for the study of mature hepatocytes. Drawbacks
include the limited amount of cells that can be
obtained from an individual, a limited life span, and
an inability to withstand freeze ⁄ thaw procedures.
Therefore, our system will provide a valuable tool, in
addition to primary hepatocytes, for study of the
molecular basis of the regenerative and developmental
processes of hepatic cells in vitro.
Experimental procedures
Hepatic differentiation by the HIFC method
Isolation and culture of AT-MSCs were as described previ-
ously [16]. The AT-MSCs used for microarray analysis were
obtained from a gastric cancer patient (55 years old, male,
height 164 cm, weight 67.2 kg) undergoing gastrectomy at
the International Medical Center of Japan, Tokyo. The ethics
committee of the hospital approved this study, and informed
consent was obtained from the patient. The CD105
+
fraction
was isolated from AT-MSCs using CD105-coupled magnetic
microbeads (Miltenyi Biotec, Bergisch Galdbach, Germany)
[16]. Briefly, hepatic induction of AT-MSCs was performed
over a period of 3 weeks by culturing in hepatocyte culture
medium containing transferrin (5 lgÆmL
)1
), hydrocortisone-
21-hemisuccinate (10
)6
m), BSA (0.5 mgÆmL
)1
), ascorbic acid
(2 mm), epidermal growth factor (20 ngÆmL
)1
), insulin
(5 lgÆmL
)1
), gentamycin (50 lgÆmL
)1
) (Cambrex, Walkers-
ville, MD, USA) and dexamethasone (10
)8
m), and supple-
mented with HIFC containing HGF (150 ngÆmL
)1
), FGF1
(300 ngÆmL
)1
) and FGF4 (25 ngÆmL
)1
) (PeproTech EC,
London, UK). For the next 2 weeks, the cells were treated
with oncostatin M (30 ngÆmL
)1
) and dexamethasone
(2 · 10
)5
molÆL
)1
) and then cultured in hepatocyte culture
medium alone for 5 weeks.
Isolation of total RNA
Total RNA was extracted from undifferentiated AT-MSCs,
AT-MSC-Hepa, human primary hepatocytes and human
liver using ISOGEN solution (Nippon Gene, Tokyo, Japan)
according to the manufacturer’s protocol, and then treated
with deoxyribonuclease (DNase I, amplification grade;
TaKaRa, Kyoto, Japan).
Microarray analysis and data mining (Aligent
array)
A one-color microarray-based gene expression analysis sys-
tem (Agilent Technologies, Tokyo, Japan) containing
41 000 clones was used, according to the manufacturer’s
instructions. Total RNA was extracted from undifferenti-
ated AT-MSCs, AT-MSC-Hepa, human primary hepato-
cytes and human liver. The RNA sample of human primary
hepatocytes was used as the total RNA reference. The pro-
cess of hybridization and washing was performed using a
Gene Expression Wash Pack (Agilent Technologies) and
acetonitrile (Sigma, Tokyo, Japan). A DNA microarray
scanner (Agilent Technologies) was used for array scanning.
To ensure data reliability, weak signal spots were removed
according to the manufacturer’s criteria. This resulted in a
data matrix of 25 721 genes with no missing data.
Hierarchical undifferentiated clustering analysis
Genes that showed a ‡ 10-fold increase or decrease in the
expression level in AT-MSC-Hepa compared to undifferenti-
ated AT-MSCs were designated as up- or down-regulated
genes, respectively. A hierarchical cluster was produced from
Table 4. Expression levels of EMT-related genes in AT-MSCs and
AT-MSC-Hepa.
AT-MSCs AT-MSC-Hepa Ratio
EMT regulators
Twist1 16.74 10.36 0.62
Twist2 345.76 205.26 0.59
Snail1 7.25 2.77 0.38
Snail2 11.71 5.18 0.44
Epithelial markers
E-cadherin 0.01 0.81 81.04
a-catenin 0.46 0.63 1.35
Mesenchymal markers
N-cadherin 0.99 0.69 0.70
Vimentin 2.11 1.68 0.79
Transcriptome in hepatic induction of AT-MSCs Y. Yamamoto et al.
1270 FEBS Journal 275 (2008) 1260–1273 ª 2008 The Authors Journal compilation ª 2008 FEBS
the up- and down-regulated gene data using an Euclidean
distance calculation based on the Ward method calculation
by genmaths software (Applied Maths, Austin, TX, USA).
Gene ontology analysis
Gene ontology categories were assigned to genes based on
the acegene microarray database (DNA Chip Research
Inc. and Hitachi Software Co., Yokohama, Japan). The sig-
nificance of GO term appearance in the up- and down-
regulated genes (compared with all 12 441 annotated genes)
was calculated using the software GO Term Finder adapted
to the acegene microarray ( />cgi-bin/SGD/GO/goTermFinder). Cut-off points were set at
0.01 [34].
RNA target preparation and hybridization
procedures for microarray experiment (ConPath
method)
RNA was amplified using a MessageAmpÔ II-biotin-enhan-
ced single-round amplified RNA amplification kit (Ambion,
Austin, TX, USA). Briefly, 1 lg total RNA for each sample
was transcribed into double-stranded T7 RNA polymerase
promoter-tagged cDNA, then amplified into single-stranded
biotin-labeled cRNA using T7 polymerase. Aliquots (3 lg)
of cRNA were fragmented at 94 °C for 15 min and hybridi-
zed onto a ConPathÔ chip (DNA Chip Research Inc., GEO
ID GPL5437) in the presence of formamide (final concentra-
tion 10% v ⁄ v) at 37 °C for 16 h. The chip was washed at
room temperature for 5 min in 0.1· SSC, 0.1% SDS, fol-
lowed by another 5 min wash in 0.05· SSC, 0.1% SDS at
43 °C. Finally, the chip was rinsed in 0.05· SSC before
drying by low-speed centrifugation. For staining, the chip
was immersed in an NaCl ⁄ P
i
solution containing 10 lgÆmL
)1
of streptavidin ⁄ R-phycoerythrin conjugate (Invitrogen,
Carlsbad, CA, USA), Tween-20 (0.05% v ⁄ v) and BSA
(2 mgÆmL
)1
) for 30 min. A wash in NaCl ⁄ P
i
for 5 min at
room temperature was performed to remove any additional
stain, followed by another wash in a similar buffer, sepa-
rately prepared, for 30 s. The chip was rinsed in 0.05· SSC at
room temperature before drying by low-speed centrifugation.
Measurement and data analysis (ConPath
method)
The chip was scanned using an Agilent DNA microarray
scanner at a resolution of 10 lm (photo-multiplier tube:
80). Intensity values of each feature of the scanned image
were quantified using Feature extraction software (ver-
sion 9.1, Agilent Technologies), which performs back-
ground subtractions. Features that were flagged according
to the software algorithm or that were below background
value were excluded from further analysis. Normalization
was performed using genespring Gx. version 7.3.1 (per
chip: normalization to 50th percentile; per gene: normaliza-
tion to control reference sample) (Agilent Technologies).
Expression ratios were calculated for features that which
were present in both reference and tested samples. genmapp
version 2.1 [35,36] () analysis was
performed using gene database Hs-Std_20060526.gdb.
Acknowledgements
This work was supported in part by a grant-in-aid
from the Third-Term Comprehensive 10-Year Strategy
for Cancer Control, health science research grants for
Research on the Human Genome and Regenerative
Medicine from the Ministry of Health, Labor and
Welfare of Japan, a grant from the Japanese Health
Sciences Foundation, and a grant for research fellow-
ships from the Japanese Society for the Promotion of
Science for Young Scientists. We thank Dr Gary
Quinn, Dr Fumitaka Takeshita, Dr Shinobu Ueda, Ms
Ayako Inoue, Ms Maho Kodama, and Ms Nachi
Namatame for their excellent technical assistance, and
Research & Development projects for supporting
regional small and medium enterprises.
References
1 Friedenstein AJ, Latzinik NW, Grosheva AG & Gors-
kaya UF (1982) Marrow microenvironment transfer by
heterotopic transplantation of freshly isolated and cul-
tured cells in porous sponges. Exp Hematol 10, 217–227.
2 Zuk PA, Zhu M, Ashjian P, De Ugarte DA, Huang JI,
Mizuno H, Alfonso ZC, Fraser JK, Benhaim P & Hed-
rick MH (2002) Human adipose tissue is a source of
multipotent stem cells. Mol Biol Cell 13, 4279–4295.
3 Zuk PA, Zhu M, Mizuno H, Huang J, Futrell JW,
Katz AJ, Benhaim P, Lorenz HP & Hedrick MH (2001)
Multilineage cells from human adipose tissue: implica-
tions for cell-based therapies. Tissue Eng 7, 211–228.
4 Shih DT, Lee DC, Chen SC, Tsai RY, Huang CT, Tsai
CC, Shen EY & Chiu WT (2005) Isolation and charac-
terization of neurogenic mesenchymal stem cells in
human scalp tissue. Stem Cells 23, 1012–1020.
5 In’t Anker PS, Scherjon SA, Kleijburg-van der Keur C,
de Groot-Swings GM, Claas FH, Fibbe WE & Kanhai
HH (2004) Isolation of mesenchymal stem cells of fetal
or maternal origin from human placenta. Stem Cells 22,
1338–1345.
6 Bieback K, Kern S, Kluter H & Eichler H (2004) Criti-
cal parameters for the isolation of mesenchymal stem
cells from umbilical cord blood. Stem Cells 22, 625–634.
7 Campagnoli C, Roberts IA, Kumar S, Bennett PR,
Bellantuono I & Fisk NM (2001) Identification of
Y. Yamamoto et al. Transcriptome in hepatic induction of AT-MSCs
FEBS Journal 275 (2008) 1260–1273 ª 2008 The Authors Journal compilation ª 2008 FEBS 1271
mesenchymal stem ⁄ progenitor cells in human first-tri-
mester fetal blood, liver, and bone marrow. Blood 98,
2396–2402.
8 Pittenger MF, Mackay AM, Beck SC, Jaiswal RK,
Douglas R, Mosca JD, Moorman MA, Simonetti DW,
Craig S & Marshak DR (1999) Multilineage potential
of adult human mesenchymal stem cells. Science 284,
143–147.
9 Ferrari G, Cusella-De Angelis G, Coletta M, Paolucci
E, Stornaiuolo A, Cossu G & Mavilio F (1998) Muscle
regeneration by bone marrow-derived myogenic progen-
itors. Science 279, 1528–1530.
10 Sanchez-Ramos J, Song S, Cardozo-Pelaez F, Hazzi C,
Stedeford T, Willing A, Freeman TB, Saporta S,
Janssen W, Patel N et al. (2000) Adult bone marrow
stromal cells differentiate into neural cells in vitro. Exp
Neurol 164, 247–256.
11 Sato Y, Araki H, Kato J, Nakamura K, Kawano Y,
Kobune M, Sato T, Miyanishi K, Takayama T,
Takahashi M et al. (2005) Human mesenchymal stem
cells xenografted directly to rat liver are differentiated
into human hepatocytes without fusion. Blood 106,
756–763.
12 Hong SH, Gang EJ, Jeong JA, Ahn C, Hwang SH,
Yang IH, Park HK, Han H & Kim H (2005) In
vitro differentiation of human umbilical cord
blood-derived mesenchymal stem cells into hepatocyte-
like cells. Biochem Biophys Res Commun 330, 1153–1161.
13 Seo MJ, Suh SY, Bae YC & Jung JS (2005) Differentia-
tion of human adipose stromal cells into hepatic lineage
in vitro and in vivo. Biochem Biophys Res Commun 328,
258–264.
14 Talens-Visconti R, Bonora A, Jover R, Mirabet V,
Carbonell F, Castell JV & Gomez-Lechon MJ (2007)
Human mesenchymal stem cells from adipose tissue:
differentiation into hepatic lineage. Toxicol In Vitro 21 ,
324–329.
15 Teratani T, Yamamoto H, Aoyagi K, Sasaki H, Asari
A, Quinn G, Terada M & Ochiya T (2005) Direct hepa-
tic fate specification from mouse embryonic stem cells.
Hepatology 41, 836–846.
16 Banas A, Teratani T, Yamamoto Y, Tokuhara M,
Takeshita F, Quinn G, Okochi H & Ochiya T (2007)
Adipose tissue-derived mesenchymal stem cells as a
source of human hepatocytes. Hepatology 46, 219–
228.
17 Yang J, Mani SA, Donaher JL, Ramaswamy S, Itzyk-
son RA, Come C, Savagner P, Gitelman I, Richardson
A & Weinberg RA (2004) Twist, a master regulator of
morphogenesis, plays an essential role in tumor meta-
stasis. Cell 117, 927–939.
18 Peinado H, Olmeda D & Cano A (2007) Snail, Zeb and
bHLH factors in tumour progression: an alliance
against the epithelial phenotype? Nat Rev Cancer 7,
415–428.
19 Kamiya A, Kojima N, Kinoshita T, Sakai Y &
Miyaijma A (2002) Maturation of fetal hepatocytes
in vitro by extracellular matrices and oncostatin M:
induction of tryptophan oxygenase. Hepatology 35,
1351–1359.
20 Watkins PB (1994) Noninvasive tests of CYP3A
enzymes. Pharmacogenetics 4, 171–184.
21 Bertz RJ & Granneman GR (1997) Use of in vitro and
in vivo data to estimate the likelihood of metabolic
pharmacokinetic interactions. Clin Pharmacokinet 32 ,
210–258.
22 Evans WE & Relling MV (1999) Pharmacogenomics:
translating functional genomics into rational therapeu-
tics. Science 286
, 487–491.
23 Ambudkar SV, Kimchi-Sarfaty C, Sauna ZE & Gottes-
man MM (2003) P-glycoprotein: from genomics to
mechanism. Oncogene 22, 7468–7485.
24 Cavaco I, Gil JP, Gil-Berglund E & Ribeiro V (2003)
CYP3A4 and MDR1 alleles in a Portuguese population.
Clin Chem Lab Med 41, 1345–1350.
25 Costa RH, Kalinichenko VV, Holterman AX & Wang
X (2003) Transcription factors in liver development,
differentiation, and regeneration. Hepatology 38, 1331–
1347.
26 Duncan SA, Navas MA, Dufort D, Rossant J & Stoffel
M (1998) Regulation of a transcription factor network
required for differentiation and metabolism. Science
281, 692–695.
27 Bossard P & Zaret KS (1998) GATA transcription fac-
tors as potentiators of gut endoderm differentiation.
Development 125, 4909–4917.
28 Yamamoto Y, Teratani T, Yamamoto H, Quinn G,
Murata S, Ikeda R, Kinoshita K, Matsubara K, Kato
T & Ochiya T (2005) Recapitulation of in vivo gene
expression during hepatic differentiation from murine
embryonic stem cells. Hepatology 42, 558–567.
29 Lee CS, Friedman JR, Fulmer JT & Kaestner KH
(2005) The initiation of liver development is depen-
dent on Foxa transcription factors. Nature 435, 944–
947.
30 Kang Y & Massague J (2004) Epithelial–mesenchymal
transitions: twist in development and metastasis. Cell
118, 277–279.
31 Zipori D (2004) Mesenchymal stem cells: harnessing cell
plasticity to tissue and organ repair. Blood Cells Mol
Dis 33, 211–215.
32 Nakaya Y, Kuroda S, Katagiri YT, Kaibuchi K &
Takahashi Y (2004) Mesenchymal–epithelial transition
during somatic segmentation is regulated by differential
roles of Cdc42 and Rac1. Dev Cell 7, 425–438.
33 Hatada I, Fukasawa M, Kimura M, Morita S, Ya-
mada K, Yoshikawa T, Yamanaka S, Endo C, Saku-
rada A, Sato M et al. (2006) Genome-wide profiling of
promoter methylation in human. Oncogene 25, 3059–
3064.
Transcriptome in hepatic induction of AT-MSCs Y. Yamamoto et al.
1272 FEBS Journal 275 (2008) 1260–1273 ª 2008 The Authors Journal compilation ª 2008 FEBS
34 Haverty PM, Hansen U & Weng Z (2004) Computa-
tional inference of transcriptional regulatory networks
from expression profiling and transcription factor
binding site identification. Nucleic Acids Res 32,
179–188.
35 Doniger SW, Salomonis N, Dahlquist KD, Vranizan K,
Lawlor SC & Conklin BR (2003) MAPPFinder: using
Gene Ontology and GenMAPP to create a global gene-
expression profile from microarray data. Genome Biol 4,
R7.
36 Dahlquist KD, Salomonis N, Vranizan K, Lawlor SC
& Conklin BR (2002) GenMAPP, a new tool for view-
ing and analyzing microarray data on biological path-
ways. Nat Genet 31, 19–20.
Supplementary material
The following supplementary material is available for
this article online:
Fig. S1. The classical pathway of complementary acti-
vation.
Fig. S2. The fatty acid omega oxidation pathway.
Fig. S3. The steroid biosynthesis pathway.
Table S1. Genes that were up-regulated AT-MSC-
Hepa.
Table S2. Genes that were down-regulated in AT-MSC-
Hepa.
This material is available as part of the online article
from
Please note: Blackwell Publishing are not responsible
for the content or functionality of any supplementary
materials supplied by the authors. Any queries (other
than missing material) should be directed to the corre-
sponding author for the article.
Y. Yamamoto et al. Transcriptome in hepatic induction of AT-MSCs
FEBS Journal 275 (2008) 1260–1273 ª 2008 The Authors Journal compilation ª 2008 FEBS 1273