Báo cáo khoa học: Identification of critical residues of subunit H in its interaction with subunit E of the A-ATP synthase from Methanocaldococcus jannaschii potx
Bạn đang xem bản rút gọn của tài liệu. Xem và tải ngay bản đầy đủ của tài liệu tại đây (481.64 KB, 10 trang )
Identification of critical residues of subunit H in its
interaction with subunit E of the A-ATP synthase from
Methanocaldococcus jannaschii
Shovanlal Gayen, Asha M. Balakrishna, Goran Biukovic
´
, Wu Yulei, Cornelia Hunke and
Gerhard Gru
¨
ber
School of Biological Sciences, Nanyang Technological University, Singapore
Energy is the ability to do work or bring about a
change. Living things are constantly changing, and
therefore need to acquire energy. The molecule ATP is
the common energy currency of cells; when cells
require energy, they ‘spend’ ATP. In the case of the
archaea, the A
1
A
0
ATP synthases (A-ATP synthase)
catalyse this process of ATP synthesis [1]. This class of
enzyme is composed of ten subunits with the stoi-
chiometry A
3
:B
3
:C:D:E:F:G:H
2
:a:c
x
. Like the related
bacterial F
1
F
0
ATP synthase (F-ATP synthase)
(a
3
:b
3
:c:d:e:a:b
2
:c
x
) and the eukaryotic V
1
V
0
ATPase
(V-ATPase) (A
3
:B
3
:C:D:E:F:G
2
:H:a:d:c
x
:c¢
x
:c¢¢
x
), it pos-
sesses a water-soluble A
1
domain, containing the cata-
lytic sites, and an integral membrane A
0
domain,
involved in ion translocation [2–4]. The primary struc-
ture of the archaeal ATP synthase is similar to that of
the eukaryotic V-ATPase, but its function as an ATP
synthase is more similar to that of the F-ATP synthas-
es. ATP is synthesized or hydrolysed on the A
1
head-
piece, consisting of an A
3
:B
3
domain, and the energy
provided or released during this process is transmitted
to the membrane-bound A
0
domain. Energy coupling
between the two active domains occurs via the so-
called stalk part(s) [5].
Keywords
A
1
A
0
ATP synthase; archaeal ATPase; F
1
F
0
ATP synthase; nuclear magnetic resonance;
V
1
V
0
ATPase
Correspondence
G. Gru
¨
ber, School of Biological Sciences,
Nanyang Technological University,
60 Nanyang Drive, 637551 Singapore
Fax: +65 6791 3856
Tel: +65 6316 2989
E-mail:
(Received 25 September 2007, revised 4
February 2008, accepted 14 February 2008)
doi:10.1111/j.1742-4658.2008.06338.x
The boomerang-like H subunit of A
1
A
0
ATP synthase forms one of the
peripheral stalks connecting the A
1
and A
0
sections. Structural analyses of
the N-terminal part (H1–47) of subunit H of the A
1
A
0
ATP synthase from
Methanocaldococcus jannaschii have been performed by NMR spectros-
copy. Our initial NMR structural calculations for H1–47 indicate that
amino acid residues 7–44 fold into a single a-helical structure. Using the
purified N- (E1–100) and C-terminal domains (E101–206) of subunit E,
NMR titration experiments revealed that the N-terminal residues Met1–6,
Lys10, Glu11, Ala15, Val20 and Glu24 of H1–47 interact specifically with
the N-terminal domain E1–100 of subunit E. A more detailed picture
regarding the residues of E1–100 involved in this association was obtained
by titration studies using the N-terminal peptides E1–20, E21–40 and
E41–60. These data indicate that the N-terminal tail E41–60 interacts with
the N-terminal amino acids of H1–47, and this has been confirmed by fluo-
rescence correlation spectroscopy results. Analysis of
1
H–
15
N heteronuclear
single quantum coherence (HSQC) spectra of the central stalk subunit F in
the presence and absence of E101–206 show no obvious interaction
between the C-terminal domain of E and subunit F. The data presented
provide, for the first time, structural insights into the interaction of sub-
units E and H, and their arrangement within A
1
A
0
ATP synthase.
Abbreviations
FCS, fluorescence correlation spectroscopy; HSQC, heteronuclear single quantum coherence; NTA, nitrilotriacetic acid.
FEBS Journal 275 (2008) 1803–1812 ª 2008 The Authors Journal compilation ª 2008 FEBS 1803
Low-resolution structures of the enzyme show
that the A
1
ATPase is rather elongated, with an
A
3
:B
3
headpiece and an elongated stalk [6], composed
of the subunits C, D and F [6–10]. Two- and three-
dimensional reconstructions of the entire A
1
A
0
ATP
synthase, obtained by single-particle analysis of nega-
tively stained molecules, revealed novel structural fea-
tures such as two peripheral stalks and a collar-like
structure [10,11], which have been proposed to com-
prise the subunits H, I and E, respectively, [9,10,12].
Recently, a high-resolution structure of subunit E
(residues 81–198) of the A-ATP synthase from Pyro-
coccus horikoshii OT3 has been reported, showing
that the dimeric C-terminal domain of subunit E con-
sists of four antiparallel b-strands and six a-helices
[13]. Most recently, the boomerang-like shape of sub-
unit H in solution has been described for the A
1
A
0
ATP synthase from Methanocaldococcus jannaschii
[12]. In these studies, a subtractive approach using
truncated variations of H (H8–104, H1–98, H8–98
and H1–47) was used to understand the contributions
of termini to the overall structure of subunit H and
the orientation of the peripheral stalk within the
enzyme.
Here we describe structural studies on the N-termi-
nal part of subunit H, H1–47, of the A
1
A
0
ATP syn-
thase from M. jannaschii in solution using NMR
spectroscopy. Two-dimensional
1
H–
15
N heteronuclear
single quantum correlation (HSQC) spectra provided a
unique opportunity to analyse the interaction between
H1–47 and the N- and C-terminal domains of the pro-
posed neighbouring subunit E.
Results
Resonance assignments for the N-terminal
domain of subunit H (H1–47)
A crucial step in identifying the residues involved in
protein–protein interactions is the process of sequen-
tial assignment of amino acids. Sequential assignment
of H1–47 was performed using a combination of
triple-resonance backbone experiments [HNCACB,
CBCA(CO)NH] and 3D
15
N-resolved [
1
H,
1
H]
NOESY. Assignments of the resolved backbone resi-
dues of H1–47 are presented on a 2D
1
H–
15
N
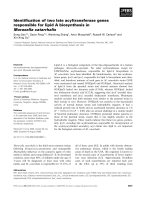
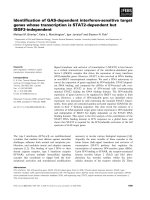
HSQC spectrum (Fig. 1). The Ca chemical shift devi-
ation from the random coil values (D
13
Ca) was used
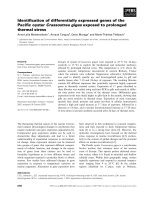
to predict the secondary structure of H1–47 [14].
The predicted fold consists of a single helix in the
middle of the protein, with some flexible residues
(Met1–6 and Leu44–Cys47) at both termini as shown
in Fig. 2.
Expression and purification of the N- (E1–100)
and C-terminal (E101–206) domains of subunit E
The full-length E subunit of A
1
A
0
ATP synthase from
M. jannaschii is composed of 206 amino acids, divided
into a predicted a-helix at the N-terminal part (amino
acids 1–100) and an a-helical and b-sheet-containing
domain at the C-terminal part (residues 101–206) [13].
For the structural studies, two truncated forms of
subunit E, E1–100 and E101–206, were generated.
SDS–PAGE of the recombinant E1–100 and
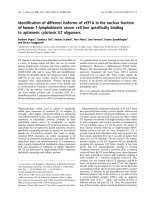
Fig. 1. Two-dimensional
1
H–
15
N-HSQC
spectrum of H1–47 in 25 m
M sodium phos-
phate buffer (pH 6.5) at 15 °C. Backbone
and amide assignments (Asn and Gln) are
shown for each residue. The HSQC cross-
peak for the side chain of residue R29 is
folded in the
15
N dimension and indicated
by ‘R29sc’. Signals from side-chain NH
2
groups are connected by horizontal lines.
Assignment of subunits E and H in A-ATP synthase S. Gayen et al.
1804 FEBS Journal 275 (2008) 1803–1812 ª 2008 The Authors Journal compilation ª 2008 FEBS
E101–206 revealed prominent bands of about 12 kDa
for both proteins, which were found entirely within
the soluble fraction. A Ni
2+
–nitrilotriacetic acid
(NTA) resin column and an imidazole gradient (10–
300 mm) in buffers 1 and 2 were used to separate
subunits E1–100 and E101–206, from the main con-
taminating proteins. E1–100 or E101–206 eluting at
100–300 mm imidazole were collected and subse-
quently applied to an ion-exchanger column. Analysis
of the isolated proteins by SDS–PAGE revealed the
high purity of the truncated subunits (see supplemen-
tary Fig. S1A,B). MALDI-MS showed that the dehy-
drated proteins E1–100 and E101–206 have molecular
masses of 11317.48 and 11837.69 Da, respectively,
confirming the sequence-based predicted mass. Size-
exclusion chromatography (see Experimental proce-
dures) revealed that the hydrated protein spanning
residues 101–206 was produced as a soluble dimer,
as confirmed by solution X-ray scattering experi-
ments in which molecular masses of 21.8 ± 1.5
(E1–100) and 22.5 ± 1.0 kDa (E101–206) were deter-
mined (A. M. Balakrishna & G. Gru
¨
ber, unpub-
lished results). The secondary structure of both
proteins was determined from CD spectra measured
between 185–260 nm (see supplementary Fig. S1A,B).
The minima at 222 and 208 nm and the maximum at
192 nm indicate the presence of a-helical structures in
E1–100. The secondary structure content of this con-
struct was calculated to be 71 ± 2% a-helix and
21 ± 2% random coil (see supplementary Fig. S1A).
The overall spectrum is in agreement with the pre-
dicted secondary structure of the protein based on
its amino acid sequence. The ratio (h
222
⁄ h
208
)of
molar ellipticity values at 222 and 208 nm was calcu-
lated to be 0.95, indicating that a-helical regions
within E1–100 are closely packed and are involved in
a-helical interactions. E101–206 comprises 51 ± 2%
a-helix and 28 ± 2% b-sheet (see supplementary
Fig. S1B).
Interactions of H1–47 and the N-terminal domain
E1–100 studied by NMR
Recently, the dimer formation of the H1–47 form has
been demonstrated using small-angle X-ray scattering
experiments, in which a molecular mass of 12.5 ±
2 kDa was determined for H1–47 [12]. In our work,
NMR titration experiments using
1
H–
15
N HSQC spec-
tra were used to characterize the interactions between
subunit H1–47 and the two dimeric domains E1–100
and E101–206, respectively. Two sets of titrations were
performed: HSQC spectra of
15
N-labelled H1–47 were
recorded in the absence or presence of increasing
amounts of unlabelled E1–100 and E101–206 separately.
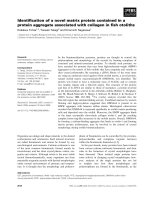
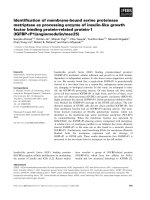
Figure 3A shows sections from the overlaid 2D
1
H–
15
N HSQC spectra of the H1–47 domain (shown in
blue) and the H1–47–E1–100 complex (shown in red),
highlighting differences in terms of changes in chemical
shift fo r several r esidues. In addition, the entire H SQC
spectrum of H1–47 in the absence and presence of
E1–100 is shown in supplementary Fig. S2, with an inset
showing the concentration-dependent increase in chemi-
cal shift changes of the residue Met1. The combined
(
1
H ⁄
15
N) chemical shift perturbations are shown in
Fig. 4. A number of residues show s ignificant chemical
shift perturbations upon binding of
15
N-labelled H1–47
to E1–100. There is a chemical shift perturbation in the
N-terminal region of the primary sequence of H1–47 (resi-
dues 1–6, 10, 11, 15, 20 and 24). By comparison, when an
equimolar amount of t h e C-terminal domain of
subunit E, E101–206, was added to H1–47, no significant
change in the spectrum could be detected (see supplemen-
tary Fig. S3). In order to map the region of E1–100
involved in the interaction with H1–47, the latter was
titrated with the peptides 1MKLMGVDKIKSKILDDA
KAE20 (E1–20), 21ANKIISEAEAEKAKILEKAK40
(E21–40) and 41EEAEKRKAEILKKGEKEAEM60
(E41–60). The HSQC spectrum of
15
N-labelled H1–47 in
the presence of peptide E41–60 shows chemical shift
Fig. 2. The amino acid sequence of H1–47
and the secondary structure elements based
on
13
Ca chemical shifts with respect to the
random coil values.
S. Gayen et al. Assignment of subunits E and H in A-ATP synthase
FEBS Journal 275 (2008) 1803–1812 ª 2008 The Authors Journal compilation ª 2008 FEBS 1805
changes for the N-terminal amino acids (Fig. 3B) that are
similar to those observed in the presence of the entire
E1–100 domain (Fig. 3A). In contrast, no change in the
spectra were observed in NMR experiments in which
15
N-labelled H1–47 was supplemented with the peptides
E1–20 or E21–40 (see supplementary Fig. S4A,B).
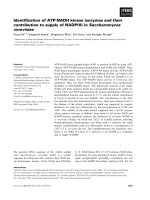
Binding of H1–47 to peptide E41–60 studied
by fluorescence correlation spectroscopy
To confirm the H1–47 ⁄ E41–60 binding, fluorescence
correlation spectroscopy (FCS) was used, in which
E41–60 was labelled with Atto488. As a reference, a
mean count rate of 33.4 kHz was determined for
Atto488–E41–60. Fitting of the autocorrelation func-
tions resulted in a characteristic diffusion time of
47.2 ls for the Atto488-labelled subunit E41–60.
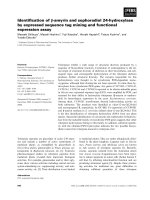
Figure 5A shows the autocorrelation curves for the
fluorescent-labelled peptide E41–60 in the absence and
presence of H1–47. The addition of H1–47 caused a
significant change in the mean diffusion time t
D
, which
increased with increasing concentrations of H1–47.
The increase in the diffusion time was due to the
increase in the mass of the diffusing particle when
A
B
C
Fig. 3. Sections from the overlaid 2D
1
H–
15
N-HSQC spectra of H1–47 in the absence (red) and presence (black) of 1.5 equivalents of unlabelled
E1–100 (A). Overlay of 2D
1
H–
15
N-HSQC spectra of H1–47 in the absence (red) and presence (black) of 1.5 equivalents of E41–60 peptide (B).
(C) Overlay of 2D
1
H–
15
N-HSQC spectra of the F subunit in the absence (red) and presence (black) of 1.5 equivalents of unlabelled E101–206. All
the spectra were collected in a Bruker Avance 600 MHz spectrometer in 25 mM sodium phosphate buffer (pH 6.5) at 15 °C.
Assignment of subunits E and H in A-ATP synthase S. Gayen et al.
1806 FEBS Journal 275 (2008) 1803–1812 ª 2008 The Authors Journal compilation ª 2008 FEBS
Atto488–E41–60 interacted with H1–47. A binding
constant of 3.0 lm for binding of Atto488–E41–60 to
H1–47 was calculated (Fig. 5B). No binding of H1–47
was observed when labelled E1–20 or E21–40 were
used in the experiments.
NMR titration of subunit F and the C-terminal
domain E101–206
Recently, we obtained the solution structure of sub-
unit F of the methanogenic A
1
A
0
ATP synthase using
NMR, and showed that it has a distinct two-domain
structure, with a globular N-terminus of 78 residues
and a C-terminal tail comprising residues 79–101 [15].
The N-terminal domain of subunit F is close to the
bottom of the rotary D subunit [16], which is in close
proximity to the C-terminal part of subunit E [9].
Based on these results, we examined the possibility
of interaction between subunit F and E101–206 using
NMR titration experiments. Assignments of the
resolved backbone residues of subunit F are shown on
a2D
1
H–
15
N HSQC spectrum (Fig. 3C) [16]. When
E101–206 was titrated to the labelled subunit F, no sig-
nificant chemical shift changes were observed, indicat-
ing that there is no interaction between the proteins.
Discussion
Previous fitting of the X-ray coordinates of the atomic
models of subunit A from P. horikoshii [17] and
subunit B of Methanosarcina mazei Go
¨
1 [18] into the
electron density map of the A-ATP synthase from
Thermus thermophilus [11], obtained from single-parti-
cle analysis of negatively stained electron micrographs,
allowed clear orientation of the three A subunits inside
the map, thereby highlighting the position of the so-
called ‘non-homologous region’ of subunit A [17]. This
region of subunit A, an insert of 80–90 amino acids,
which is similar to the catalytic A subunits in the
related eukaryotic V-ATPases, can be crosslinked via
the peptide Thr106–Arg122 to the C-terminal peptide
Ile74–Lys80 of subunit H in the complete A
1
A
0
ATP
synthase; this crosslinking is dependent on nucleotide
binding to the catalytic site of subunit A [9]. Quantita-
tive titration of subunit H to the catalytic A subunit
showed that subunit H binds in a saturable fashion to
subunit A with a K
d
of 206 nm [12]. Determination of
the shape of this hydrated subunit H in solution using
small-angle X-ray scattering showed that the protein is
an elongated dimer with a boomerang-like shape,
divided into two arms that are 12.0 and 6.8 nm long
[12]. CD spectra of the protein indicated that sub-
unit H has a high helical content (78%) and a high
1.0
A
B
0.8
0.6
0.4
0.2
Normalized autocorrelation functionRel. bound fraction (%)
0.0
100
50
0
1E-6 1E-5 1E-4 1E-3
Correlation time (s)
Concentration of H1–47 (µ
M)
0.01 0.1 1 10
100
0.01 0.1
Fig. 5. H1–47 ⁄ E41–60 binding studied by fluorescence correlation
spectroscopy. (A) Normalized autocorrelation functions of Atto488–
E41–60 obtained by increasing the quantity of the H1–47 domain
(from left to right: 0 n
M,50nM, 0.1, 2.0, 7.0 and 50 lM). (B) Con-
centration-dependent binding of peptide E41–60 to the H1–47
domain. The binding constant was calculated using the two-compo-
nent fitting model of the
CONFOCOR 3 software. The best fit to the
binding constants is shown as a non-linear, asymptotic fit.
Fig. 4. Combined amide (
1
H) and nitrogen (
15
N) chemical shift
changes ([(D
1
H
N
)
2
+(D
15
N
p.p.m.
⁄ 6.51)
2
]
0.5
) for H1–47 and E1–100
binding as a function of the amino acid sequence.
S. Gayen et al. Assignment of subunits E and H in A-ATP synthase
FEBS Journal 275 (2008) 1803–1812 ª 2008 The Authors Journal compilation ª 2008 FEBS 1807
degree of coiling. Together with the high yield of
disulfide formation of an N-terminal truncated protein,
H1–47, containing a Glu47Cys mutation, it has been
suggested that the helices inside the dimer of sub-
unit H are in a parallel and in-register arrangement
[12]. Secondary structure prediction of H1–47 based
on chemical shift indices [14], using Ca and Ha chemi-
cal shifts with respect to random coil values, and anal-
ysis of NOESY data, confirms the high a-helix content
comprising residues Glu7 to Lys43 (Fig. 2). Compari-
son of the shape of subunit H and the C-terminal trun-
cated form H1–98, derived from small-angle X-ray
scattering data, allowed assignment of subunit H to
the peripheral stalk in the two-dimensional projection
of A-ATP synthase [12]. The second peripheral stalk
of the A
1
A
0
ATP synthase (as shown in Fig. 6B) is
predicted to be formed by subunit a [9]. Connected via
its C-terminal arm to the catalytic A subunit, sub-
unit H exceeds the total length of the A
1
headpiece
and the central stalk [6,10] and becomes oriented with
its N-terminal arm close to the collar-like structure
of the enzyme complex, predicted to be formed by
subunit E [9,12]. Recently, an E–H complex has been
described, using electrophoresis and mass spectrometry
[13]. In the NMR titration and FCS experiments pre-
sented, we show that it is the N-terminal domain
(E1–100, E41–60) of subunit E that specifically binds
to the very N-terminus of H1–47. The high a-helical
content of E1–100 (71%) might indicate that the
amino acid region E41–60 (41EEAEKRKAEILKKG
EKEAEM60) of the E1–100 domain binds to the
N-terminal residues 1–6, 10, 11, 15, 20 and 24 of
H1–47 via a helix–helix interaction. In contrast, no
binding was observed with the C-terminal form,
E101–206. The crystallographic structure of the
C-terminal half of subunit E (E81–198) from P. hori-
koshii OT3 consists of six a-helices and four antiparal-
lel b-strands that form a dimer [13]. These results are
comparable to the CD data obtained here for the
C-terminal part, E101–206, of the M. jannaschii pro-
tein (51 ± 2% a-helix and 28 ± 2% b-sheet) and the
apparent size of the hydrated E101–206 based on
AB
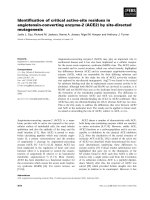
Fig. 6. Topological model of the subunits in the methanogenic A
1
A
0
ATP synthase. (A) Pyrococcus horikoshii A-ATP synthase subunit A
(orange, pdb 1vdz [17]), Methanosarcina mazei Go
¨
1 A-ATP synthase subunit B (green, pdb 2c61 [18]), the bovine mitochondrial F-ATP syn-
thase c subunit (violet; pdb 1e1q, chain G [30]), which is homologous to subunit D of the A-ATP synthase, and M. mazei Go
¨
1 A-ATP syn-
thase subunit F (red, pdb 20V6 [15]) were fitted into the electron density map of the A
1
ATPase [7] and A
1
A
0
ATP synthase [18], obtained
from single-particle analysis electron micrographs [11]. The figure was prepared using PyMOL (). (B) The arrangement
of subunits in the A
1
A
0
ATP synthase. One B subunit has been removed from the A
1
section to reveal the D subunit within the A
3
B
3
hexamer. The A subunit is attached to the N-terminal domain (E
N
) of subunit E by the peripheral stalk subunit H, and the C-terminal part of
subunit E (E
C
) is in close proximity to the coupling subunit D. Asterisks indicate some of the crosslinks that have been generated to probe
the function and location of these subunits [9].
Assignment of subunits E and H in A-ATP synthase S. Gayen et al.
1808 FEBS Journal 275 (2008) 1803–1812 ª 2008 The Authors Journal compilation ª 2008 FEBS
exclusion chromatography. Previous crosslinking
experiments with the methanogenic A
1
A
0
ATP synthase
showed that subunits D and E can crosslink readily
via the peptides 127LDEAAKK134 and 119AYS-
SKESEELVK130, respectively [9]. The homologous
peptide E81–198 in the P. horikoshii OT3 structure
forms the second helix (a2), which is exposed to the
solvent [13], allowing crosslinking to occur between the
C-terminal domain of subunit E and the central stalk
subunit D (Fig. 6B).
There is also biochemical evidence that subunit F of
the A-ATP synthase is in close contact with subunit D
[8,15]. As demonstrated by the solution structure, the
four-stranded b-sheet in the N-terminal part of sub-
unit F forms a hydrophobic surface, which is suggested
to mediate the interaction of both subunits (Fig. 6A)
[15]. Such positioning of subunit D relative to sub-
unit F might bring the latter in close proximity to the
C-terminal domain of subunit E. However, the data
presented show no obvious interaction between sub-
unit F and E101–206, indicating that subunit E mainly
interacts with subunits H and D via its N- and C-ter-
minal parts, respectively.
In summary, the data presented support the view
that the a-helical subunit H forms one of the two
peripheral stalks of the enzyme, with its C-terminus
connected to the N-terminal part of the catalytic
A subunit and its N-terminus in close contact with the
N-terminus of subunit E, with the latter being in close
connection via its C-terminus to subunit D. The nucleo-
tide-dependent crosslink formation between subunits
A and H, the close proximity of subunit H via its
N-terminus to subunit E, and the proximity of sub-
units D and E leads us to speculate whether both
subunits H and E might be involved in coupling
and ⁄ or regulatory events in the A-ATP synthase.
Experimental procedures
Materials
ProofStartÔ DNA polymerase and Ni
2+
–NTA chromato-
graphy resin were obtained from Qiagen (Hilden, Ger-
many); restriction enzymes were purchased from Fermentas
(St Leon-Rot, Germany). Chemicals for gel electrophoresis
were obtained from Serva (Heidelberg, Germany). BSA was
purchased from GERBU Biochemicals (Heidelberg, Ger-
many). Atto488–maleimide was obtained from ATTO-TEC
(Siegen, Germany). All other chemicals were at least of
analytical grade and were purchased from BIOMOL (Ham-
burg, Germany), Merck (Darmstadt, Germany), Roth
(Karlsruhe, Germany), Sigma (Deisenhofen, Germany) or
Serva (Heidelberg, Germany). (
15
NH
4
)
2
SO
4
and (
13
C)
glucose were purchased from Cambridge Isotope Laborato-
ries (Andover, MA, USA).
Expression, production and purification
of proteins
In order to amplify the two truncated constructs of sub-
unit E (E1–100 and E101–206), the primers 5¢-GTTG
CCA
TGGCTGTGAAATTGATGGGA-3¢ (forward), 5¢-CTCCG
AGCTCTCATGGCAGTTTAAC-3¢ (reverse) and 5¢-ATA
CCATGGAACAGCCAGAGTATAAAG-3¢ (forward), 5 ¢-
AGG
GAGCTCTCAGAATAACTTCTCTGTA-3¢ (reverse),
respectively, were designed (restriction sites are underlined).
Genomic DNA from M. jannaschii ATCCÒ 43067DÔ was
used as the template. Following digestion with NcoI and
SacI, the PCR products were ligated into pET9d1-His
3
using T4 DNA ligase (the reaction mixture was incubated at
room temperature for 1 h). The insert-containing pET9d-
His
3
vector was transformed into Escherichia coli cells
(strain NovaBlue) by electroporation (using 2500 V voltage,
25 lF capacitance and 200 W resistance), and transformants
were selected on Luria–Bertoni (LB) agar plates containing
30 lgÆmL
)1
kanamycin and 12.5 lgÆmL
)1
tetracyclin. The
cloned vector was isolated using a QIAquickÒ miniprep kit
(Qiagen) and transformed into E. coli cells (strain BL21) by
electroporation. The liquid cultures were shaken at
200 r.p.m. in 30 lgÆmL
)1
kanamycin-containing LB medium
for about 20 h at 30 °C. Production of proteins E1–100 and
E101–206 was induced when the attenuance at 600 nm
(D
600
) reached 0.6 using a final concentration of 1 mm iso-
propyl-b-d-thiogalactopyranoside. Following a 4 h induc-
tion in a shaker at 200 r.p.m. and 30 °C, the cells were
harvested at 7000 g for 15 min at 4 °C. Subsequently, cells
were lysed on ice by sonication for 3 · 1 min in buffer 1
(50 mm Tris ⁄ HCl, pH 7.5, 200 mm NaCl, 1 mm phenyl-
methanesulfonyl fluoride and 0.8 m m dithiothreitol for E1–
100 and E101–206, respectively) and 3 · 1 min in buffer 2
(50 mm Hepes, pH 7.0, 150 mm NaCl, 1 m m phenylmethane-
sulfonyl fluoride and 0.8 mm dithiothreitol). The lysate
was incubated in a waterbath for 20 min at 70 °C, and solu-
ble proteins were separated from the cell debris by centrifu-
gation at 10 000 g for 35 min. The supernatant was filtered
(0.45 lm; Millipore, Billerica, MA, USA) and passed over a
Ni
2+
–NTA resin column to isolate E1–100 and E101–206,
according to the method decribed by Gru
¨
ber et al. [19]. The
His-tagged protein was allowed to bind to the matrix for
1.5 h at 4 ° C and eluted using an imidazole gradient
(10–300 mm) in buffer 1 for E1–100 and in buffer 2 for
E101–206. Fractions containing E1–100 were identified by
SDS–PAGE [20], pooled and applied to an ion exchanger
(MonoQ HR5 ⁄ 5, GE Healthcare, Singapore) equilibrated
using buffer A (50 mm Tris ⁄ HCl, pH 7.5, 1 mm phenyl-
methanesulfonyl fluoride, 1.0 mm dithiothreitol). The pro-
tein was eluted using a linear gradient with buffer B (50 mm
S. Gayen et al. Assignment of subunits E and H in A-ATP synthase
FEBS Journal 275 (2008) 1803–1812 ª 2008 The Authors Journal compilation ª 2008 FEBS 1809
Tris ⁄ HCl, pH 7.5, 1 m NaCl, 1 mm phenylmethanesulfonyl
fluoride, 1.0 mm dithiothreitol) at 3 mLÆmin
)1
. In the case
of E101–206, the protein was further purified using
ResourceQ (6 mL, GE Healthcare) as the ion-exchanger col-
umn and equilibrated in buffer C (50 mm Hepes, pH 7.0,
1mm phenylmethanesulfonyl fluoride, 1.0 mm dithiothrei-
tol). The protein was then eluted using a linear gradient with
buffer D (50 mm Hepes, pH 7.0, 1 m NaCl, 1 mm phenyl-
methanesulfonyl fluoride, 1.0 mm dithiothreitol). The pro-
teins were concentrated as required using Centricon YM-3
spin concentrators (Millipore) with a 3 kDa molecular mass
cut-off.
Subunit F and the truncated form of subunit H, H1–47,
respectively, were isolated as described previously [9,12].
For production of uniformly labelled (
15
N and
15
N ⁄
13
C)
subunit F and H1–47, the bacteria were grown in M9 mini-
mal medium containing
15
NH
4
Cl or
15
NH
4
Cl ⁄ (
13
C)glucose.
The purity and homogeneity of all protein samples were
analysed by SDS–PAGE [20]. SDS gels were stained with
Coomassie brilliant blue G250. Protein concentrations
were determined using a bicinchoninic acid assay (Pierce,
Rockford, IL, USA).
Size-exclusion chromatography
Size-exclusion chromatography was performed on a Super-
dex 75 10 ⁄ 30 column (GE Healthcare) at 0.5 mLÆmin
)1
using
50 mm Hepes, pH 7.0, 150 mm NaCl and 1 mm dithiothrei-
tol. The elution profiles were recorded by determining the
A
280
values. The molecular masses of E1–100 and E101–206
were estimated by comparison with the 25 kDa (chymo-
trypsinogen A) and 13.7 kDa (RNase A) markers of the
GE Healthcare low-molecular-weight gel filtration calibra-
tion kit.
CD spectroscopy
Steady-state CD spectra were obtained in far-UV light
(185–260 nm) using a CHIRASCAN spectropolarimeter
(Applied Photophysics, Leatherhead, UK). Spectra were
collected in a 60 lL quartz cell (Hellma, Mu
¨
llheim, Ger-
many) with a path length of 0.1 mm, at 20 °C and with a
step resolution of 1 nm. The readings were for an average
of 2 s at each wavelength, and the recorded ellipticity val-
ues were the mean of three determinations for each sample.
CD spectroscopy of the two proteins (2.0 mgÆmL
)1
) was
performed in a buffer of 50 mm Tris ⁄ HCl, pH 7.5, 200 mm
NaCl, 1 mm dithiothreitol for E1–100 and of 50 mm
Hepes, pH 7.0, 150 mm NaCl, 1 mm dithiothreitol for
E101–206. The spectrum for the buffer was subtracted from
the spectrum of the protein. CD values were converted to
mean residue ellipticity (h, degree cm
2
Ædmol
)1
) using chira-
scan software version 1.2 (Applied Photophysics). This
baseline-corrected spectrum was used as the input for com-
puter methods to obtain predictions of secondary structure.
In order to analyse the CD spectrum, the following
algorithms were used: VARSELEC [21], Selcon [22], Contin
[23] and K2D [24] (all methods incorporated into the pro-
grams dicroprot [25] and neuralnet [26]).
NMR data collection and processing
The NMR sample was prepared in 90% H
2
O ⁄ 10% D
2
O
containing 25 mm NaH
2
PO
4
⁄ Na
2
HPO
4
(pH 6.5) and 0.1%
NaN
3
. All NMR experiments were performed at 15 °Con
a Bruker (Rheinstetten, Germany) Avance 600 MHz spec-
trometer. The experiments recorded on
15
N ⁄
13
C-labelled
samples were HNCA, HNCACB, CBCA(CO)NH and
3D
15
N-NOESY-HSQC (s
m
= 200 ms). Two-dimensional
NOESY and TOCSY experiments were carried out using
unlabelled samples. All the two- and three-dimensional
experiments made use of pulsed-field gradients for coher-
ence selection and artefact suppression, and utilized gradi-
ent sensitivity enhancement schemes. Quadrature detection
in the indirectly detected dimensions was achieved using
either States ⁄ TPPI (time-proportional phase incrementa-
tion) or echo ⁄ anti-echo method. Baseline corrections were
applied wherever necessary. The proton chemical shift
was referenced to the methyl signal of 2,2-dimethyl-
2-silapentane-5-sulfonate (Cambridge Isotope Laboratories)
to 0 p.p.m. The
13
C and
15
N chemical shifts were referenced
indirectly to 2,2-dimethyl-2-silapentane-5-sulfonate. All the
NMR spectra were processed using either nmrPipe ⁄ nmr-
Draw [27] or the in-built software topspin of the Bruker
Avance spectrometer. Peak picking and data analysis for
the Fourier-transformed spectra were performed using
sparky [28].
NMR-binding experiments
To analyse the binding between subunits H1–47 and E1–100
and between H1–47 and E101–206, a series of
1
H–
15
N
HSQC spectra were recorded at 15 °C for the fixed concen-
tration of 100 lm of H1–47, titrated with increasing amounts
(up to 1.5 equivalents) of E1–100 and E101–206 separately.
The proteins were incubated for 30 min for each step of the
experiment. The change of chemical shift was monitored in
the HSQC spectra. The same procedure was followed for the
binding experiments with
15
N-labelled H1–47 and the N-ter-
minal peptides from subunit E, E1–20, E21–40 and E41–60,
as well as
15
N-labelled subunit F and E101–206. All the sam-
ples used were either finally dissolved in or exchanged with
25 mm sodium phosphate (pH 6.5) buffer prior to the bind-
ing experiments.
Fluorescence correlation spectroscopy
Fluorescence correlation spectroscopy was performed on a
LSM-FCS system (confocor 3, Zeiss, Jena, Germany)
Assignment of subunits E and H in A-ATP synthase S. Gayen et al.
1810 FEBS Journal 275 (2008) 1803–1812 ª 2008 The Authors Journal compilation ª 2008 FEBS
using Atto488–maleimide to label peptides E1–20, E21–40
and E41–60 of subunit E. The labelling and FCS experi-
ments were performed in 25 mm sodium phosphate buffer,
pH 6.5, for 10 min at room temperature. The excess non-
bound dye was removed five times using a ZipTipÒ P-10
pipette tip with C4 resin (Millipore), replacing the solution
with 5% acetonitrile ⁄ water (0.1% trifluoroacetic acid). The
sufficient removal of non-bounded dye was verified by
FCS-measurements of the wash steps prior to the elution of
the labelled peptide. The fluorescent-labelled peptide was
subsequently eluted with 60% acetonitrile ⁄ water (0.1%
trifluoroacetic acid).
The 488 nm laser line of an 30 mW argon ion laser was
focused into the aqueous solution using a water immersion
objective (C-Apochromat 40·⁄1.2 W, korr UL-Vis-IR,
Zeiss). FCS was performed on 15 lL droplets, which were
placed on gelatin-treated (3% gelatin solution) Nunc 8
well-chamber cover glasses (Nunc ⁄ Denmark, catalogue
number: 155411) according to the method described by
Hunke et al. [29]. The following filter sets were used: MBS
(main beam splitter), HFT488 (Haubtfarbteiler, main color
splitter); EF (emission filter), none; DBS (dichroism beam
splitter), mirror; EF2, LP505 (long pass filter). Out-of-focus
fluorescence was rejected by a 90 lm pinhole in the detec-
tion pathway, resulting in a confocal detection volume of
approximately 0.25 fL. Fluorescence autocorrelation func-
tions were measured for 30 s each with ten repetitions.
Solutions of Atto488–maleimide in buffer were used as
references and for calibration of the confocor 3 system.
To analyse the autocorrelation functions of E41–60-bound
H1–47, a standard autocorrelation two-diffusion-coefficient
normalized triplet model was used for fitting (FCS-LSM
software, confocor 3, Zeiss). The diffusion time for
fluorescently labelled E41–60 was measured independently,
and kept fixed during fitting of the FCS data. Therefore,
determination of the binding constants only required calcu-
lation of the relative amounts of free labelled peptide E41–
60 with the short diffusion time, in comparison with an
increase of the diffusion time. The increase of the diffusion
time is caused by the increment of the size of the particles
because of the interaction of E41–60 with H1–47 according
to the Stoker–Einstein relation. The calculations were per-
formed using confocor 3 software version 4.2, Microsoft
excel 2003 and origin 7.5 (Origin Lab, Northampton,
MA, USA).
Peptide synthesis
The N-terminal peptides E1–20, E21–40 and E41–60 of
M. jannaschii subunit E were synthesized and purified by
RP-HPLC at the Division of Chemical Biology and
Biotechnology, School of Biological Sciences, Nanyang
Technological University, Singapore. The purity and
identity of the peptides were confirmed by HPLC and
ESI-MS.
Acknowledgements
We thank Dr Subramanian Vivekanandan for his sup-
port in the analysis of NMR data and critical reading
of the manuscript. We are grateful to Dr C. F. Liu for
synthesizing the peptides and Dr S. K. Sze for mass
spectrometry analysis. S. Gayen is grateful to Nanyang
Technological University for the award of a research
scholarship. This research was supported by A*STAR
Biomedical Research Council grant 06 ⁄ 1⁄ 22 ⁄ 19 ⁄ 467.
References
1 Scha
¨
fer G, Engelhard M & Mu
¨
ller V (1999) Bioenerget-
ics of the archaea. Mol Biol Rev 63, 570–620.
2 Weber J & Senior AE (2003) ATP synthesis driven by
proton transport in F
1
F
0
-ATP synthase. FEBS Lett
545, 61–70.
3 Lolkema JS, Chaban Y & Boekema EJ (2003) Subunit
composition, structure, and distribution of bacterial
V-type ATPase. J Bioenerg Biomembr 35, 323–336.
4 Cross RL & Mu
¨
ller V (2004) The evolution of A-, F-,
and V-type ATP synthases and ATPases: reversals in
function and changes in the H+ ⁄ ATP coupling ratio.
FEBS Lett 576, 1–4.
5Mu
¨
ller V & Gru
¨
ber G (2003) ATP syntases: structure,
function and evolution of unique energy converters. Cell
Mol Life Sci 60, 474–494.
6 Gru
¨
ber G, Svergun DI, Coskun U
¨
, Lemker T, Koch
MHJ, Scha
¨
gger H & Mu
¨
ller V (2000) Structural insights
into the A
1
ATPase from the archaeon, Methanosarcina
mazei Go
¨
1. Biochemistry 40, 1890–1896.
7 Coskun U
¨
, Radermacher M, Mu
¨
ller V, Ruiz T &
Gru
¨
ber G (2004) Three-dimensional organization of the
archaeal A
1
-ATPase from Methanosarcina mazei Go
¨
1.
J Biol Chem 279, 22759–22764.
8 Coskun U
¨
, Gru
¨
ber G, Koch MHJ, Godovac-Zimmer-
mann J, Lemker T & Mu
¨
ller V (2002) Cross-talk in the
A
1
-ATPase from Methanosarcina mazei Go
¨
1 due to
nucleotide binding. J Biol Chem 277, 17327–17333.
9 Scha
¨
fer I, Ro
¨
ssle M, Biukovic
´
G, Mu
¨
ller V & Gru
¨
ber
G (2006) Structural and functional analysis of the cou-
pling subunit F in solution and topological arrangement
of the stalk domains of the methanogenic A
1
A
0
ATP
synthase. J Bioenerg Biomembr 38, 83–92.
10 Coskun U
¨
, Chaban YL, Lingl A, Mu
¨
ller V, Keegstra
W, Boekema EJ & Gru
¨
ber G (2004) Structure and sub-
unit arrangement of the A-type ATP synthase complex
from the archaeon Methanococcus jannaschii visualized
by electron microscopy. J Biol Chem 279 , 38644–38648.
11 Bernal RA & Stock D (2004) Three-dimensional struc-
ture of the intact Thermus thermophilus H+-ATPase ⁄
synthase by electron microscopy. Structure 12, 1789–
1798.
S. Gayen et al. Assignment of subunits E and H in A-ATP synthase
FEBS Journal 275 (2008) 1803–1812 ª 2008 The Authors Journal compilation ª 2008 FEBS 1811
12 Biukovic
´
G, Ro
¨
ssle M, Gayen S, Mu Y & Gru
¨
ber G
(2007) Small-angle X-ray scattering reveals the solution
structure of the peripheral stalk subunit H of the A
1
A
0
ATP synthase from Methanocaldococcus jannaschii and
its binding to the catalytic A subunit. Biochemistry 46,
2070–2078.
13 Lokanath NK, Matsuura Y, Kuroishi C, Takahashi N
& Kunishima N (2006) Dimeric core structure of modu-
lar stator subunit E of archaeal H
+
-ATPase. J Mol Biol
366, 933–944.
14 Wishart DS, Sykes BD & Richards FM (1992) The
chemical shift index: a fast and simple method for
the assignment of protein secondary structure
through NMR spectroscopy. Biochemistry 31, 1647–
1651.
15 Gayen S, Vivekanandan S, Biukovic
´
G, Gru
¨
ber G &
Yoon HS (2007) The NMR solution structure of sub-
unit F of the methanogenic A
1
A
0
ATP synthase and
its interaction with the nucleotide-binding subunit B.
Biochemistry 46, 11684–11694.
16 Gayen S, Vivekanandan S, Biukovic
´
G, Gru
¨
ber G &
Yoon HS (2007) Backbone
1
H,
13
C, and
15
N resonance
assignments of subunit F of the A
1
A
0
ATP synthase
from Methanosarcina mazei Go
¨
1. Biomol NMR Assign
1, 23–25.
17 Maegawa Y, Morita H, Iyaguchi D, Yao M,
Watanabe N & Tanaka I (2006) Structure of the
catalytic nucleotide-binding subunit A of A-type ATP
synthase from Pyrococcus horikoshii reveals a novel
domain related to the peripheral stalk. Acta
Crystallogr D 62, 483–488.
18 Scha
¨
fer I, Bailer SM, Du
¨
ser MG, Bo
¨
rsch M, Ricardo
AB, Stock D & Gru
¨
ber G (2006) Crystal structure of
the archaeal A
1
A
0
ATPsynthase subunit B from Met-
hanosarcina mazei Go
¨
1: implications of nucleotide-bind-
ing differences in the major A
1
A
0
subunits A and B.
J Mol Biol 358, 725–740.
19 Gru
¨
ber G, Godovac-Zimmermann J, Link TA, Coskun
U
¨
, Rizzo VF, Betz C & Bailer S (2002) Expression,
purification and characterization of subunit E, an essen-
tial subunit of the vacuolar-ATPase. Biochem Biophys
Res Commun 298, 383–391.
20 Laemmli UK (1970) Cleavage of structural proteins
during the assembly of the head of bacteriophage T4.
Nature 227, 680–685.
21 Manavalan P & Johnson WC Jr (1987) Variable selec-
tion method improves the prediction of protein second-
ary structure from circular dichroism spectra. Anal
Biochem 167, 76–85.
22 Sreerama N & Woody RW (1993) A self-consistent
method for the analysis of protein secondary structure
from circular dichroism. Anal Biochem 209, 32–44.
23 Provencher SW (1982) A constrained regularization
method of inverting data represented by linear algebraic
or integral quations. Comput Phys Commun 27, 213–
227.
24 Andrade MA, Chacon P, Merelo JJ & Moran F (1993)
Evaluation of secondary structure of proteins from UV
circular dichroism spectra using an unsupervised learn-
ing neural network. Protein Eng 6, 383–390.
25 Dele
´
age G & Geourjon C (1993) An interactive graphic
program for calculating the secondary structures con-
tent of proteins from circular dichroism spectrum.
Comput Appl Biosci 9, 197–199.
26 Bo
¨
hm G, Muhr R & Jaenicke R (1992) Quantitative
analysis of protein far UV circular dichroism spectra by
neural networks. Protein Eng 5, 191–195.
27 Delaglio GS, Vuister GW, Zhu G, Pfeifer J & Bax A
(1995) NMRPipe: a multidimensional spectral process-
ing system based on UNIX pipes. J Biomol NMR 6,
277–293.
28 Kneller DG & Goddard TD (1997) SPARKY 3.105
Edition. University of California, San Francisco, CA.
( />29 Hunke C, Chen WJ, Scha
¨
fer HJ & Gru
¨
ber G (2007)
Cloning, purification, and nucleotide-binding traits of
the catalytic subunit A of the V
1
V
0
ATPase from Aedes
albopictus. Protein Expr Purif 53, 378–383.
30 Gibbons C, Montgomery MG, Leslie AG & Walker JE
(2000) The structure of the central stalk in bovine F(1)-
ATPase at 2.4 A
˚
resolution. Nat Struct Biol 7, 1055–
1061.
Supplementary material
The following supplementary material is available
online:
Fig. S1. Far-UV CD spectrum of the E1–100 and
E101–206 proteins, and SDS–PAGE gel showing a
sample of the purified proteins.
Fig. S2. Overlay of 2D
1
H–
15
N-HSQC spectra of
H1–47 in the absence and presence of 1.5 equivalents
of unlabelled E1–100.
Fig. S3.
1
H–
15
N-HSQC spectra of H1–47 and a 1 : 1
molar mixture with E101–206.
Fig. S4.
1
H–
15
N-HSQC spectra of H1–47 in the
absence and presence of 1.5 equivalents of E1–20 or
E21–40 peptides. in 25 mm sodium phosphate buffer
(pH 6.5) at 288 K.
This material is available as part of the online article
from
Please note: Blackwell Publishing are not responsible
for the content or functionality of any supplementary
materials supplied by the authors. Any queries (other
than missing material) should be directed to the corre-
sponding author for the article.
Assignment of subunits E and H in A-ATP synthase S. Gayen et al.
1812 FEBS Journal 275 (2008) 1803–1812 ª 2008 The Authors Journal compilation ª 2008 FEBS