Báo cáo khoa học: Collective behavior in gene regulation: The cell is an oscillator, the cell cycle a developmental process doc
Bạn đang xem bản rút gọn của tài liệu. Xem và tải ngay bản đầy đủ của tài liệu tại đây (372.96 KB, 13 trang )
MINIREVIEW
Collective behavior in gene regulation: The cell is an
oscillator, the cell cycle a developmental process
Robert R. Klevecz
1
, Caroline M. Li
1
, Ian Marcus
1
and Paul H. Frankel
2
1 Department of Biology, Beckman Research Institute, Duarte, CA, USA
2 Department of Biostatistics, City of Hope Medical Center, Duarte, CA, USA
The temporal organization of cellular
phenotype is oscillatory not stochastic
The idea that regulation of gene expression and protein
synthesis are stochastic endures despite computational
studies and a significant body of experimental evidence
for viewing the cell as a network of coupled oscillators.
Stochasticity in gene regulation is driven principally by
the low message copy number conundrum but lacks
the predictive power of attractor models when extended
beyond a few genes to a consideration of the precision
of cellular clocks and circadian rhythms [1–4].
Genome-wide oscillations in transcription bring into
question models of cellular phenotype that assume
steady-state, stochastic-based mechanisms for the regu-
lation of protein and transcript levels [5–7]. Instead,
Keywords
attractor; cell cycle; genome-wide;
microarray; oscillation; phenotype;
stochastic; SVD; wavelets; yeast
Correspondence
R. R. Klevecz, Dynamic Systems Group,
Department of Biology, Beckman Research
Institute, City of Hope Medical Center,
Duarte CA 91010, USA
Fax: +1 626 930 5366
Tel: +1 626 301 8348
E-mail:
(Received 10 December 2007, revised 18
February 2008, accepted 12 March 2008)
doi:10.1111/j.1742-4658.2008.06399.x
The finding of a genome-wide oscillation in transcription that gates cells
into S phase and coordinates mitochondrial and metabolic functions
has altered our understanding of how the cell cycle is timed and how stable
cellular phenotypes are maintained. Here we present the evidence and argu-
ments in support of the idea that everything oscillates, and the rationale
for viewing the cell as an attractor from which deterministic noise can be
tuned by appropriate coupling among the many feedback loops, or regu-
lons, that make up the transcriptional–respiratory attractor cycle. The exis-
tence of this attractor also explains many of the dynamic macroscopic
properties of the cell cycle and appears to be the timekeeping oscillator in
both cell cycles and circadian rhythms. The path taken by this primordial
oscillator in the course of differentiation or drug response may involve per-
iod-doubling behavior. Evidence for a relatively high-frequency timekeep-
ing oscillator in yeast and mammalian cells comes from expression array
analysis, and GC ⁄ MS in the case of yeast, and primarily from macroscopic
measures of phase response to perturbation in the case of mammalian cells.
Low-amplitude, genome-wide oscillations, a ubiquitous but often unrecog-
nized attribute of phenotype, may be a source of seemingly intractable
biological noise in microarray and proteomic studies. These oscillations in
transcript and protein levels and the repeated cycles of synthesis and degra-
dation they require, represent a high energy cost to the cell which must,
from an evolutionary point of view, be recovered as essential information.
We suggest that the information contained in this genome-wide oscillation
is the dynamic code that organizes a stable phenotype from an otherwise
passive genome.
Abbreviations
FFT, fast Fourier transform; GFP, green fluorescent protein; PCA, principal components analysis; SVD, singular value decomposition;
TRAC, transcriptional–respiratory attractor cycle.
2372 FEBS Journal 275 (2008) 2372–2384 ª 2008 The Authors Journal compilation ª 2008 FEBS
this precise temporal organization favors a view of the
cellular phenotype as a globally coupled dynamic struc-
ture, a periodic attractor [8–10]. Here, we focus the
argument for one or the other of these two alternative
models for regulation of gene expression by close anal-
ysis of a recent study by Newman et al. [7], who exam-
ined the contribution of extrinsic and intrinsic noise [5]
to the regulation of protein levels in Saccharomyces
cerevisiae. By flow cytometric sorting of 4130 cultures,
each with a different green fluorescent protein (GFP)-
tagged protein, they were able to compare the relative
levels of 2500 proteins under several different growth
conditions and in different media. Based on the
assumption of steady-state kinetics, that is that protein
expression varied in a way that was independent of any
underlying intrinsic oscillatory dynamics, they identified
several processes and a number of genes whose behav-
ior was classified as noisy or quiet. Genes involved in
protein synthesis and degradation were quiet, whereas
those that functioned in the peroxisome or amino acid
biosynthesis were noisy. In addition, they found several
paradoxical relationships – most notably instances in
which protein levels were high when the corresponding
message was low. Although this study was a technical
tour de force, it does admit of another interpretation,
one that is both predictive of the apparent noisiness of
gene regulation and consistent with the precision of
known biological rhythmicities.
A transcriptional attractor explains
apparent noise in protein regulation
Using the classifications of Newman et al. [7] to iden-
tify proteins whose regulation was ‘noisy’ or’ quiet’, we
examined the patterns of expression in our gated syn-
chrony culture system [1]. Functionally related groups
of proteins whose regulation was found to be quiet,
such as Golgi, ribosomal and other translation-related
functions, showed regular low-amplitude (1.1- to 2.1-
fold) oscillations in transcription, whereas stress, respi-
ratory, peroxisomal, and other proteins classed as noisy
were characterized by precise but very high-amplitude
(2- to 72-fold) oscillations. In Fig. 1A, the pattern of
expression through four transcriptional cycles of the
transcriptional–respiratory attractor cycle (TRAC) of
transcripts whose protein regulation in temporally
uncharacterized cultures of S. cerevisiae were classified
as noisy are shown. These transcripts were also identi-
fied as having high coefficients of variation in flow
cytometric analysis of GFP fluorescence distributions.
This pattern generalizes throughout the transcriptome
– quiet genes show low-amplitude oscillations, noisy
genes express transiently at high amplitudes. In Fig. 1B
an example of a single transcript, OPT1, and the
averages of all the large ribosomal proteins and small
ribosomal proteins transcripts are shown. In Fig. 1C,D
the expression values of OPT1 and the ribosomal
transcripts are randomized and a scatter plot of the
randomized values is shown to simulate how these
genes might appear if analyzed in flow. It is clear that
the apparent variation in OPT1 is much greater than
the average of the ribosomal transcripts and OPT1
might be incorrectly scored as having a low abundance
or ‘quality control’ problems.
In an earlier study [2] we Fourier filtered the tran-
scripts scored as present in all the samples taken for
the time series analysis, and then ordered them accord-
ing to power shown at 40 min, the period of the tran-
scriptional oscillation in our strain IFO0233. Of the
4429 transcripts scored as present, 4328 showed maxi-
mum power in the 40-min range by fast Fourier trans-
form (FFT) analysis [2]. This is very similar to the
number (4311) found with maximum power at 40 min
in our previously published control series [1]. This
analysis suggests that 4328 (97.7%) of the 4429
expressed genes show maximal power in the 40-min
range. From this set, we matched the 500 most peri-
odic against table 1 of the Newman et al. study [7] and
found that 155 of these made the discrimination cate-
gories and were further analyzed by these authors. The
variance in this group was much greater than that in
the population of GFP-labeled proteins as a whole.
What is most important is the observation that, of the
50 most periodic in our study, only 16 could be ana-
lyzed by Newman et al. and all but two of these were
among the least periodic of the group. Those elimi-
nated from that study were often eliminated because
of low abundance. In some instances these were pro-
teins whose messages in our synchronous cultures
showed very high intensities. We reason that these pro-
teins are made periodically, as their messages are, and
in many instances catabolized rapidly. In our tran-
script group, only 3 of every 12 samples show levels
much above background and only 1 in 12 show high
levels. In a random or temporally uncharacterized pop-
ulation only 8–20% of the cells would give good sig-
nals. To illustrate this, 15 genes have been selected
that show periodic expression at rather high levels and
yet appeared to be of low abundance (Fig. 1A). One
of these, MET14 reaches intensity levels of >17 000
and then rapidly falls to levels of 300 units. The ten-
dency in flow analysis of GFP-tagged proteins in a
population of cells may have been to exclude the most
periodic proteins based on assumptions of stochastic
regulation, constitutive synthesis or random variations
in level around the steady state.
R. R. Klevecz et al. The cell as an oscillator
FEBS Journal 275 (2008) 2372–2384 ª 2008 The Authors Journal compilation ª 2008 FEBS 2373
These high-amplitude oscillations, where expression
levels go from background to maximum and return to
background levels very quickly, are characteristic of
20% of the transcriptome. This pattern would seem
to provide direct visual evidence of the low level of
combined biological and measurement noise that is
possible in a well-controlled biological system. New-
man et al. [7] noted that for some proteins, levels of
the coding transcript were inversely correlated with the
level of protein. Such a seemingly paradoxical outcome
is understandable from the pattern of expression in the
high-amplitude oscillations shown in Fig. 1 and is a
predicted consequence of periodic zero-order synthesis
and constant first-order decay of the message under
almost any circumstance where the protein has a
longer half-life than the message. Calculations based
on this assumption yield a signal-to-noise ratio of
> 50 db for many of the transcripts showing this pat-
tern of oscillation. Note that the data used for the fig-
ure above was taken from the phenelzine treatment
experiment so that cycles 2–4 are post treatment. The
increase in level of the transcripts is associated with
the treatment.
One caveat remains – it is possible that the oscilla-
tions are driven by the process that causes the cultures
to synchronize. Evidence of quantized generation times
in mammalian cells tends to refute this idea but it does
seem plausible that synchronization might increase the
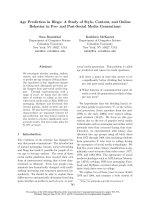
A
CD
B
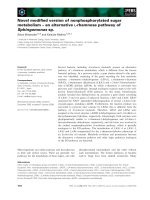
Fig. 1. Noisy and quiet genes represent high and low amplitude oscillations. (A) Transcripts from the gated synchrony culture system,
whose proteomic patterns and coefficients of variation classed them as noisy, are shown in relationship to the benchmark oscillation in dis-
solved oxygen (DO). Sixteen transcripts maximally expressed in the respiratory phase are shown (solid lines) in relationship to dissolved oxy-
gen (filled circles). (B) One of these transcripts, OPT1 (filled triangles), is shown relative to the averages of all 52 of the small ribosomal
protein transcripts (filled circles) and all 74 of the large ribosomal protein transcripts (filled squares). In both figures the expression for each
gene is scaled by dividing each value by the average of all values for that gene in the first or control cycle of the experiment (first 11 sam-
ples). Intensity values for the high-amplitude oscillation transcript OPT1 range from 200 to 6000 intensity units. Scatter plots of the random-
ized expression values for RPS (C) and OPT1 (D) indicate the differences in variance that might be expected if sampling was done on a
temporally uncharacterized culture.
The cell as an oscillator R. R. Klevecz et al.
2374 FEBS Journal 275 (2008) 2372–2384 ª 2008 The Authors Journal compilation ª 2008 FEBS
amplitude of the oscillation. Inherent in many of the
starting points for analysis of microarray data is the
idea that the underlying process involves cells that
exist at a steady state and that the values obtained
come from an ergodic process. The distinction between
what can be found in high throughput data from
temporally uncharacterized biological systems by the
application of appropriate methods such as singular
value decomposition (SVD) or principal component
analysis (PCA) and the relevance of this to ergo-
dic theory has been addressed in detail by Tsuchiya
et al. [11].
Evidence for genome-wide oscillations
in transcription
Expression levels were determined using Affymetrix
microarrays in two separate experiments during which
a total of 80 time series samples were taken through
seven cycles (four control cycles and three treated) of
the oscillation. We showed that oscillations are a ubiq-
uitous property of yeast transcripts [1,2]. The temporal
organization that gives rise to the well-characterized
40-min oscillation in dissolved oxygen is manifested in
the sequestering of transcripts into those maximally
expressed in the reductive phase and those maximally
expressed in the respiratory phase. Typically, the
reductive phase is roughly twice the length of the respi-
ratory phase and expression maxima are largely
restricted to three equally spaced intervals in the cycle
– one in the respiratory phase and two in the reductive
phase. We have suggested that this TRAC is responsi-
ble for the temporal organization of the phenotype
and for the timing of developmental processes such as
the cell cycle. The temporal coordination manifested
by the TRAC appears to involve essentially all cellular
functions thus far examined. Given the alternation of
the redox state, it should not be surprising to find that
the alternation of respiration and reduction also
extends to the functional state of the mitochondria
[4,12,13]. Of current interest is the role that these
high-amplitude oscillations play in protein synthesis,
degradation and functional state. Transcripts for
ubiquitin–proteosome function are made at just one
phase of the cycle suggesting that protein catabolism
is temporally organized and oscillatory. In addition,
transcripts for mitochondrial and cytosolic ribosomal
proteins, sulfur metabolism, amino acid biosynthesis
and most of the Golgi and peroxisome-related tran-
scripts are made together at particular points in the
cycle. This temporal organization extends to the
synchronous gating of cells into the S phase. DNA
replication in these cells begins abruptly at the end of
the respiratory phase as oxygen consumption decreases
and H
2
S levels rise. The restriction of DNA replication
to the reductive phase of the cycle is seen as an evolu-
tionarily important mechanism for preventing oxida-
tive damage to DNA during replication. The time
sharing that occurs in each redox cycle reproduces the
two antithetical environments that are thought to have
led to the fusion of primitive unicells – one an Archa-
eal host capable of producing H
2
S from environmental
sulfate and a proteobacterial H
2
S oxidizing endosym-
biont engulfed by phagocytosis [14,15]. This 40-min
metabolic cycle has been observed in essentially every
unicellular system examined. Making the connection
between this well-known metabolic cycle, transcription,
DNA replication and the cell cycle heightened interest
in the relationship between oscillations and the organi-
zation of phenotype. The evidence that the cell is a
coupled oscillatory system has been further strength-
ened because the original observation discussed above
in studies by Murray and his colleagues on the oscil-
lation in a large proportion of the metabolites of
S. cerevisiae growing in gated synchrony cultures and
displaying a 40-min period [3].
Are the dynamics underlying oscillating
culture systems in all cases similar?
Following on from our original report [1], other labo-
ratories took up the system and repeated most of the
generalizations including the genome-wide nature of
the transcriptional oscillation and the restriction of
DNA replication to a phase of the cycle when H
2
S
levels were providing a reducing environment. How-
ever, the metabolic cycle of these cells was 5 h and the
amplitude of the ribosomal protein transcripts was
very high. Whereas our gated synchrony system main-
tains glucose levels in the range optimal for production
of aromatic alcohols, these 5-h cultures were growing
in medium containing half the initial glucose and were
described as nutrient limited [16]. The very high level
of synthesis and degradation of the ribosomal tran-
scripts, the relatively higher levels of transcripts made
at restricted points in the cell cycle and the lack of
phase correspondence (Fig. 2) between our studies and
theirs led us to suggest that system is in most ways
more like reversal of an arrested cell cycle than a sto-
chastic tissue. Experimentally, there seems little doubt
that cells do display genome-wide oscillations in tran-
scription despite statistical arguments which would
limit the number of oscillatory transcripts to some
significant fraction of all transcripts. This quickly
degenerates into an argument regarding the best
method of describing a transcriptome. If we start with
R. R. Klevecz et al. The cell as an oscillator
FEBS Journal 275 (2008) 2372–2384 ª 2008 The Authors Journal compilation ª 2008 FEBS 2375
the belief that cells are at equilibrium unless driven or
perturbed away from that state then it is natural to
assume that the variability in transcript or protein lev-
els in temporally uncharacterized cultures is a measure
of regulatory noise and if some processes or cellular
components seem to have more or less of this noise it
is natural to attempt to incorporate this phenomenon
into the regulatory machinery of the cell. The correla-
tion between noisy proteins and precise high-amplitude
oscillations is very good and the evidence that one can
say that transcripts with low-amplitude oscillations are
oscillatory is strong. It comes down to the idea that in
expression microarrays certain platforms and methods
of amplifying and detecting levels of message are much
better than we might have thought, which implies that
in many cases the underlying cell biology is poorly
defined in the time domain.
To further this crucial recognition of the new para-
digm we urge increased attention to source and sam-
pling of biological systems and the application of
analytical tools more appropriate to time series data or
extraction of the global properties of the system such as
SVD, PCA, self-organizing maps, wavelet multiresolu-
tion decomposition and, for high-quality time series
data, FFT analysis. As discussed in detail below, prior
to the exploitation of the gated synchrony culture sys-
tem to collect true time series data sets, expression
arrays were applied to cells in forced synchronization
methods and involved data sets too short and noisy for
comfortable application of Fourier analysis. We now
have the capacity to follow the transcriptional patterns
of all expressed genes to construct a system-wide
dynamic network. By assessing the temporal pattern of
gene expression in all of the transcripts closely through
time following perturbation, we can begin to construct
the dynamic architecture of phenotype and to derive
the first measurements of coupling strength among
genes. Such information is essential to constructing a
detailed formal representation of the cellular attractor.
Network representations based on two-hybrid, chip–
chip or MS interactions [17–21] give us a sparse map-
ping of genes that interact but have not offered clear
insights into dynamic connectivity among genes and
their transcripts. One effort here is to bring together
genome-wide changes through time and the more tradi-
tional gene centered steady-state network perspective.
Some details of the analysis of time
series data from the gated synchrony
system
Application of Fourier analysis and wavelet decompo-
sition to the available time series data sets finds that
more than three quarters of all transcripts expressed in
S. cerevisiae can be shown to oscillate. Limiting such
time series analysis to transcripts found to be present
in all samples from a time series study finds that all
but 2% are oscillatory. Those that fail the test fre-
quently show higher frequency oscillations or are of
such low expression as to make them practically unan-
alyzable. Alternatively, by setting the P-value for sig-
nificance of the variance obtained through classical
statistical processes sufficiently high, > 0.001, it is pos-
sible to make the claim that just a few hundred tran-
scripts oscillate. Better than any other argument, this
shows the chasm between statisticians and dynamicists
and the importance of having the correct model
through which the data analysis is pursued.
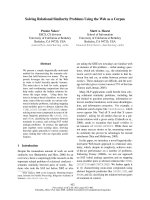
A
B
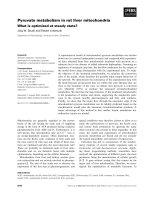
Fig. 2. Phase relationships of transcripts from short and long per-
iod metabolic cycles. Scatter plots of all periodic transcripts found
to be present in all three of the time series data sets considered
are shown [1,2,16]. (A) Results of the original control series are
paired with the results from the phenelzine perturbation experi-
ment. Perfect correspondence would appear as a dotted line with a
slope of one. In the original phenelzine it was noted that the major
effect of the drug initially delays the phase of maximum expression
in the mid-reductive phase transcripts. This led to a transient
increase in period length in the oscillation. The delay in phase is
manifested in a population of transcripts displaced downward from
the line of correspondence. Slight differences in phase from near
zero to near 360° are a plotting artifact. (B) Results from Li and
Klevecz [2] are plotted against those of Tu et al. [16].
The cell as an oscillator R. R. Klevecz et al.
2376 FEBS Journal 275 (2008) 2372–2384 ª 2008 The Authors Journal compilation ª 2008 FEBS
Using the data from the three time series data sets
with sufficient sample length and density to permit
Fourier analyses, we find that the original report has
4169 transcripts that show a 40-min period [1], where
each of the three cycles were scaled prior to analysis.
This was done as described in the original study
because the data were taken from two separate experi-
ments with slightly different amplitudes and periods of
oscillation. In the second study by Li and Klevecz [2],
using what we regard as the optimal adjustment for
hybridization efficiency, we get 4328 transcripts with a
40-min periodicity. Using this same adjusted data and
applying an adjustment for sequence that number goes
to 4780. In the case of the Tu et al. [16] data, using
their raw CEL files we find 4832 transcripts with a per-
iod of 5 h, equal to that of the dissolved oxygen,
whereas using the GSM files we find 4910 periodic
transcripts. One major difference between the findings
from the two laboratories is in the period of the oscil-
lation. This makes difficult any conclusion beyond the
obvious one that in both systems most transcripts
oscillate. The standard strain, IFO0233, used in many
of the earlier works has a period of 40 min and it
must be noted that all of the earlier studies on what
was called an ultradian or metabolic oscillation
reported an oscillation in oxygen consumption in the
40-min range. The CEN.PK strain cells in our hands
have a period that varies, quantally between 2 and 4 h.
The report from Tu et al. [16] describes an oscillation
with a period of 5 h. The greatest differences in the
results from the two strains are in the phase of maxi-
mum expression. This difference appears to be empha-
sized if the phase is determined from FFT analysis.
Even though the sampling density and length are
greater than anything done previously, they appear
insufficient to allow FFT analysis to dissect the correct
phase. Reductive phase transcripts in our studies fre-
quently had two maxima, one in early reductive and
one in late reductive. In most instances Fourier is
unable to distinguish these and instead finds a mid-
reductive maximum (Fig. 2B). This by itself is not suf-
ficient to account for the phase differences between
our data [1,2] and that of Tu et al. [16]. Here we show
the genome-scale comparison of the phases of maxi-
mum expression in the three data sets (Fig. 2). The
comparison between our 2004 and 2006 data sets is
quite good considering that the 2006 data set was
taken prior to and following a treatment with phenel-
zine, a drug that alters the period of the oscillation.
Indeed, the beginnings of the phase response to drug
treatment can be seen in the cluster of transcripts that
fall away from the line of perfect correspondence of
phase. Plotting as a scatter plot either of our results
against those of Tu et al. [16] yields a pattern with lit-
tle correlation. Of interest is the somewhat different
result that comes out of a matching of phases from the
scaled data from the three sets using a simple calcula-
tion of maximum expression (data not shown).
In many ways, the simplest projection, a color tem-
perature map in which the level of gene expression,
from red maxima to blue minima [1,2] is the most
informative of the overall behavior of the transcrip-
tome and shows very clearly that expression maxima
sequestered temporally to certain phases of the oscilla-
tion. Self-organizing maps analysis tends to associate
transcripts with similar phases of expression and when
embodied as it is the GEDI analysis [22] enables one
to use the color temperature map dynamically and in
effect make a movie of the phase and amplitude rela-
tionships among the transcripts through the cycles of
oscillation [2]. Thus far, we have considered only indi-
vidual transcripts analytically and then put them into
a system-wide perspective by the method of presenta-
tion. PC and SVD analysis use the collective properties
of the system to extract the information content and
present it a set of vectors of reduced dimensionality.
All of these methods lead one to conclude that the cell
is an oscillator. For those few constituents that cannot
be shown to oscillate, we will point to dynamic systems
theory, which says that as more things oscillate in a
coupled system the likelihood that everything oscillates
increases [23]. We would conclude that if more than
half of all expressed transcripts oscillate then this
probability becomes a near certainty.
Picturing the cellular phenotype in
concentration space and time
Viewed from a temporal perspective, the patterns of
expression are less complex than we might have
expected from a consideration of the combinatorial
potential. The trajectories through concentration space
followed by most of the 5000 expressed yeast genes
can be modeled as a thick surface with some loss of
information but greatly increased accessibility. What
such a presentation does not give us are the detailed
gene-by-gene connectivity relationships. However, it
does suggest an experimental path to determining such
relationships. If by treating cells with a drug such as
phenelzine and following the changes that occur in the
surface as the system responds, we have at least the
beginnings of a map of the coupling and ⁄ or co-regula-
tion among differing genes. Recent studies have shown
that changes in gene expression in response to pertur-
bation by drugs occur through a folding or unfolding
of the surface described by this circle of transcripts,
R. R. Klevecz et al. The cell as an oscillator
FEBS Journal 275 (2008) 2372–2384 ª 2008 The Authors Journal compilation ª 2008 FEBS 2377
and suggest, as a generalization, that the path from
this 40-min oscillation to the cell cycle and circadian
rhythms takes place through a series of period two or
period three bifurcations. These foldings in the surface
of the putative attractor result in an increasingly dense
set of nested trajectories in the concentrations of mes-
sage and protein. In some expression array studies it
appears that there are times in the attractor cycle when
large clusters of transcripts are synthesized, whereas at
other times there are relatively few. This has suggested
that the maintenance of a stable phenotype requires a
specific spatio-temporal structure with synthetic events
occurring at antipodal phases around the steady state
– what we might call the dynamic architecture of phe-
notype. Likewise, SVD shows that the principle eigeng-
enes [24] yield a similar picture of the attractor
surface. How this surface might change as period
lengthens or as a cell differentiates is one of two
important and closely related questions that should
form the focus of future studies. If we examine the
three principle eigengenes derived from an SVD analy-
sis of the entire population of transcripts and plot
these as a three dimensional figure we can see the
dynamic surface generated. SVD and PC give us a
global measure of the information content of the sys-
tem as expressed in the vectors and it is clear that in
all three experiments the system is globally oscillatory.
The disadvantage of SVD analysis is the difficulty of
getting an intuitive understanding of the difference in
the surfaces generated beyond saying that it appears to
be an oscillatory system. Again, the surfaces generated
by SVD analysis from the 40-min cycles (Fig. 3A,C)
are similar to one another in forming a bowl or conical
shape around the steady state. In other projections of
the phenelzine-treated cells, the increase in cycle time
following treatment can be clearly seen [2]. In Fig. 3B,
the same three eigengenes are shown for the data of
Tu et al. [16]. This structure is interesting in its simple
butterfly shape and gives the appearance of being com-
posed of two identical halves. In other projections the
surface appears as a line shaped as an inverted ‘V’.
Reanalysis of the early expression
array data
Prior to the discovery of genome-wide oscillations in
transcription – at a time when the first microarray
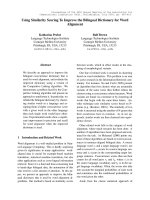
A
B
C
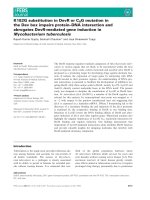
Fig. 3. Eigensurfaces of the genome-wide oscillations in transcrip-
tion. Data from all transcripts scored as present in each of the
three experiments were analyzed. In each case eigengene 1 is a
near constant and serves to normalize the results. Eigengenes 2, 3
and 4 were plotted with identical projection axes.
The cell as an oscillator R. R. Klevecz et al.
2378 FEBS Journal 275 (2008) 2372–2384 ª 2008 The Authors Journal compilation ª 2008 FEBS
studies of the yeast cell cycle were published as part of
the Stanford cell-cycle project [24,25] – it seemed clear
that the prevailing model, the model against which the
results were interpreted followed the pathways para-
digm – the cycle as a series of branched and connected
linear sequential steps, or perhaps ‘the just in time
notion’ – an assembly line along which the cell
chugged on its way to division. This binarized model is
a perfectly logical extension of mutational analyses
that gives a sparse mapping of cellular processes – a
mapping of the necessary but not sufficient steps –
through the cycle. Such an analysis is discrete and
uncomplicated by the moment-to-moment, or hour-to-
hour changes in metabolites or macromolecules. To a
large degree this old paradigm was responsible for our
success in the molecular genetic dissection of the gen-
ome. At that time, and despite solid theoretical under-
pinnings, the notion of the cell as a dynamical system
was not much in evidence. But the cell is a coupled
complex system and, in such systems, when the con-
centration of one constituent changes, it tugs, to a
greater or lesser degree, on the entire network. One
can speculate that in this post-genomic era, the elabo-
ration of this tugging response to intentional perturba-
tions will allow us to predict and control phenotype.
Given the prevailing models at the beginning of the
microarray era, one can imagine that the single great-
est surprise coming out of wavelet and SVD analyses
of cell-cycle data was the consensus finding that much
of the transcriptome oscillated [24,27–32], not just the
400 or 800 ‘cell-cycle-regulated’ genes. Following on
from initial reports [25,26], in which data analysis
involved either linear clustering or Fourier analysis of
these very short data sets, there appeared a series of
re-analyses of the Stanford cell-cycle data in which
methods more suited to short, sparse and noisy data
were employed by Alter et al. [24,31,32] and Rifkin
and Kim [30] in their SVD-based analyses, and
Klevecz and Douse [28] and Klevecz [29] using wavelet
decomposition, all concluded that there was evidence
for a genome-wide oscillation in transcription. It was
in these early studies that SVD was shown to be an
excellent method for developing a global representa-
tion of the expression profiles. It seemed as well to
identify both biological perturbations and measure-
ment variability. Perturbations due to serum or
media additions were detected in the Alter et al.
analysis [31].
Using an entirely different approach involving wave-
let decomposition [28,29], it was possible to partition
away high-frequency noise and low-frequency trends in
the Stanford yeast cell-cycle data to uncover genome-
wide oscillations in expression in 4500 of the 6178
gene expression profiles. These were typically of cell-
cycle or half-cell-cycle duration, with periods of 40 and
80 min in these rapidly dividing cultures grown on
high glucose. Because the Stanford data set lacked rep-
licates, an image-processing strategy was used to
enhance the pattern of peaks and troughs in the noisy
low amplitude oscillations: the wavelet decomposition
for each gene at each level was aligned side-by-side
with all other genes at that level. The resulting pattern
in color contour maps showed a series of bands or
peaks with a great deal of phase coherence, with peri-
ods of either 40 or 80 min. In agreement with the SVD
analysis, this finding suggested that there are large-
scale oscillations in transcription but also finds
evidence of higher frequency 40-min oscillations in
mRNA levels through the cell cycle. It was this finding
that led to our time series analysis of transcription in
the gated synchrony culture system. If the cell is an
oscillator whose behavior is revealed by synchroniza-
tion techniques, is it safe to assume that we have a
random population if no particular effort has been
made to synchronize the cell culture or the tissue? I
think the answer must be no under circumstances
where there is significant cell-to-cell communication.
We should pause to consider what it means to so
many standard paradigms and methods of analysis if it
is true that everything oscillates.
When everything oscillates
l
Economy of explanation requires that the cell be
viewed as periodic, an attractor.
l
Calculations of drug response, message and protein
half-lives based on steady-state assumptions may be
wrong.
l
The canonical twofold boundary for significance is
not ‘noise’ in the conventional sense but signal
expressed with oscillatory dynamics.
l
Stable and precise mammalian cell culture systems
where these oscillations can be more thoroughly
studied are urgently needed.
The cell cycle is a developmental
process not a cycle
If everything oscillates and does so with a period that
is an integral submultiple of the cell cycle, then the cell
cycle, as it is conventionally understood, is a develop-
mental process not a cycle. It is timed but does not
keep time. We and others [10] have published several
reviews of cell-cycle regulation that presented the fun-
damentally different view of the timing of cell-cycle
events by an attractor.
R. R. Klevecz et al. The cell as an oscillator
FEBS Journal 275 (2008) 2372–2384 ª 2008 The Authors Journal compilation ª 2008 FEBS 2379
From the 1950s onward four different conceptual
pictures of the cell cycle in eukaryotes emerged. Each
is based on a relatively distinct body of data and has
spawned a relatively distinct research tradition. Briefly,
these four views are as follows. (1) An image of the
cell cycle as an interlocked and partially branched
sequence of discrete events, linked in more or less com-
plex causal chains. The primary evidence comes from
genetic experiments on the budding yeast, S. cerevisiae,
in which a number of temperature-sensitive cell
division cycle (cdc) mutants that prevent normal
cycling at the restrictive temperature were collected
and studied. Many of these mutants have the property
that cells cannot initiate or complete some easily mea-
sured event associated with the mutated gene. This is
an easily grasped model and is similar in many ways
to the later ‘just in time’ models. In the time before
high-throughput technologies a few did challenge the
notion that the cell cycle was blocked by the mutant in
question by pointing out that in the cases where it has
been studied essentially everything the cell did except
for those few processes downstream from the muta-
tional block when on, with the period of the cell cycle.
To put it in modern terms, cell-cycle mutants cause the
attractor to be sub-threshold with respect to the
mutant-blocked event. (2) A strictly stochastic state
model with two or more discrete states and random
transitions between them. This began as the transition
probability model [33] and emphasized analysis of the
distribution of cell age at mitosis in a population of
presumptive identical cells in which there is some limit-
ing material. Events within the cycle are initiated when
this material is present in sufficient quantity. Concep-
tually, this view is now taken up in the low message
copy number problem and the resulting view of regula-
tion as stochastic. With a few exceptions this type of
model is forced to ignore the many dynamic behaviors
seen in cellular oscillators and circadian biological
clocks. (3) ‘Sizer’ models, based on the concept that a
reliable ratio of cytoplasmic mass to nuclear content
must be maintained, and hence that this ratio plays a
critical role in the timing of cycle events. This was an
adequate representation in the early days of cell-cycle
modeling but apart from efforts to couple this to limit
cycle oscillators [34] has no standing today. (4) Bio-
chemical oscillator models, which in a variety of forms
have been based on the view that essential variables
wax and wane in concentration during the cell cycle
and trigger events when they reach appropriate thresh-
olds of concentration [10]. This tradition has explored
phenomena suggestive of smooth alterations in concen-
trations by external perturbations, leading to phase-
resetting phenomena or to phase conflicts when cells at
different phases are brought together to allow cell-to-
cell communication.
Quantized generation times [35], together with
perturbation analyses, formed the experimental foun-
dation of efforts to synthesize a model of the cell cycle
in which such disparate concepts as check points, and
limit cycles or complex attractors were fused. The basic
idea was that checkpoints represent sub-threshold
oscillations in an attractor that underlies the cell cycle.
The oscillator that gave rise to gated cell divisions in
mammalian cells was shown to be phase responsive
and temperature compensated. The quantized genera-
tion time model was extended to other cell types and
to gating of circadian rhythm-based cell division in
plants, dinoflagellates and a variety of mammalian
cells in culture. One prediction of the attractor models
was that all cell cycle events would be gated by the
attractor, and this period would be an integral sub-
multiple of the cell cycle or circadian rhythm it timed.
Quantized generation times were the first direct evi-
dence of a cellular clock, but the more recent finding
that the continuous culture system in yeast appears to
be timed by a similar oscillator that can be tuned or
driven to ‘fold’ (i.e., undergo a series of period two or
period three bifurcations), and that cell-cycle events in
S. cerevisiae appear to be gated by this transcriptional
cycle suggests that a similar phenomenon, although on
a different time scale, is operating in all systems from
yeast to mammalian cells. This realization has opened
a new and experimentally more accessible path to
investigations of synchronous gating and the role
of oscillations in generating and maintaining a stable
phenotype.
Are equal numbers of genes
transcribed at all points in the cycle?
In their analysis of the alpha factor synchrony, Alter
et al. [27] built a color mapping of the pattern of
change for all transcripts through the cycle which sug-
gests that there are phases in the cycle when relatively
greater numbers of genes are maximally expressed than
at other times. This is clearer in the cdc15 synchrony,
where the two principle components or ‘arraylets’ tend
to be maximally expressed at just two points in the
cycle. This phase coherence was also seen in the wave-
let decomposition analysis for the cdc28 and alpha fac-
tor synchronies [23,24]. This restriction of transcription
to distinct points in the TRAC is clearly seen in
the two papers published using the gated synchrony
culture system. Given that there are large variations in
the number of messages being synthesized at any point
in the cycle, a potential artifact exists with respect to
The cell as an oscillator R. R. Klevecz et al.
2380 FEBS Journal 275 (2008) 2372–2384 ª 2008 The Authors Journal compilation ª 2008 FEBS
the assignment of phase of maximum transcript level
in the standard methods of expression array analysis
using either Affymetrix chips or spotted arrays. Con-
sider the hypothetical instance in which 90% of the
transcripts are made at one brief phase of the cycle
with the remaining transcripts made uniformly through
the remainder of the cycle. Adding equal amounts of
message to the hybridization mix will reduce the contri-
bution of the high transcript phase significantly. If we
further normalize by requiring equal total hybridization
in all samples then we have pretty much insured that all
phases of the cycle will have the same total message and
therefore, that the points with few messages may cause
these to be over-represented. The only sure way to avoid
this is to spike into the samples at the time of RNA
isolation a set of standards not expressed by the cells of
interest and to normalize each microarray to constant
expression in these standards. In two color assays, the
post-amplification normalization against a randomized
composite of all samples eliminates only the second
normalization as a source of error. We are exploring the
addition of constant amounts of Schizosaccharomyces
pombe purified mRNA to the samples at the beginning
of RNA isolation.
The use of actin and other constitutive, maintenance
or housekeeping genes as normalizing standards is a
time-honored practice in PCR and other amplification
assays. Warrington et al. [36] addressed this question
in an analysis of human adult and fetal tissues. Of the
535 genes identified as highly expressed in all tissues
examined, all but 47 varied by > 1.9-fold. They cau-
tion that further analysis might find regular variations
in these low amplitude transcripts as well. That a gene
is expressed constitutively does not mean that its tran-
script is maintained at a constant level through the
cycle. It is important to know in any system, whether
these genes show regular oscillations in expression. If
so, then they become a questionable standard.
Viewing continuous cultures of yeast
as a stochastic tissue
The details of the cellular dynamics that lead to the
emergence of redox and TRAC oscillations and the
gating of cells into cell-cycle stages are still not com-
pletely known. What seems clear is that at the cell den-
sities required for emergence of the oscillation,
between 2 and 8 · 10
8
cellsÆmL
)1
, the cultures are in
effect tissues. The distance between cells is less than
one cell diameter so that there is the potential for con-
stant exchange of materials directly as well as through
diffusion. The collisions are random and in some sense
global rather than local as in a mammalian tissue.
Moreover, because of the balance between new cells
appearing by division and the removal of cells by dilu-
tion there are always a disproportionate fraction of
newly divided cells – the exponential growth distribu-
tion. Further complicating the simulation or calcula-
tion of cell-cycle times within the gated synchrony
population is the clear indication that newly divided
daughter (virgin) cells have longer cycle times then the
newly divided mother. How that signaling of a cell not
yet ready to replicate or divide effects a cell that would
otherwise be ready to divide is central to understand-
ing how cells with adequate nutrients are prevented
from replicating and dividing with the minimal genera-
tion times. Kinetically, the yeast stochastic tissue and a
mammalian tissue such as the epithelial cells of the
gastro-intestinal tract are similar – if on different time
scales. In the gastrointestinal tract of mammals the
cell-cycle time of a particular cell is in the range
5–10 days, even though a fraction, typically 10–15%
of the cells in that tissue divides each day at the same
time of day. In the yeast gated synchrony system,
where the TRAC is 40 min, 8–10% of the cells divide
in each turn of the cycle, even though the cell cycle
time of these cells is 8 h. Mammalian cells when
explanted to culture exhibit an ability to grow with
generation times much shorter than 10 days, typically
24 h. Similarly in yeast cells diluted and re-fed with
the conditioned medium, the cells divide with a 2-h
generation time.
Quorum sensing, quorum conflicts and
quorum compromise
In simulations of tissue growth we have suggested that
the slowing of growth occurs by virtue of phase con-
flicts between coupled neighboring cells, with the
‘younger’ cells retarding the kinetics of the older cells.
We have called this a quorum conflict. Verstrepen
et al. [31] suggested that it is likely that many lab
strains of S. cerevisiae, some of which oscillate poorly,
have been inadvertently selected for properties that
minimize the ability to respond to signaling com-
pounds, such as the aromatic alcohols, to form bio-
films. Biofilm formation involves cell to cell signaling
growth in non-repressing concentrations of glucose
and requires high cell densities, all attributes of the
gated synchrony culture system. We believe that this is
a potentially fruitful path to follow.
When grown to sufficient cell densities, gener-
ally > 2 · 10
8
, cell-to-cell communication occurs via
acetaldehyde and H
2
S and, we speculate other as yet
unknown signals related to pseudo-hyphal growth such
as phenylethanol and tryptophol.
R. R. Klevecz et al. The cell as an oscillator
FEBS Journal 275 (2008) 2372–2384 ª 2008 The Authors Journal compilation ª 2008 FEBS 2381
Signaling caused the cells to become synchronous
with respect to their respiratory–reductive cycle while
remaining partially synchronous with respect to DNA
synthesis and cell division. So although it is known
that acetaldyde and H
2
S might be sufficient to explain
the onset of respiratory–reductive cycle synchrony,
they are not sufficient to explain the partial synchrony
seen in the cell cycle and more to the point why it is
that cultures do not always begin respiratory reductive
cycling. One idea developed below is that there are sta-
ble nodes of oscillation that require a particular phase
relationship between the TRAC and the cell cycle. The
release of H
2
S by a significant fraction of the cells in
the fermenter ensures that no cells in the fermenter will
be able to respire. We have suggested that the time
sharing that occurs within every cell with DNA repli-
cation taking place only during the time that H
2
S
release has poisoned mitochondria and prevented res-
piration is an evolutionarily important event. It is not
so clear that the inverse is true, that is, that cells that
are early in the cell cycle and not ready to replicate
DNA must do so just because H2S levels are high and
respiration is not occurring.
Stochastic noise is swept up and
damped by appropriate phase arrange-
ments in a population of individually
noisy oscillators
The idea that cell division and other events might be
retarded by the interaction of cell–cell signaling is
based on simulations of fields of cells coupled through
diffusion of one of the products of the reaction used
to represent the cell cycle in each of the cells. In this
case, the attractor used to represent each cell was the
Rossler attractor and each cell ran the identical oscilla-
tor with respect to all parameters. To test the effect of
diffusive coupling on each of these ‘regulons’ of noise
the system was run in the chaotic domain. In addition
to this deterministic noise, Gaussian noise was also
added at each time step in the simulation [38–40]. The
difference in the fields was the starting phase of the
oscillation. It was discovered that for certain initial
phases, differing patterns emerged across the field. The
most interesting of these were the ‘target pattern’ asso-
ciated with the classic findings in bacterial colonies
expressing quorum sensing and spirals in which
remarkably, the variability in the attractor was largely
damped and the inner members of the spiral near the
core of the spiral were essentially periodic and showed
near limit cycle kinetics. It turned out that these inner-
most oscillators had by chance been arranged so that
they were poised at antipodal phases around the steady
state or singularity. This phase arrangement once
established was very stable to perturbation and could
be ‘transplanted’ into turbulent fields where it would
organize them into spirals. In essence spiral patterns
form when there is not a quorum but a quorum con-
flict in either space or space and time. We suggest that
the theoretical basis for stochastic regulation, the diffi-
culty in formally representing a genetic regulatory loop
with a continuous system of ordinary differential equa-
tions when one of the constituents falls to near zero
values is obviated by thee findings in coupled oscilla-
tory systems. Indeed, in such a coupled system, low
copy numbers may be permitted or selected for so long
as a significant proportion of the transcriptome is
expressed with high-amplitude oscillations. As a spe-
cific example, in the Rossler attractor, regulation of
the high amplitude component where the peak to
trough ratio of the variable is in the range of 100, the
X and Y variables can have peak to trough ratios of
1.3. In such a coupled system any propensity to
stochasticity is swept up by the high-amplitude
components.
Although the earlier modeling was intriguing, it
was startling to find in our expression array analysis
of the gated synchrony system direct experimental
evidence that transcripts were being made in some-
what restricted patterns through the TRAC and that
the times of transcript maxima were clustered in three
or four phases in the cycle. That is, that they were
poised at antipodal phases around the steady state.
So in both theoretical and experimental systems it
appears that in a coupled system, as a cell must be,
any tendency to stochasticity will be swept up into
the attractor surface and show periodic expression,
even under conditions where a significant fraction of
the transcripts express at low levels. Leloup and
Golbeter [41] have addressed the low message copy
number problem directly for a single three variable
reaction-diffusion system and find that sustained
oscillations are possible for message levels in the
range of 10 mRNAs per cell. Going beyond that, we
would argue that in the case of a system-wide oscilla-
tion with maximums in expression at differing phases,
it is the collective copy number that is critical to
sustained oscillations [38–40].
What’s next? What is needed?
As impressive as the yeast gated synchrony is,
there are some unresolved questions regarding the
population dynamics that confound an exact mapping
of expression array data to the dynamics of cellular
phenotype. The application of analytical methods that
The cell as an oscillator R. R. Klevecz et al.
2382 FEBS Journal 275 (2008) 2372–2384 ª 2008 The Authors Journal compilation ª 2008 FEBS
are suited to non-linearities in time series data should
find a wider use. It seems clear that the most successful
and widely applied method so far is SVD (PCA).
Wavelet analysis has many advantages over FFTs for
the data length and densities likely to be encountered
in expression array studies. It will be much improved
if optimized wavelet families are found that can repre-
sent complex patterns in time of transcripts or other
biological signals of interest efficiently and accurately.
References
1 Klevecz RR, Bolen J, Forrest G & Murray DB (2004)
A genome-wide oscillation in transcription gates DNA
replication and cell cycle. Proc Natl Acad Sci USA 101,
1200–1205.
2 Li CM & Klevecz RR (2006) A rapid genome-scale
response of the transcriptional oscillator to perturbation
reveals a period-doubling path to phenotypic change.
Proc Natl Acad Sci USA 103, 16254–16259.
3 Murray DB, Beckmann M & Kitano H (2007) Regula-
tion of yeast oscillatory dynamics. Proc Natl Acad Sci
USA 104, 2241–2246.
4 Klevecz RR & Li CM (2007) Evolution of the clock
from yeast to man by period doubling of the cellular
oscillator. Cold Springs Harbor Symposium 72, in press.
5 Elowitz MB, Levine AJ, Siggia ED & Swain PS (2002)
Stochastic gene expression in a single cell. Science 297,
1183–1186.
6 Cai L, Friedman N & Xie XS (2006) Stochastic protein
expression in individual cells at the single molecule
level. Nature 440, 358–362.
7 Newman JR, Ghaemmaghami S, Ihmels J, Breslow
DK, Noble M, DeRisi JL & Weissman JS (2006) Sin-
gle-cell proteomic analysis of S. cerevisiae reveals the
architecture of biological noise. Nature 441, 840–846.
8 Nicolis G & Prigogine I (1971) Fluctuations in nonequi-
librium systems. Proc Natl Acad Sci USA 68, 2102–2107.
9 Boiteux A, Goldbeter A & Hess B (1975) Control of
oscillating glycolysis of yeast by stochastic, periodic,
and steady source of substrate: a model and experimen-
tal study. Proc Natl Acad Sci USA 72, 3829–3833.
10 Klevecz RR, Kauffman SA & Shymko RM (1984)
Cellular clocks and oscillators. Int Rev Cytol 86, 97–128.
11 Tsuchiya M, Wong ST, Yeo ZX, Colosimo A, Palumbo
MC, Farina L, Crescenzi M, Mazzola A, Negri R,
Bianchi MM et al. (2007) Gene expression waves. Cell
cycle independent collective dynamics in cultured cells.
FEBS J 274, 2878–2886.
12 Murray DB, Klevecz RR & Lloyd D (2003) Generation
and maintenance of synchrony. In Saccharomyces cere-
visiae continuous culture. Exp Cell Res 287, 10–15.
13 Lloyd D, Eshantha L, Salgado J, Turner MP & Murray
DB (2002) Respiratory oscillations is yeast: Clock-dri-
ven mitochondrial cycles of energization. FEBS Lett
519, 41–44.
14 Searcy DG (2003) Metabolic integration during the evo-
lutionary origin of mitochondria. Cell Res 13, 229–238.
15 Searcy DG, Stein DB & Searcy KB (1981) A myco-
plasma-like archaebacterium possibly related to the
nucleus and cytoplasms of eukaryotic cells. Ann NY
Acad Sci 361, 312–324.
16 Tu BP, Kudlicki A, Rowicka M & McKnight SL (2005)
Logic of the yeast metabolic cycle: temporal compart-
mentalization of cellular processes. Science 310, 1152–
1158.
17 Fraser HB, Hirsh AE, Steinmetz LM, Scharfe C &
Feldman MW (2002) Evolutionary rate in the protein
interaction network. Science 296
, 750–752.
18 Tao WA, Wollscheid B, O’Brien R, Eng JK, Li XJ,
Bodenmiller B, Watts JD, Hood L & Aebersold R
(2005) Quantitative phosphoproteome analysis using a
dendrimer conjugation chemistry and tandem mass
spectrometry. Nat Methods 2, 579–580.
19 Macisaac KD, Gordon DB, Nekludova L, Odom DT,
Schreiber J, Gifford DK, Young RA & Fraenkel E
(2006) A hypothesis-based approach for identifying the
binding specificity of regulatory proteins from chromatin
immunoprecipitation data. Bioinformatics 22, 423–429.
20 Rual JF, Venkatesan K, Hao T, Hirozane-Kishikawa
T, Dricot A, Li N, Berriz GF, Gibbons FD, Dreze M
& Ayivi-Guedehoussou N et al. (2005) Towards a
proteome-scale map of the human protein-protein
interaction network. Nature 43, 1173–1178.
21 Desiere F, Deutsch EW, Nesvizhskii AI, Mallick P,
King NL, Eng JK, Aderem A, Boyle R, Brunner E,
Donohoe S et al. (2004) Integration with the human
genome of peptide sequences obtained by high-through-
put mass specrometry. Genome Biol 6, R9.
22 Eichler GS, Huang S & Ingber DE (2003) Gene Expres-
sion Dynamics Inspector (GEDI): for integrative analy-
sis of expression profiles. Bioinformatics 19, 2321–2322.
23 Hess B & Boiteux A (1971) Oscillatory phenomena in
biochemistry. Annu Rev Biochem 40, 237–258.
24 Alter O, Brown PO & Botstein D (2000) Singular value
decomposition for genome-wide expression data pro-
cessing and modeling. Proc Natl Acad Sci USA 97,
10101–10106.
25 Cho RJ, Campbell MJ, Winzeler EA, Steinmetz L,
Conway A, Wodicka L, Wolfsberg TG, Gabrielian AE,
Landsman D, Lockhart DJ et al. (1998) A genome-wide
transcriptional analysis of the mitotic cell cycle. Mol
Cell 2, 65–73.
26 Spellman PT, Sherlock G, Zhang MQ, Iyer VR, Anders
K, Eisen MB, Brown PO, Botstein D & Futcher B
(1998) Comprehensive identification of cell cycle-regu-
lated genes of the yeast Saccharomyces cerevisiae by
microarray hybridization. Mol Biol Cell 9, 3273–3297.
R. R. Klevecz et al. The cell as an oscillator
FEBS Journal 275 (2008) 2372–2384 ª 2008 The Authors Journal compilation ª 2008 FEBS 2383
27 Holter NS, Mitra M, Maritan A, Cieplak M, Banavar
JR & Fedoroff NV (2000) Fundamental patterns under-
lying gene expression profiles: simplicity from complex-
ity. Proc Natl Acad Sci USA 97, 8409–8414.
28 Klevecz RR & Dowse HB (2000) Tuning in the tran-
scriptome: basins of attraction in the yeast cell cycle.
Cell Proliferat 33, 209–218.
29 Klevecz RR (2000) Dynamic architecture of the yeast cell
cycle uncovered by wavelet decomposition of expression
microarray data. Funct Integrat Genomics 1, 186–192.
30 Rifkin SA & Kim J (2002) Geometry of gene expression
dynamics. Bioinformatics 18, 1176–1183.
31 Alter O, Brown PO & Botstein D (2003) Generalized
singular value decomposition for comparative analysis
of genome-scale expression data sets of two different
organisms. Proc Natl Acad Sci USA 100, 3351–3356.
32 Alter O, Brown PO & Botstein D (2001) Processing and
modeling genome-wide expression data using singular
value decomposition. Microarrays: Opt Technol Infor-
matics 4266, 171–186.
33 Brooks RF, Bennett DC & Smith JA (1980) Mammalian
cell cycles need two random transitions. Cell 19, 493–504.
34 Klevecz RR & Shymko RM (1985) Quasi-exponential
generation time distributions from a limit cycle oscilla-
tor. Cell Tissue Kinet 18, 263–271.
35 Klevecz RR (1976) Quantized generation time in mam-
malian cells as an expression of the cellular clock. Proc
Natl Acad Sci USA 73, 4012–4016.
36 Warrington JA, Nair A, Mahadevappa M & Tsygans-
kaya M (2000) Comparison of human adult and fetal
expression and identification of 535 housekeeping ⁄ main-
tenance genes. Physiol Genomics 2, 143–147.
37 Verstrepen KJ, Jansen A, Lewitter F & Fink GR (2005)
Intragenic tandem repeats generate functional variabil-
ity. Nat Genet 37, 986–990.
38 Klevecz RR, Bolen J & Duran O (1992) Self-Organiza-
tion in biological tissues: analysis of asynchronous and
synchronous periodicity, turbulence and synchronous
chaos emergent in coupled chaotic arrays. Int J Bifurca-
tion Chaos 2, 941–953.
39 Bolen JL, Duran O & Klevecz RR (1993) Amplification
and damping of deterministic noise in coupled cellular
arrays. Physica D 67, 245–256.
40 Klevecz RR (1998) Phenotypic heterogeneity and geno-
typic instability in coupled cellular arrays. Physica D
124, 1–10.
41 Leloup JC & Goldbeter A (2003) Toward a detailed
computational model for the mammalian circadian
clock. Proc Natl Acad Sci USA 100, 7051–7056.
The cell as an oscillator R. R. Klevecz et al.
2384 FEBS Journal 275 (2008) 2372–2384 ª 2008 The Authors Journal compilation ª 2008 FEBS