Báo cáo khoa học: Truncated P-cadherin is produced in oral squamous cell carcinoma docx
Bạn đang xem bản rút gọn của tài liệu. Xem và tải ngay bản đầy đủ của tài liệu tại đây (618.82 KB, 13 trang )
Truncated P-cadherin is produced in oral squamous
cell carcinoma
Richard Bauer
1
, Albert Dowejko
1
, Oliver Driemel
1
, A K. Boßerhoff
2
and T. E. Reichert
1
1 Department of Oral and Maxillofacial Surgery, University of Regensburg, Germany
2 Institute of Pathology, University of Regensburg, Germany
Oral squamous cell carcinoma (OSCC) is the most com-
mon cancer in the head and neck region [1]. Despite
improved therapeutic intervention, the 5 year survival
rate is still only 50% [2]. The poor prognosis is closely
related to frequent lymph node metastasis involving
migration and invasion of aberrant cells from the pri-
mary neoplasm to distant sites. Malignant alteration of
cells involves various pathological steps, including
changes in intercellular adhesion. Cadherins comprise
an important family of adhesion molecules that form
adhesive contacts between the cells of solid tissues by
means of Ca
2+
-dependent homophilic interactions.
They are single-pass transmembrane proteins whose
extracellular sequence contains several distinctive, tan-
demly repeated, extracellular cadherin domains (ECs)
[3]. Up to now, more than 80 members of the cadherin
superfamily have been identified. Cadherin subfamilies
can be divided into type I cadherins (classical cadherins
containing an HAV amino acid sequence in EC1) and
type II cadherins. Type I and type II cadherins are
characterized by the presence of five extracellular
cadherin repeats, EC1–EC5; intracellularly, they are
linked to the actin cytoskeleton [4]. During embryonic
development, cadherins control diverse morphogenetic
processes determining tissue boundaries and separate or
fuse different tissue layers, respectively. In pathological
processes, they play a prominent role in tumor
metastasis and cell migration [5].
Keywords
cell adhesion; keratinocytes; migration;
oral squamous cell carcinoma; truncated
P-cadherin
Correspondence
R. Bauer, Department of Oral and
Maxillofacial Surgery, University of
Regensburg, Franz-Josef-Strauss-Allee 11,
93053 Regensburg, Germany
Fax: +49 943 1631
Tel: +49 941 943 1627
E-mail:
regensburg.de
(Received 21 April 2008, revised 12 June
2008, accepted 23 June 2008)
doi:10.1111/j.1742-4658.2008.06567.x
Cadherins belong to a family of homophilic cell–cell adhesion proteins that
are responsible for the establishment of a precise cell architecture and tissue
integrity. Moreover, experimental data suggest that loss of intercellular
adhesion is inversely correlated with cellular differentiation. Furthermore,
dedifferentiation is closely linked to tumor progression. Recently, we have
shown that a secreted 50 kDa N-terminal fragment of P-cadherin plays a
role in the progression of malignant melanoma. In this study, we have
detected both the full-length and the truncated versions of P-cadherin in
cell lysates of differentiated head and neck oral squamous cell carcinoma
cell lines, whereas in cell lysates of dedifferentiated cell lines, we detected
only the truncated 50 kDa version of P-cadherin. Treatment of the cell
lines with a recombinantly expressed biotinylated, soluble 50 kDa form of
the N-terminal part of P-cadherin revealed a major effect on cell aggre-
gation and migration of oral squamous cell carcinoma cells. However, the
50 kDa N-terminal fragment of P-cadherin did not show any influence on
cell proliferation in 2D and 3D cell culture. These results suggest that
generation of truncated P-cadherin during the progression of oral
squamous carcinoma attenuates tissue integrity, facilitates cellular separa-
tion, and leads to the acquisition of a more migratory phenotype.
Abbreviations
CK, cytokeratin; EC, extracellular cadherin domain; HOK, human oral keratinocyte; HRP, horseradish peroxidase; NHEK, normal human
keratinocyte; OSCC, oral squamous cell carcinoma; Pcad50, truncated N-terminal fragment of P-cadherin with a molecular mass of 50 kDa;
Pcad50biot, biotinylated truncated N-terminal fragment of P-cadherin with a molecular mass of 50 kDa; RTS, rapid transcription and
translation system.
4198 FEBS Journal 275 (2008) 4198–4210 ª 2008 The Authors Journal compilation ª 2008 FEBS
OSCC cells are malignantly transformed keratino-
cytes. They show a strong tendency to invade lymph
nodes and spread to distant sites relatively quickly.
This can be attributed to the early gain of migratory
and invasive abilities of malignant cells during tumor
progression [6]. One important step prior to migration
and invasion is the loss of cell adhesion. Keratino-
cytes express two classical cadherins: E-cadherin and
P-cadherin [7]. It is well known that loss of E-cadher-
in expression is one important step in the develop-
ment of OSCC [8]. Reduction of E-cadherin
correlates with reduced differentiation, and is fre-
quently observed in undifferentiated OSCC cells [9].
In our previous work, we have found a soluble
secreted 50 kDa form of P-cadherin (Pcad50) that
plays a role in the progression of malignant mela-
noma [10,11]. We found that truncated P-cadherin is
strongly involved in migration and invasion of malig-
nant melanoma and can be considered as a diagnostic
marker [11,12].
It has been shown in the literature that truncated
cadherins positively or negatively influence tumor pro-
gression. Soluble E-cadherin has been shown to disrupt
cell–cell adhesion in cultured epithelial cells [13].
Transfection of E-cadherin cDNA into invasive carci-
noma cells leads to a significant reduction of their
invasive capability in vitro [14,15], and activation of
E-cadherin expression results in growth inhibition of
tumor cell lines [16]. Also, T-cadherin (cadherin-
13 ⁄ H-cadherin), a special form of truncated cadherin
anchored in the cell membrane with a glycosyl phos-
phatidylinositol moiety, is involved in tumor growth
[17,18]. Moreover, truncated VE-cadherin has been
shown to induce breast cancer cell apoptosis and
growth inhibition [19].
In this study, we investigated whether soluble trun-
cated P-cadherin produced in OSCC has any influence
on cellular behavior. P-cadherin is known to be
expressed in keratinocytes. However, its role in the
progression of OSSC is still elusive.
Results
It is now known that several variants of cadherin play
a role in the progression of various types of cancer
[20]. Recent studies revealed that P-cadherin is
expressed in keratinocytes and human OSCC, but most
studies were based on immunohistochemical studies.
Recently, Pcad50 was shown to play a role in the
progression of malignant melanoma [10,11]. In this
study, we concentrated on the expression of P-cadherin
variants, especially Pcad50, in OSCC of the head and
neck region.
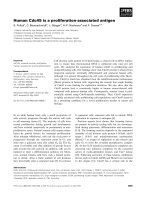
Aberrantly expressed P-cadherin in vivo
An aberrantly expressed P-cadherin was detected
in vivo when P-cadherin expression from normal oral
mucosa was compared with that from OSCC by
immunohistochemical staining. Figure 1A shows that
P-cadherin is specifically located in the membrane of
the basal cell layer in normal oral mucosa. In con-
trast, OSCC exhibits strong overall staining in the
cytoplasmic and extracellular regions of malignant
cells, whereas there is an increasing loss of P-cadherin
in the cell membrane with progression of OSCC
(Fig. 1B, arrows). Furthermore, cell lysates gained
from brush biopsies of patients with OSCC were
P-cadherin staining in normal oral mucosa
(magnification 1 : 100)
P-cadherin staining in OSCC
(ma
g
nification 1 : 100)
A
B
Fig. 1. Comparison of P-cadherin expression in tissue of normal
oral mucosa and tissue with OSCC. (A) In normal oral mucosa,
P-cadherin expression is mainly restricted to the membrane of
basal keratinocytes. (B) Tissue with OSCC shows aberrant
architecture and overall strong staining of P-cadherin.
R. Bauer et al. Truncated P-cadherin in oral squamous cell carcinoma
FEBS Journal 275 (2008) 4198–4210 ª 2008 The Authors Journal compilation ª 2008 FEBS 4199
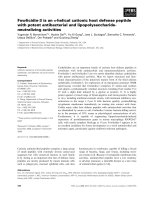
analyzed by western blot. In patients suffering from
OSCC, among other fragments, Pcad50 was revealed
(Fig. 2).
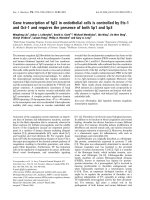
Influence of cellular differentiation on the
truncation of P-cadherin
To examine P-cadherin expression in OSCC cell lines,
western blot analysis was performed from cell lysates
of five OSCC cell lines, normal human keratinocytes
(NHEKs), and human oral keratinocytes (HOKs).
Figure 3A shows the expression of full length P-cadh-
erin (molecular mass 120 kDa) in cell lysates of all
controls and three OSCC cell lines (PCI 13, PCI 68,
and PCI 1). Additionally, several truncated versions of
P-cadherin, including Pcad50, were detected in all
OSCC cell lines. Figure 3B shows that Pcad50 was
secreted, as the supernatants of PCI 13 and PCI 68
produced an abundant amount of Pcad50 as compared
to the control NHEKs. Up to now, Pcad50 has only
been detected in malignant melanoma [10]. In RT-
PCR analysis, the correct lengths of exon-spanning
coding sequences of P-cadherin exons 2–3, 5–8, 8–10,
10–11, 11–12 and 15–16 could be detected in all OSCC
cell lines (exemplified by PCI 13 in Fig. 3C), meaning
that mRNA splicing can be ruled out as a potential
mechanism behind the production of Pcad50 in OSCC.
Interestingly, Pcad50 showed up in the cell lysates and
in the supernatants of HOKs (Fig. 3A,B). Because
HOKs were cultured from embryos, we assumed that
Pcad50 could originate from undifferentiated cells. To
OSCC patient 27
OSCC patient 26
OSCC patient 32
OSCC patient 21
OSCC patient 38
Melanoma cell line MelIm
50 kDa
Beta actin
Fig. 2. Western blot analysis of brush biopsies from five OSCC
patients. All patients showed a truncated version of P-cadherin.
Interestingly, patient 38, showing a strong Pcad50 band, suffered
from a recurrent OSCC.
HOK
PCI 13
PCI 68
PCI 4
PCI 52
PCI 1
NHEK
HOK
NHEK
PCI 68
PCI 13
120 kDa
A
C
B
50 kDa
120 kDa
50 kDa
Beta akt
M123456
Fig. 3. Truncated P-cadherin in cell lysates and supernatants of OSCC cell lines. (A) Western blot analysis of five OSCC cell lines (PCI 13,
PCI 68, PCI 4, PCI 52, PCI 1). NHEKs and HOKs are control cell lines. The expression of several truncated versions of P-cadherin is shown,
including the 50 kDa form, in all OSCC cell lines. Interestingly, HOKs also reveal a truncated form of P-cadherin. (B) Western blot analysis of
supernatants from OSCC cell lines PCI 13 and PCI 68 shows abundant Pcad50 as compared to the control NHEKs. Supernatants from HOKs
also show secreted Pcad50. (C) RT-PCR of exon-spanning coding sequences, exemplified here by the OSCC cell line PCI 13. This experi-
ment shows that the mRNA of OSCC cell lines and patients comprises the coding sequences of all 16 exons of P-cadherin, implying that
proteolytic activity rather than alternative splicing is responsible for the truncation of P-cadherin. M, marker; 1, coding sequence exon 2 ⁄ 3; 2,
coding sequence exon 5 ⁄ 8; 3, coding sequence exon 8 ⁄ 10; 4, coding sequence exon 10 ⁄ 11; 5, coding sequence exon 11 ⁄ 12; 6, coding
sequence exon 15 ⁄ 16.
Truncated P-cadherin in oral squamous cell carcinoma R. Bauer et al.
4200 FEBS Journal 275 (2008) 4198–4210 ª 2008 The Authors Journal compilation ª 2008 FEBS
confirm this notion, we analyzed the expression level
of cytokeratin (CK) markers usually described for
undifferentiated ⁄ proliferating and differentiated ⁄ differ-
entiating cells.
Figure 4A shows the expression of CK markers for
both differentiated cells and undifferentiated cells in
four out of six examined cell lines (HOKs, PCI 13,
PCI 68, and PCI 1), meaning that these cell lines con-
sist of cell populations still capable of differentiating.
In two cell lines (PCI 4 and PCI 52), only markers for
undifferentiated or proliferating cells could be
detected; these cell lines can obviously not differentiate
at all. Interestingly, the latter largely generated Pcad50
(Fig. 3). To further corroborate this result, P-cadherin
immunodetection was performed by western blot anal-
ysis with cell lysates from sparsely grown and 100%
confluent cells. Additionally, terminal differentiation
was induced by raising the Ca
2+
concentration in the
media from 0.07 mm to 1.5 mm for 48 h [according to
the manufacturer’s instructions (ScienCell, Carlsbad,
CA, USA)] [21]. Figure 4A shows an increase in
Pcad50 in cell lysates from sparsely grown cell culture
as compared to confluent cell culture or terminally dif-
ferentiated cells, respectively. In cells still expressing
full-length P-cadherin and capable of differentiation,
Pcad50 disappeared when the cells were grown to
100% confluence; in contrast, the cell line PCI 52,
although grown to 100% confluence, still produced
Pcad50.
Functional influence of Pcad50 on OSCC cells
To investigate the functional influence of Pcad50 on
OSCC cells, we generated a biotinylated version of
Pcad50 (Pcad50biot) by cell-free recombinant expres-
sion via rapid transcription and translation system
(RTS) (Fig. 5A). Biotinylation was used to enable
detection of the protein. Subsequently, we treated the
cells with the recombinant protein and analyzed their
behavior in terms of migration, cell aggregation, and
proliferation. To demonstrate that the recombina nt
fragment has biological activity, i.e. is able to directly
interact with full-length P-cadherin, an immunoprecipi-
tation experiment was performed using the cell lysates
from OSCC cell lines PCI 13 and PCI 52. Figure 5B
shows direct interaction with full-length P-cadherin
from the OSCC cell line PCI 13, whereas there is no
detectable 120 kDa band for full-length-deficient
PCI 52.
The wound healing assay in Fig. 6A demonstrates
that OSCC cells expressing full-length P-cadherin
(PCI 13) migrate 20–50% faster under the influence of
Pcad50biot at dilutions of 1 : 100 and 1 : 1000 as com-
pared to the control without Pcad50biot. However,
Pcad50biot did not show any effect on OSCC cells that
exhibited low or no expression of full-length P-cadher-
in (PCI 52), meaning that Pcad50 could interfere with
normal homophilic cell–cell adhesion, disrupt cellular
integrity, and thus lead to a more migratory phenotype
(Fig. 6B). To corroborate the results of the positive
effect of truncated P-cadherin on the migration of
tumor cells, a Boyden chamber migration assay was
performed. Figure 6C shows a significant increase of
150–270% in the migration of two different squamous
cell carcinoma cell lines, PCI 13 and PCI 68 (both still
expressing full-length P-cadherin), when treated with
Pcad50. Figure 6C also shows a significant influence of
Pcad50 on normal cells (NHEKs). When they were
treated with Pcad50biot at dilutions of 1 : 1000 and
1 : 100, there was an increase in cell migration of 200–
235% as compared to control cells without Pcad50biot
treatment.
PCI 13
PCI 68
PCI 4
PCI 1
HOK
PCI 52
CK 5
CK 14
CK 19
Expression in
proliferating and poorly
differentiated cells
A
B
CK 10
Involucrin
Expression in
differentiating and
differentiated cells
Beta actin
120 kDa
1.5 mM CaCl
2
Sparse growth
Confluent
Sparse growth
Confluent
Sparse growth
Confluent
50 kDa
HOK PCI 13 PCI 52
Fig. 4. Influence of cellular differentiation on the truncation of
P-cadherin. (A) RT-PCR analysis of CK markers for proliferat-
ing ⁄ undifferentiated cells (CK5, CK14, CK19) and differentiating and
terminally differentiated cells, respectively (CK10, involucrin). OSCC
cell lines PCI 13, PCI 68 and PCI 1 showed expression of all mark-
ers. The cell lines PCI 4 and PCI 52 mainly showed CK markers for
undifferentiated cells. (B) Comparison of P-cadherin expression of
confluent and nonconfluent cells. HOKs and PCI 13 containing the
full-length version of P-cadherin did not show Pcad50 when grown
to 90–100% confluence. HOKs that could be terminally differenti-
ated by raising the Ca
2+
concentration to 1.5 mM for 48 h also
stopped generating Pcad50. The cell line PCI 52, which does not
express full-length P-cadherin, constitutively generates Pcad50
regardless of confluency.
R. Bauer et al. Truncated P-cadherin in oral squamous cell carcinoma
FEBS Journal 275 (2008) 4198–4210 ª 2008 The Authors Journal compilation ª 2008 FEBS 4201
When taken into 3D cell culture, OSCC cells typi-
cally form tight spheroids within 2 days. To investigate
whether Pcad50biot exerted any influence on the for-
mation and compaction of spheroids, cells were treated
with the truncated protein in different dilutions and
pelleted in concave 96-well plates. Figure 7A shows a
significant increase in cell diameter in treated 3D cell
pellets as compared to untreated cell pellets, meaning
that Pcad50biot managed to diminish cell compaction
in 3D cell culture. Figure 7B shows electron micro-
scope images of a PCI 13 pellet treated with Pcad50-
biot and an untreated control. The overall appearance
of the Pcad50biot-treated cell line shows wider intercel-
lular gaps with disrupted adhesion complexes as com-
pared to the untreated control cell line without
treatment, supporting the notion that truncated
P-cadherin is able to weaken cell–cell contacts by com-
peting with the homophilic interaction of full-length
cadherin. To confirm that the increase in diameter was
not due to Pcad50biot-induced cell proliferation, we
performed 2D and 3D cell proliferation assays [based
on 3-(4,5-dimethylthiazol-2-yl)-5-(3-carboxymethoxyphe-
nyl)-2-(4-sulfophenyl)-2H-tetrazolium and picogreen
measurement, respectively]. Figure 8 shows that there
is no influence of Pcad50biot on cell proliferation in
2D (Fig. 8A) or 3D (Fig. 8B) cell culture. Moreover,
to proof that cell adhesion can be abrogated by trun-
cated P-cadherin, 2 · 10
5
OSCC cells were incubated
with Pcad50biot, and flow cytometric analysis was per-
formed over a period of 4 h (Fig. 9A). Statistical anal-
ysis of 2 · 10
4
cells revealed only a 3.4% increase in
cell aggregation with a dilution of 1 : 100 Pcad50biot.
In contrast, there was a 10.7% increase in cell aggrega-
tion with a dilution of 1 : 1000 Pcad50biot and a 12%
increase in cell aggregation in the untreated control. In
summary, relating the data to the untreated control,
the experiment revealed 11–72% diminished cell aggre-
gation after 4 h in probes treated with dilutions of
1 : 1000 and 1 : 100 Pcad50biot.
Discussion
In this study, we investigated the expression of P-cadh-
erin in OSCC cell lines and cells from patients suffer-
ing from OSCC. We detected truncated P-cadherin in
samples of brush biopsies. One patient (patient 38)
showed abundant expression of Pcad50. Interestingly,
this patient suffered from a recurrent OSCC, meaning
that Pcad50 could serve as potential marker for this
disease. Among other fragments, Pcad50 was found in
dedifferentiating OSCC cells. We recently found
Pcad50 in malignant melanoma [10]. We recombinant-
ly expressed Pcad50 and found that it had a significant
functional influence on cell aggregation and migration
of OSCC cell lines. Here we found full-length
(120 kDa) P-cadherin and Pcad50 in OSCC cell lines
and their lysates. Recently, it has been shown that
truncated variants of cadherins natively generated by
mutations, splicing or shedding, respectively, are
important determinants in developmental remodeling
and differentiation events; furthermore, has become
apparent that truncation of proteins can be important
factors during the progression of diseases [22–27].
Pcad50 was found abundantly in the supernatants of
the cell lines. In recent studies, we have also shown
PCI 52
PCI 13
RTS P-Cad biot.
1 : 50
RTS P-Cad biot.
1 : 50
RTS P-Cad biot.
1 : 100
RTS P-Cad biot.
1 : 100
RTS P-Cad biot.
control
120 kDa
A
B
120 kDa
IP PCI 13
IP PCI 52
50 kDa
50 kDa
Streptavidin-HRP 1 : 3000 Anti-P-cadherin N-terminal
1 : 10000
Fig. 5. Western blot analysis of Pcad50biot and interaction of
Pcad50biot with native full-length P-cadherin. (A) The protein was
produced by means of the RTS system (Roche) and detected by
streptavidin–HRP and an antibody against an N-terminal part of the
P-cadherin N-terminus. Control cell lines: PCI 52 and PCI 13. (B) To
prove that Pcad50biot was able to influence full-length P-cadherin-
mediated cell–cell adhesion, a coimmunoprecipitation experiment
was performed. It can be seen that Pcad50biot interacts with
P-cadherin in cell lysates containing the full-length form (PCI 13), in
contrast to PCI 52, which does not express full-length P-cadherin.
Truncated P-cadherin in oral squamous cell carcinoma R. Bauer et al.
4202 FEBS Journal 275 (2008) 4198–4210 ª 2008 The Authors Journal compilation ª 2008 FEBS
that Pcad50 plays a role in the progression of malig-
nant melanoma [10,11].
Interestingly, together with the full-length protein,
Pcad50 was also expressed and secreted in HOKs, in
contrast to NHEKs. Closer examination revealed that
the primary cell line HOK is derived from embryonic
cells (ScienCell, personal communication). This result
indicates that Pcad50 might play a role in undifferenti-
ated cell populations and is utilized to maintain a
dynamic epithelial architecture for tissue remodeling
during development. In malignantly transformed cells,
however, dedifferentiation is closely linked to tumor
progression [28]. The observation of a loss of full-
length P-cadherin and an increase in Pcad50 during
the dedifferentiation process of OSCC cell lines sug-
gests a link between P-cadherin expression and cellular
differentiation. To corroborate this hypothesis, the
OSCC cell lines were characterized by analyzing the
expression of CKs by RT-PCR, thus determining
the state of differentiation or dedifferentiation. For
this purpose, CK5, CK14 and CK19 were used as
markers for proliferating or poorly differentiated cells
[29–32]. CK10 and involucrin were used as markers
for differentiating and terminally differentiated cells
[32,33]. According to the cytokeratin expression data,
most of the OSCC cell lines comprised cell populations
of both differentiating and dedifferentiated cells. Our
results show that cells capable of terminal differentia-
tion initiated either by confluency or increasing Ca
2+
concentration express full length P-cadherin. In con-
trast, the cell lines not capable of progressing to a ter-
minal differentiation state (i.e. PCI 52) hardly express
any full length P-cadherin. As described in the litera-
ture, cadherins are involved in differentiation. Wertz
et al. reported cdh-16 to be responsible for the differ-
entiation of kidney, lung and sex duct epithelia [34].
Moreover, E-cadherin expression inversely correlates
with tumor dedifferentiation in OSCC [35]. Our results
suggest that the full-length version of P-cadherin is
also involved in the regulation of differentiation in
OSCC cells. The suggestion that P-cadherin is engaged
in this event is undermined by the knockout phenotype
of P-cadherin-deficient mice. Loss of P-cadherin in
myoepithelial cells of knockout mice leads to preco-
cious alveolar differentiation of their mammary glands.
Furthermore, histological examination of the tissue
revealed focal hyperplasia and ductal dysplasia in the
mutant mice [36,37]. The cell line PCI 52 is not able to
differentiate by means of confluency, and contains only
dedifferentiated cell populations with a highly
expressed marker, CK19, for poor differentiation [31].
PCI 52 does not express full-length P-cadherin and
constitutively generates Pcad50 under conditions of
B
80
100
ns
ns
40
60
Migration (percent)
0
20
Control
Pcad50 biot 1 : 100
Pcad50 biot 1 : 1000
80
100
A
*** *
40
60
Migration (percent)
0
20
Control
Pcad50 biot 1 : 100
Pcad50 biot 1 : 1000
C
300
**
**
100
200
*
*
Control
0
Migration (percent)
PCI 13
Pcad biot 1 : 100
Pcad50 biot 1 : 1000
Control
Pcad biot 1 : 100
Pcad50 biot 1 : 1000
Control
Pcad biot 1 : 100
Pcad50 biot 1 : 1000
PCI 68
NHEK
Fig. 6. Influence of Pcad50biot on cell migration. (A) Wound heal-
ing assay of OSCC cell line PCI 13 treated with Pcad50biot. OSCC
cells containing full-length P-cadherin (i.e. PCI 13) migrate signifi-
cantly faster (25–40%) when treated with different dilutions of
Pcad50biot. (B) Different dilutions of P-cad50biot did not have any
effect (5–10%) on OSCC cells without full-length P-cadherin
(PCI 52). The migration of cells was measured over a period of
24 h. One hundred per cent represents full closure of the wound.
(C) Boyden chamber migration assay. A significant influence can be
seen of 1 : 100 and 1 : 1000 dilutions of Pcad50biot on the migra-
tory behavior of OSCC cell lines PCI 13 and PCI 68 and NHEKs.
R. Bauer et al. Truncated P-cadherin in oral squamous cell carcinoma
FEBS Journal 275 (2008) 4198–4210 ª 2008 The Authors Journal compilation ª 2008 FEBS 4203
both sparse growth and confluent growth. This corrob-
orates the result that without full- length P-cadherin,
the cells are not able to differentiate.
To investigate the functional influence of Pcad50 on
OSCC cell lines, cells were treated with Pcad50biot. We
found an interaction between Pcad50biot and full-length
P-cadherin. Both wound healing assays and Boyden
chamber assays revealed that recombinant Pcad50biot
significantly enhanced cell migration in OSCC cell lines
that contained full-length P-cadherin (i.e. PCI 13 and
PCI 68), and was even able to trigger migration in
NHEKs. However, Pcad50biot did not exert any influ-
ence on the migration of the full-length-deficient cell line
PCI 52, meaning that Pcad50 might competitively inter-
act with the adhesion complexes of full-length P-cadher-
in and thus facilitate migration. It has been shown by
Chappuis-Flament et al. [38] that homophilic interac-
tions of cadherins are mediated not only by EC1, but
also by multiple extracellular repeats; although our
recombinant Pcad50biot is N-terminally biotinylated, it
might be capable of interacting laterally with EC2 and
EC3, and may even disturb the homodimerization of
cadherins, abrogating cell–cell contacts. The fact that
Pcad50 needs full-length P-cadherin to exert an effect
shows that Pcad50 might play an important role in cell
migration, especially at the early stages of OSCC tumor
progression, when full-length P-cadherin is still
expressed on the cell surface and Pcad50 is being
150
A
B
*
**
50
100
Control
0
Aggregate diameter (percent)
Pcad50 biot 1 : 100
Pcad50 biot 1 : 1000
Untreated control of OSCC cell line PCI 13
OSCC cell line PCI 13 treated with 1 : 100 PcadAvi biot
Fig. 7. Influence of Pcad50biot on cell
aggregation. (A) Cell aggregation assay of
OSCC cell line PCI 13. The influence of dif-
ferent dilutions of Pcad50biot on the OSCC
cell line PCI 13 in a cell aggregation assay
after 2 days is shown. 3D cell cultures were
established and treated with Pcad50biot at
dilutions of 1 : 100 and 1 : 1000, respec-
tively. The control was an untreated 3D cell
culture. Under the influence of Pcad50biot,
the cells were not able to form tight aggre-
gates. (B) Electron microscopic images of
the OSCC cell line PCI 13. 3D cell pellets
treated with Pcad50biot shows large areas
with disrupted cell contacts, in contrast to
the untreated control, which showed tight
cellular contacts (black arrows).
Truncated P-cadherin in oral squamous cell carcinoma R. Bauer et al.
4204 FEBS Journal 275 (2008) 4198–4210 ª 2008 The Authors Journal compilation ª 2008 FEBS
secreted from cells. There is evidence that soluble and
truncated forms of E-cadherin play an important role in
the development of cancer. Increased soluble E-cadherin
has been shown to contribute to melanoma progression
[39]. Furthermore, an impact on cell adhesion and
migration of truncated E-cadherin has been shown by
Maretzky et al., who reported that ADAM-10-regulated
shedding of this protein is associated with epithelial
cell–cell adhesion, migration and b-catenin translocation
in fibroblasts and keratinocytes [40]. Proteolytic
cleavage of E-cadherin has also been reported in pros-
tate and mammary epithelial cells [41]. In the context of
OSCC, aberrant cells might be able to produce proteases
capable of processing full-length P-cadherin intracellu-
larly, leading to a truncated 50 kDa form that is secreted
and thus might be able to trigger the abrogation of
intact tissue architecture. In contrast to malignant mela-
noma in OSCC, a spliced mRNA variant can be ruled
out as potential mechanism for the production of trun-
cated P-cadherin, as our RT-PCR experiments revealed
exon-spanning coding sequences for all relevant exons
in the cell lines. Pcad50 is also expressed and secreted in
normal undifferentiated oral embryonic keratinocytes.
As a conclusion, the generation of Pcad50 during
embryonic development could be a controlled event that
leads to a more migratory phenotype capable of accom-
modating epithelial growth until the cells are in contact
which each other or start to differentiate. However, as a
consequence of cellular dedifferentiation at the onset of
OSCC progression, Pcad50 could be generated and
facilitate disaggregation and cell migration. This
hypothesis is also supported by our cell aggregation
assays and electron microscopic images of Pcad50biot-
treated cell lines showing that Pcad50biot was able to
attenuate the formation of tight aggregates by causing
disruption of cell–cell adhesion. Taken together, our
results confirm the hypothesis that during dedifferentia-
tion of aberrant cells, Pcad50 might competitively inter-
fere with the interaction of membrane-bound full-length
P-cadherin of adjacent cells, weakening tissue architec-
ture and thus facilitating migration in OSCC. How the
interference takes place is still elusive. Further investiga-
tions are needed to determine whether trans-intraction
or cis-interaction takes place to abrogate cell–cell
contacts.
In summary, our results suggest a role for Pcad50 in
the progression of OSCC in vitro and in vivo, facilitating
migration and weakening cellular aggregation; thus,
Pcad50 could be considered as a diagnostic marker.
Experimental procedures
Protein analysis in vitro (western blotting)
Prior to lysis, cells were scraped off with a cell scraper. No
trypsinization was carried out. For protein isolation,
2 · 10
6
cells were washed with 1· NaCl ⁄ P
i
, lysed in 200 lL
of RIPA buffer (Roche Applied Science, Mannheim,
Germany), and incubated for 15 min at 4 °C. RIPA buffer
with a cocktail of protease inhibitors was used. Insoluble
material was removed by centrifugation at 15 000 g for
10 min, and the cell lysate was immediately shock frozen
and stored at )80 °C. Furthermore, cell culture supernatant
150
A
B
50
100
0
Cell proliferation (percen)
150
200
100
0
50
Amount of DNA (percent)
Control
Pcad50 biot 1 : 50
Pcad50 biot 1 : 100
Pcad50 biot 1 : 1000
Control
Pcad50 biot 1 : 50
Pcad50 biot 1 : 100
Pcad50 biot 1 : 1000
Fig. 8. To investigate the influence of Pcad50biot on cell prolifera-
tion, a proliferation assay was performed. Pcad50biot did not have
any effect on OSCC cell proliferation. (A) 2D proliferation assay. (B)
Picogreen DNA measurement in 3D cell pellets.
R. Bauer et al. Truncated P-cadherin in oral squamous cell carcinoma
FEBS Journal 275 (2008) 4198–4210 ª 2008 The Authors Journal compilation ª 2008 FEBS 4205
was analyzed by western blotting. Here, 2 mL of cell
culture supernatant was concentrated to 150 lL with a
SpeedVac. The protein concentration was determined using
the bicinchoninic acid protein assay reagent (Pierce, Rock-
ford, IL, USA). Balanced amounts of cell proteins (40 lg)
were denatured at 70 ° C for 10 min after addition of Roti-
load-buffer (Roth, Karlsruhe, Germany), and subsequently
separated on NuPAGE-SDS gels (Invitrogen, Karlsruhe,
Germany). After transfer of the proteins onto poly(vinyli-
dene difluoride) membranes (Bio-Rad, Munich, Germany),
the membranes were blocked in 3% BSA ⁄ NaCl/P
i
with
Tween (150 mm NaCl, 100 mm Tris, 0.1% Tween-20) for
1.5 h and incubated with a 1 : 10 000 dilution of primary
monoclonal mouse antibody to P-cadherin (P-cadherin
N-terminal; BD Transduction Laboratory, Heidelberg,
Germany) or b -actin (1 : 5000; Sigma, Hamburg, Germany)
overnight at 4 °C. A 1 : 3000 dilution of antibody to mouse
horseradish peroxidase (HRP) (Pierce) was used as a sec-
ondary antibody. Staining was performed using ECL Sub-
strate (Pierce). All of the experiments were repeated at least
three times, with similar results.
Cell lines and culture conditions
PCI 13-1: this cell line was established from a male patient
who suffered from low-grade OSCC of the retromolar
triangle. PCI 1-1: the origin of this cell line was a larynx
carcinoma of the glottis; it was harvested from a male
patient. PCI 52: this tumor originated from the aryepiglot-
tic fold of a male patient; it was a primary carcinoma.
PCI 68: this cell line was established from a primary tongue
carcinoma of a male patient. PCI 4: this cell line was estab-
lished from male patient with a primary carcinoma at the
root of the tongue.
NHEKs
The adult NHEK cell line was obtained from PromoCell
GmbH (Heidelberg, Germany). The cell line was estab-
lished using adult keratinocytes. Cell culturing was carried
out according to the manufacturer’s instructions.
HOKs
This cell line was obtained from Sciencell (San Diego, CA,
USA) and was delivered by PromoCell GmbH. The cell line
is of fetal origin. Cell culturing was carried out according
to the manufacturer’s instructions.
Expression of Pcad50biot
A prokaryotic expression vector with the sequence for
Pcad50 and a 15 amino acid Avi-tag peptide sequence was
constructed by overlap extension PCR. Primers were used
with the following sequences: forward primer 5¢-GCTAC
CAT ATG GAG GGT TTA AAC GAT ATT TTC GAG
GCT CAG AAA ATC GAA TGG CAC GAA GAT TGG
GTG GTT GCT CCA-3¢, comprising an NdeI restriction
t0
A
B
4h2h
Increase in
cell aggregation
Cell aggregation
kDa
Control
12.97% 18.86% 25.03%
12.06%
100%
120
Pcad50biot 1 : 100
15.2% 17.48% 18.57%
3.37%
27.9%
13.16% 16.64% 23.9%
Pcad50biot 1 : 1000
10.74%
89%
Fig. 9. (A) Flow cytometric analysis of cell aggregation of the OSCC cell line PCI 13 under the influence of truncated P-cadherin. Cells were
incubated with Pcad50biot for 4 h and analyzed every hour. The image depicts cellular aggregates in the upper right corner of the images
after 2 h and 4 h. Cells treated with a 1 : 100 dilution of Pcad50biot showed up to 72% less cell aggregation than the control without treat-
ment. Statistics were performed in relation to living cells; dead cells were gated out after staining with propidium iodide. (B) Western blot
analysis of P-cadherin expression in NHEKs singularized by Accutase (PAA Laboratories GmbH) for 10 min at room temperature. It can be
seen that Accutase did not have any effect on P-cadherin.
Truncated P-cadherin in oral squamous cell carcinoma R. Bauer et al.
4206 FEBS Journal 275 (2008) 4198–4210 ª 2008 The Authors Journal compilation ª 2008 FEBS
site and the coding sequence for an Avi-tag; and reverse
primer 5¢-GAC GGA TCC TCA GTA GAC ACA CAC
AGG CTC-3¢, with a BamHI restriction site. The coding
sequence contained the immunogenic N-terminal region for
the monoclonal P-cadherin antibody (BD Transduction
Laboratories) and did not contain the P-cadherin trans-
membrane domain and the C-terminal intracellular domain.
The length of the construct was calculated such that the
resulting peptide had a molecular mass of 50 kDa without
the signal peptide sequence. The Pcad50biot cDNA con-
struct was cloned into the vector pIVEX2.3-MCS (Roche
Applied Science, Mannheim, Germany). The expression
vector was used in the rapid translation system, a cell-free
Escherichia coli-based protein transcription ⁄ translation sys-
tem (Roche Applied Science). By addition of biotin, ATP,
and the E. coli biotin protein ligase BirA during the proce-
dure, the protein was biotinylated at the introduced Avi-tag
at the N-terminus. The correct function and folding of the
protein was tested by performing functional assays.
Coimmunoprecipitation with Pcad50biot
For coimmunoprecipitation, 150 lg cell lysates dissolved in
binding buffer (20 mm NaPO
4
, 150 mm NaCl, pH 7.5) were
precleared with 25 lL of protein streptavidin-coupled
Sepharose (GE Healthcare, Munich, Germany) at 4 °C
overnight. After centrifugation at 250 g, the supernatant
was transferred into a fresh vial and incubated with
Pcad50biot with shaking at 4 °C overnight. Fifty microliters
of protein streptavidin-coupled Sepharose was added for
1 h, pelleted, washed three times with binding buffer, resus-
pended in 20 lL of Laemmli buffer, heated at 95 °C for
5 min, and subjected to western blot analysis on 10%
SDS ⁄ PAGE gels. Detection was performed as described
above. The first antibody was monoclonal antibody to
P-cadherin (BD Transduction Laboratories).
RNA isolation and RT-PCR
Expression of mRNA was detected by RT-PCR. Total
RNA from the tumor cell lines examined was extracted
using RNeasy Mini Kits (Qiagen, Hilden, Germany)
according to the manufacturer’s instructions. The isolated
RNA was stored at )20 ° C until reverse transcription.
First-strand cDNA was synthesized from 2 lg of total
RNA using dN6 random primers (Roche Pharma AG,
Munich, Germany) and reverse transcription with Super-
script II (Invitrogen). cDNA was incubated with 1 lLof
RNaseA (Roche Pharma AG) for 60 min at 37 °C. The
cDNA was stored at )20 °C until RT-PCR analysis.
RNA integrity was tested by RT-PCR of the housekeep-
ing gene b-actin. Specific RT-PCR detection of P-cadher-
in, CK5, CK14, CK19, CK10, involucrin and b-actin was
performed with the primers listed in Table 1. The primers
were obtained from TibMolBiol (Berlin, Germany). The
ideal annealing temperature of primers was defined by a
gradient RT-PCR (52–72 °C in 12 steps). The following
program was used for primers: initial denaturation at
94 °C for 5 min, 33 cycles of amplification with denatur-
ation at 94 °C for 1 min, primer annealing for 1 min and
elongation at 72 °C for 1 min, and a final elongation at
72 °C for 10 min. The synthesized RT-PCR products
were separated by electrophoresis in an agarose gel,
stained with ethidium bromide, and visualized with UV
light.
Acquisition and analysis of flow cytometry data
Flow cytometry was performed using a FACSCanto flow
cytometer (BD Biosciences, Franklin Lakes, NJ, USA)
equipped with 488 nm blue and 633 nm red diode lasers.
Data analysis was carried out using facsdiva software
and winmdi 2.9. OSCC cells were dissociated with Accu-
tase (PAA Laboratories GmbH, Co
¨
lbe, Germany) and
washed in NaCl ⁄ P
i
. As analyzed by western blotting, Ac-
cutase did not exert any effect on P-cadherin in normal
epidermal keratinocytes (Fig. 9B). Cells (2 · 10
5
) were
seeded in FACS vials (BD Falcon, Heidelberg, Germany)
and gently resuspended in DMEM. Single cells were gen-
erated, and 2 · 10
4
cells were treated with dilutions of
1 : 100 and 1 : 1000 Pcad50biot and analyzed directly
(T
0
) and after 1, 2, 3 and 4 h. Immediately prior to the
analysis, cells were incubated with fresh propidium
iodide. For calculating statistics, only living cells were
used, gating propidium iodide-negative cells. As a mea-
sure of cell aggregation, forward scatter was used on the
y-axis. Quadrant markers were used to distinguish single
from aggregated cells.
Immunohistochemistry
Paraffin-embedded preparations of normal mucosa and
OSCC were stained for P-cadherin protein expression
with the Envision ⁄ HRP system (DAKO, Carpinteria, CA,
USA). The tissues were deparaffinated, rehydrated, and
subsequently incubated with primary monoclonal P-cadh-
erin antibody (1 : 100; BD Transduction Laboratories)
overnight at 4 °C. The secondary antibody attached to a
dextran backbone carrying the HRP was incubated for
30 min at room temperature. Antibody binding was visu-
alized using dextran ⁄ HRP solution. Finally, the tissues
were counterstained with hematoxylin.
Brush biopsies
Lesions from patients suffering from OSCC were scraped
with a brush (Cytobrush Plus GT non-sterile; Medscand
Medical AB, Malmo
¨
, Sweden), applying pressure and
rotation. The cells harvested were transferred to a tube
containing NaCl ⁄ P
i
and pulse-vortexed. The brush was
R. Bauer et al. Truncated P-cadherin in oral squamous cell carcinoma
FEBS Journal 275 (2008) 4198–4210 ª 2008 The Authors Journal compilation ª 2008 FEBS 4207
removed, and the cells were centrifuged for 5 min at
1500 g. Cells were lysed in 50 lL of RIPA buffer (Roche
Pharma AG), and the protein concentration was measured
with the bicinchoninic acid assay.
Wound healing assay (scratch assay)
Cells were cultured to confluence (> 90%) in six-well dishes.
On the bottom of each dish, a horizontal line was drawn with
a marker. Perpendicular to this line, two separate wounds
were scratched with a sterile 1 mL pipette tip. The cells were
rinsed with NaCl ⁄ P
i
, which was replaced by DMEM contain-
ing 10% fetal bovine serum and dilutions of recombinant
Pcad50biot, depending on the experimental procedure. Using
phase contrast microscopy with ·10 magnification, images
were taken at time 0 (T
0
) and after 12 h and 24 h, and the
gaps were measured. After each measurement, the old
medium was replaced with fresh medium. All experiments
were repeated three times. Statistical analysis was carried out
by one-way ANOVA and Dunnett’s test.
Migration assay (Boyden chamber)
The migration assays were performed using Boyden cham-
bers containing polycarbonate filters coated with gelatine,
as previously described [42]. The lower compartment was
filled with fibroblast-conditioned medium, used as a chemo-
attractant. OSCC cells were harvested by trypsinization for
5 min, resuspended in DMEM without fetal bovine serum
at a density of 30 000 cellsÆmL
)1
with dilutions of recombi-
nant Pcad50 according to the experimental procedure, and
placed in the upper compartment of the chamber. After
incubation at 37 °C for 4 h, the filters were collected, and
the cells adhering to the lower surface were fixed, stained,
and counted. Experiments were repeated thee times, with
similar results.
Electron microscopy
OSCC cells (1 · 10
4
) were seeded in a 96-well plate coated
with 1% agarose. A 3D culture was made by centrifuging
the plates at 50 g for 1 min and incubating the cells for
2 days at 37 °C in a 5% CO
2
atmosphere. Electron micros-
copy was performed by the Central Laboratory for Elec-
tron Microscopy, at the institute of Pathology, University
of Regensburg, Germany, essentially as described previ-
ously [43].
Cell aggregation assay
After dissociation of the cells with Accutase (PAA
Laboratories GmbH) and one washing step, 8000 OSCC -
cells ⁄ well were seeded in a 96-well culture plate in a volume
of 200 lL. Cells were treated with different dilutions, 1 : 10
to 1 : 10 000, of the recombinant protein Pcad50biot. Plates
were centrifuged at 50 g for 1 min. After day 1, day 2 and
day 3, images were taken, and the area of the aggregates
was measured under a light microscope at ·4 magnification.
Cell aggregation for flow cytometry experiments was per-
formed.
Cell proliferation assays
Double-stranded DNA measurement was performed with
a PicoGreen dsDNA assay kit (Invitrogen) according to
the manufacturer’s instructions. Cell proliferation mea-
surement was performed with a CellTiter 96 AQueous
One Solution cell proliferation assay (Promega, Madison,
WI, USA).
Acknowledgements
This work was supported by Deutsche Forschungs-
gemeinschaft (DFG, Grant BA 3696 ⁄ 1-1).
References
1 Lutz BS (2002) Aesthetic and functional advantages of
the anterolateral thigh flap in reconstruction of tumor-
related scalp defects. Microsurgery 22, 258–264.
Table 1. Primers for P-cadherin, differentiated and undifferentiated
cell lines. For better legibility some letters are lower case.
Primer name Sequence (5¢-to3¢)
Annealing
temperature
(°C)
Forward primer
Ck10 GGATGAGCTGACCCTGACCAA 60
Involucrin TGTTCCTCCTCCAGTCAATACCC 58
Ck5 TTCTTTGATGCGGAGCTGTCCCAGA 60
Ck19 AGGTGGATTCCGCTCCGGGCA 61
p-cad2–3 TCAgggAggCTgAAgTgAC 59
p-cad5–8 GAGAGATTGGGTGGTTGCTC 60
p-cad8–10 CCAGGCCACAGACATGGAT 59
p-cad10–11 TCCAAAgTCgTTgAggTC 60
p-cad11–12 AgCAgTTTgTgAggAACAAC 60
p-cad15–16 TGACATCACCCAGCTCCA 59
Reverse primer
Ck10 GCAGCATTCATTTCCACATTCAC 60
Involucrin ATTCCTCATGCTGTTCCCAGTGC 58
Ck5 GCCATGTCCTGCTTGGCCTTCTGCA 60
Ck19 ATCTTCCTGTCCCTCGAGCA 61
p-cad2–3 gCCATTCCgCACAgTgAAg 59
p-cad5–8 GCCTGGATGGTCAGTGTGTA 60
p-cad8–10 AGGTTGGGAGCTTCAGCA 59
p-cad10–11 AgATgTTgTTCCTCACAAAC 60
p-cad11–12 AggTCCTTgTCCgTgATg 60
p-cad15–16 CCCACTCGTTCAGATAATCG 59
Truncated P-cadherin in oral squamous cell carcinoma R. Bauer et al.
4208 FEBS Journal 275 (2008) 4198–4210 ª 2008 The Authors Journal compilation ª 2008 FEBS
2 Bray F, Sankila R, Ferlay J & Parkin DM (2002) Esti-
mates of cancer incidence and mortality in Europe in
1995. Eur J Cancer 38, 99–166.
3 Gumbiner BM (2005) Regulation of cadherin-mediated
adhesion in morphogenesis. Nat Rev Mol Cell Biol 6,
622–634.
4 Hirano S, Nose A, Hatta K, Kawakami A & Takeichi M
(1987) Calcium-dependent cell–cell adhesion molecules
(cadherins): subclass specificities and possible involve-
ment of actin bundles. J Cell Biol 105, 2501–2510.
5 Wheelock MJ & Johnson KR (2003) Cadherin-mediated
cellular signaling. Curr Opin Cell Biol 15, 509–514.
6 Baatenburg de Jong RJ, Hermans J, Molenaar J, Bri-
aire JJ & le Cessie S (2001) Prediction of survival in
patients with head and neck cancer. Head Neck 23,
718–724.
7 Takeichi M (1995) Morphogenetic roles of classic cad-
herins. Curr Opin Cell Biol 7, 619–627.
8 Sakaki T, Wato M, Tamura I, Nakajima M, Morita S,
Kakudo K, Shirasu R, Tanaka A & Sakaki T (1999)
Correlation of E-cadherin and alpha-catenin expression
with differentiation of oral squamous cell carcinoma.
J Osaka Dent Univ 33, 75–81.
9 Mattijssen V, Peters HM, Schalkwijk L, Manni JJ,
van’t Hof-Grootenboer B, de Mulder PH & Ruiter DJ
(1993) E-cadherin expression in head and neck squa-
mous-cell carcinoma is associated with clinical outcome.
Int J Cancer 55, 580–585.
10 Bauer R, Hein R & Bosserhoff AK (2005) A secreted
form of P-cadherin is expressed in malignant melanoma.
Exp Cell Res 305, 418–426.
11 Bauer R & Bosserhoff AK (2006) Functional implica-
tion of truncated P-cadherin expression in malignant
melanoma. Exp Mol Pathol 81, 224–230.
12 Bauer R, Wild PJ, Meyer S, Bataille F, Pauer A,
Klinkhammer-Schalke M, Hofstaedter F & Bosserhoff
AK (2006) Prognostic relevance of P-cadherin expres-
sion in melanocytic skin tumours analysed by high-
throughput tissue microarrays. J Clin Pathol 59,
699–705.
13 Ranscht B & Dours-Zimmermann MT (1991) T-cadher-
in, a novel cadherin cell adhesion molecule in the ner-
vous system lacks the conserved cytoplasmic region.
Neuron 7, 391–402.
14 Frixen UH, Behrens J, Sachs M, Eberle G, Voss B,
Warda A, Lochner D & Birchmeier W (1991) E-cadher-
in-mediated cell–cell adhesion prevents invasiveness of
human carcinoma cells. J Cell Biol 113, 173–185.
15 Vleminckx K, Vakaet L Jr, Mareel M, Fiers W & van
Roy F (1991) Genetic manipulation of E-cadherin
expression by epithelial tumor cells reveals an invasion
suppressor role. Cell 66, 107–119.
16 Watabe M, Nagafuchi A, Tsukita S & Takeichi M
(1994) Induction of polarized cell–cell association and
retardation of growth by activation of the E-cadherin–
catenin adhesion system in a dispersed carcinoma line.
J Cell Biol 127, 247–256.
17 Hebbard LW, Garlatti M, Young LJ, Cardiff RD,
Oshima RG & Ranscht B (2008) T-cadherin supports
angiogenesis and adiponectin association with the vas-
culature in a mouse mammary tumor model. Cancer
Res 68, 1407–1416.
18 Lee SW (1996) H-cadherin, a novel cadherin with
growth inhibitory functions and diminished expression
in human breast cancer. Nat Med 2 , 776–782.
19 Shi XY, Lu H, Li WL, Tang HL, Xiong JJ, Zhang JQ,
Opolon P, Legrand C, Perricaudet M & Li H (2006) A
soluble truncated cadherin induces breast cancer cell
apoptosis and growth inhibition. J Cancer Res Clin
Oncol 132, 561–571.
20 Masterson J & O’Dea S (2007) Posttranslational trunca-
tion of E-cadherin and significance for tumour progres-
sion. Cells Tissues Organs 185, 175–179.
21 Darmstadt GL, Fleckman P, Jonas M, Chi E & Rubens
CE (1998) Differentiation of cultured keratinocytes pro-
motes the adherence of Streptococcus pyogenes. J Clin
Invest 101, 128–136.
22 Wada T, Wakabayashi Y, Takahashi S, Ushiki T,
Kikkawa Y, Yonekawa H & Kominami R (2001) A
point mutation in a cadherin gene, Cdh23, causes deaf-
ness in a novel mutant, Waltzer mouse niigata. Biochem
Biophys Res Commun 283, 113–117.
23 Kawaguchi J, Takeshita S, Kashima T, Imai T, Machi-
nami R & Kudo A (1999) Expression and function of
the splice variant of the human cadherin-11 gene in sub-
ordination to intact cadherin-11. J Bone Miner Res 14,
764–775.
24 Dussaulx-Garin L, Blayau M, Pagenault M, Le Berre-
Heresbach N, Raoul JL, Campion JP, David V & Breta-
gne JF (2001) A new mutation of E-cadherin gene in
familial gastric linitis plastica cancer with extra-digestive
dissemination. Eur J Gastroenterol Hepatol 13, 711–715.
25 Tschan MP, Fischer KM, Fung VS, Pirnia F, Borner
MM, Fey MF, Tobler A & Torbett BE (2003) Alterna-
tive splicing of the human cyclin D-binding Myb-like
protein (hDMP1) yields a truncated protein isoform
that alters macrophage differentiation patterns. J Biol
Chem 278, 42750–42760.
26 Davies ML, Roberts GT, Spiller DG & Wakeman JA
(2004) Density-dependent location and interactions of
truncated APC and beta-catenin. Oncogene 23, 1412–
1419.
27 Fei Q, Boden SD, Sangadala S, Viggeswarapu M, Liu
Y & Titus L (2007) Truncated human LMP-1 triggers
differentiation of C2C12 cells to an osteoblastic pheno-
type in vitro. Acta Biochim Biophys Sin (Shanghai) 39,
693–700.
28 Fusenig NE, Breitkreutz D, Boukamp P, Tomakidi P &
Stark HJ (1995) Differentiation and tumor progression.
Recent Results Cancer Res 139, 1–19.
R. Bauer et al. Truncated P-cadherin in oral squamous cell carcinoma
FEBS Journal 275 (2008) 4198–4210 ª 2008 The Authors Journal compilation ª 2008 FEBS 4209
29 Fillies T, Werkmeister R, Packeisen J, Brandt B, Morin
P, Weingart D, Joos U & Buerger H (2006) Cytokeratin
8 ⁄ 18 expression indicates a poor prognosis in squamous
cell carcinomas of the oral cavity. BMC Cancer 13,
6–10.
30 Hsieh CB, Chen CJ, Yu JC, Chang TM, Gao HW &
Liu YC (2005) Primary squamous cell carcinoma of the
liver arising from a complex liver cyst: report of a case.
Surg Today 35, 328–331.
31 Ram Prassad VV, Nirmala NR & Kotian MS (2005)
Immunohistochemical evaluation of expression of cyto-
keratin 19 in different histological grades of leukoplakia
and oral squamous cell carcinoma. Indian J Dent Res
16, 6–11.
32 Gosselin F, Magloire H, Joffre A & Portier MM (1990)
Cytokeratins as molecular markers in the evaluation of
the precise differentiation stage of human gingival epi-
thelium reconstituted in vitro. Arch Oral Biol 35(Suppl),
217S–221S.
33 Kannan S, Balaram P, Chandran GJ, Pillai MR,
Mathew B, Nalinakumari KR & Nair MK (1994) Alter-
ations in expression of terminal differentiation markers
of keratinocytes during oral carcinogenesis. Pathobiol-
ogy 62, 127–133.
34 Wertz K & Herrmann BG (1999) Kidney-specific
cadherin (cdh16) is expressed in embryonic kidney,
lung, and sex ducts. Mech Dev 84 , 185–188.
35 Frixen UH & Nagamine Y (1993) Stimulation of uroki-
nase-type plasminogen activator expression by blockage
of E-cadherin-dependent cell–cell adhesion. Cancer Res
53, 3618–3623.
36 Radice GL, Ferreira-Cornwell MC, Robinson SD, Ray-
burn H, Chodosh LA, Takeichi M & Hynes RO (1997)
Precocious mammary gland development in P-cadherin-
deficient mice. J Cell Biol 139, 1025–1032.
37 Cardiff RD & Muller WJ (1993) Transgenic mouse
models of mammary tumorigenesis. Cancer Surv 16, 97–
113.
38 Chappuis-Flament S, Wong E, Hicks LD, Kay CM &
Gumbiner BM (2001) Multiple cadherin extracellular
repeats mediate homophilic binding and adhesion.
J Cell Biol 154, 231–243.
39 Billion K, Ibrahim H, Mauch C & Niessen CM (2006)
Increased soluble E-cadherin in melanoma patients.
Skin Pharmacol Physiol 19, 65–70.
40 Maretzky T, Reiss K, Ludwig A, Buchholz J, Scholz F,
Proksch E, de Strooper B, Hartmann D & Saftig P
(2005) ADAM10 mediates E-cadherin shedding and reg-
ulates epithelial cell–cell adhesion, migration, and beta-
catenin translocation. Proc Natl Acad Sci USA 102,
9182–9187.
41 Rios-Doria J, Day KC, Kuefer R, Rashid MG, Chin-
naiyan AM, Rubin MA & Day ML (2003) The role of
calpain in the proteolytic cleavage of E-cadherin in
prostate and mammary epithelial cells. J Biol Chem
278, 1372–1379.
42 Kawano Y, Yoshimura T & Kaibuchi K (2002)
Involvement of small GTPase Rho in cardiovascular
diseases. Nippon Yakurigaku Zasshi 120, 149–158.
43 Kunz-Schughart LA, Schroeder JA, Wondrak M, van
Rey F, Lehle K, Hofstaedter F & Wheatley DN (2006)
Potential of fibroblasts to regulate the formation of
three-dimensional vessel-like structures from endothelial
cells in vitro. Am J Physiol Cell Physiol 290, C1385–
C1398.
Truncated P-cadherin in oral squamous cell carcinoma R. Bauer et al.
4210 FEBS Journal 275 (2008) 4198–4210 ª 2008 The Authors Journal compilation ª 2008 FEBS