Báo cáo khoa học: Cyclosporin A-induced oxidative stress is not the consequence of an increase in mitochondrial membrane potential doc
Bạn đang xem bản rút gọn của tài liệu. Xem và tải ngay bản đầy đủ của tài liệu tại đây (714.8 KB, 10 trang )
Cyclosporin A-induced oxidative stress is not the
consequence of an increase in mitochondrial membrane
potential
Marco van der Toorn
1
, Henk F. Kauffman
2
, Margaretha van der Deen
3
, Dirk-Jan Slebos
1
,
Gerard H. Koe
¨
ter
1
, Rijk O. B. Gans
1
and Stephan J. L. Bakker
1
1 Department of Internal Medicine, University Medical Center Groningen, University of Groningen, the Netherlands
2 Groningen University Institute for Drug Exploration, University Medical Center Groningen, University of Groningen, the Netherlands
3 Department of Medical Oncology, University Medical Center Groningen, University of Groningen, the Netherlands
Keywords
cyclosporin A; mitochondria; mitochondrial
membrane potential; mitochondrial
permeability transition; reactive oxygen
species
Correspondence
S. J. L. Bakker, Department of Internal
Medicine, University Medical Center
Groningen, PO Box 30001, 9700 RB
Groningen, the Netherlands
Fax: +31 503 619069
Tel: +31 503 613677
E-mail:
(Received 7 December 2006, revised 6 April
2007, accepted 11 April 2007)
doi:10.1111/j.1742-4658.2007.05827.x
Cyclosporin A induces closure of the mitochondrial permeability transition
pore. We aimed to investigate whether this closure results in concomitant
increases in mitochondrial membrane potential (DW
m
) and the produc-
tion of reactive oxygen species. Fluorescent probes were used to assess
DW
m
(JC-1, 5,5¢,6,6¢-tetrachloro-1,1¢,3,3¢-tetraethyl-benzimidazolyl-carbo-
cyanine iodide), reactive oxygen species [DCF, 5- (and 6)-chloromethyl-
2¢,7¢-dichlorodihydrofluorescein diacetate, acetyl ester] and [Ca
2+
] [Fluo-3,
glycine N-[4-[6-[(acetyloxy)methoxy]-2,7-dichloro-3-oxo-3H-xanthen-9-yl]-
2-[2-[2-[bis[2-[(acetyl oxy)methoxy]-2-oxyethyl]amino]-5-methy lphenoxy]eth-
oxy]phenyl]-N-[2-[(acetyloxy)methoxy]-2-oxyethyl]-(acetyloxy)methyl ester]
in human kidney cells (HK-2 cells) and in a line of human small cell
carcinoma cells (GLC4 cells), because these do not express cyclospo-
rin A-sensitive P-glycoprotein. We used transfected GLC4 cells expressing
P-glycoprotein as control for GLC4 cells. NIM811 (N-methyl-4-isoleucine-
cyclosporin) and PSC833 (SDZ-PSC833) were applied as selective
mitochondrial permeability transition pore and P-glycoprotein blockers,
respectively. To study the effect of cyclosporin A on mitochondrial func-
tion, we isolated mitochondria from fresh pig livers. Cyclosporin A and
PSC833 induced a more than two-fold increase in JC-1 fluorescence in
HK-2 cells, whereas NIM811 had no effect. None of the three substances
induced a significant increase in JC-1 fluorescence in GLC4 cells. Despite
this, cyclosporin A, NIM811 and PSC833 induced a 1.5-fold increase in
DCF fluorescence (P<0.05) and a two-fold increase in Fluo-3 fluores-
cence (P<0.05). Studies in isolated mitochondria showed that blockage
of mitochondrial permeability transition pores by cyclosporin A affected
neither DW
m
, ATP synthesis, nor respiration rate. The mitochondrial per-
meability transition pore blockers cyclosporin A and NIM811, but also the
non-mitochondrial permeability transition pore blocker PSC833, induced
comparable degrees of reactive oxygen species production and cytosolic
[Ca
2+
]. Neither mitochondria, effects on P-glycoprotein nor inhibition of
Abbreviations
CsA, cyclosporin A; DCF, 5- (and 6)-chloromethyl-2¢,7¢-dichlorodihydrofluorescein diacetate, acetyl ester; DNP, 2,4-dinitrophenol; DW
m
,
mitochondrial membrane potential; Fluo-3, glycine N-[4-[6-[(acetyloxy)methoxy]-2,7-dichloro-3-oxo-3H-xanthen-9-yl]-2-[2-[2-[bis[2-
[(acetyloxy)methoxy]-2-oxyethyl]amino]-5-methylphenoxy]ethoxy]phenyl]-N-[2-[(acetyloxy)methoxy]-2-oxyethyl]-(acetyloxy)methyl ester; GLC4,
human small cell carcinoma; HK-2, human kidney; JC-1, 5,5¢,6,6¢-tetrachloro-1,1¢,3,3¢-tetraethyl-benzimidazolyl-carbocyanine iodide; MPTP,
mitochondrial permeability transition pore; NIM811, N-methyl-4-isoleucine-cyclosporin; PSC833, SDZ-PSC833; ROS, reactive oxygen species.
FEBS Journal 274 (2007) 3003–3012 ª 2007 The Authors Journal compilation ª 2007 FEBS 3003
Immunosuppressive treatment with cyclosporin A
(CsA) is accompanied by accelerated atherosclerosis
and fibrosis, which contribute to the development of
chronic transplant dysfunction [1]. It has been sugges-
ted that reactive oxygen species (ROS) play an import-
ant underlying role [2–4]. Different studies have shown
that CsA is able to increase levels of superoxide anion
(O
2
Æ–
), hydrogen peroxide, malondialdehyde, and thio-
barbituric acid reactive substances [5,6]. Mitochondrial
enzymes with antioxidative properties, including super-
oxide dismutase, catalase, and glutathione peroxidase,
become upregulated upon exposure to CsA [7]. It is
evident that CsA induces oxidative stress, but its origin
remains speculative.
Mitochondria represent a major source of intracellu-
lar ROS, and play a crucial role in cellular Ca
2+
homeostasis, which affects various cell signaling path-
ways [8]. The primary function of mitochondria is pro-
duction of ATP, a process linked to the action of the
electron transfer chain. Normally, electrons supplied
by metabolic fuel (NADH and FADH
2
) are trans-
ferred along the electron transfer chain to oxygen.
Optimally, the terminal enzyme of the electron transfer
chain, cytochrome c oxidase, binds oxygen until it has
accepted four electrons, when it is released as water.
Most of the energy released during the transfer of
these electrons is used to pump protons from the mito-
chondrial matrix towards the inner membrane space,
thereby creating a proton gradient. The energy stored
in the proton gradient is used to drive the process of
oxidative phosphorylation of ADP to ATP. When the
intramitochondrial ADP concentration drops (e.g.
under conditions of low energy demand), the proton
gradient will rise as a consequence of decreased con-
sumption [9–12]. This increased proton gradient
impairs the flow of electrons along the electron trans-
fer chain, which results in accumulation of electrons
along the electron transfer chain [13]. This results
in an increased likelihood of leakage of electrons
from the chain, with increased ROS production as a
consequence [14].
One mechanism by which the mitochondrial mem-
brane potential (DW
m
) can decrease is through opening
of the mitochondrial permeability transition pore
(MPTP) [15–17]. CsA is well known as an inhibitor of
calcineurin and P-glycoprotein, but it is also a strong
inhibitor of the MPTP [18,19]. Indeed, it has been sug-
gested that in several cell types CsA prevents opening
of the MPTP, thereby leading to an increased DW
m
[17,20]. The CsA analog N-methyl-4-isoleucine-cyclos-
porin (NIM811) is also known as an inhibitor of
MPTP, and to lead to an increase in DW
m
[21]. Fluor-
escent probes used to assess DW
m
are pumped out of
cells by P-glycoprotein [22]. Thus, probe accumulation
caused by CsA may result from effects on P-glycopro-
tein as well as effects on MPTP. The CsA analog
SDZ-PSC833 (PSC833) may serve as a useful control
substance in this context, because it is an inhibitor of
P-glycoprotein rather than MPTP, and is devoid of
calcineurin-inhibiting properties [23].
We hypothesized that an increase in steady-state
DW
m
underlies increased ROS production in associ-
ation with CsA exposure. We set out to investigate the
effects of CsA on DW
m
in relation to the production of
ROS, with NIM811 and PSC833 as controls.
Results
Closure of the MPTP and DW
m
Human kidney (HK-2) cells are known to express
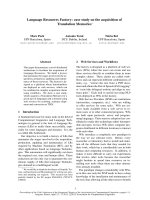
P-glycoprotein [24,25]. Both CsA and PSC833 induced
a dose-dependent increase in 5,5¢,6,6¢-tetrachloro-1,
1¢,3,3¢-tetraethyl-benzimidazolyl-carbocyanine i odide
(JC-1) fluorescence in these cells (Fig. 1). NIM811,
calcineurin therefore play a role in cyclosporin A-induced oxidative stress
and disturbed Ca
2+
homeostasis.
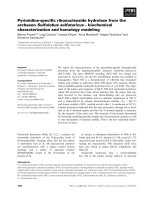
Fig. 1. Effect of CsA and its analogs on mitochondrial membrane
potential in HK-2 cells. JC-1 probe (5 lgÆmL
)1
) was used to study
mitochondrial membrane potential. Data are expressed as mean
value ± SEM, and refer to three experiments. *P < 0.05 versus
control, **P < 0.01 versus control, ***P < 0.001 versus control by
Newman–Keuls multiple comparison test.
Cyclosporin A-induced oxidative stress M. van der Toorn et al.
3004 FEBS Journal 274 (2007) 3003–3012 ª 2007 The Authors Journal compilation ª 2007 FEBS
however, did not induce a significant increase in JC-1
fluorescence.
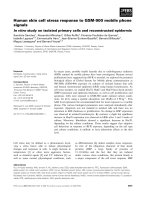
We subsequently investigated whether, and to what
extent, P-glycoprotein expression affects intracellular
accumulation of three different fluorescent probes.
Expression of P-glycoprotein resulted in significant
decreases in fluorescence intensity as compared to non-
P-glycoprotein-expressing cells [effect of P-glycoprotein
presence: JC-1, P < 0.0001; 5- (and 6)-chloromethyl-
2¢,7¢-dichlorodihydrofluorescein diacetate, acetyl ester
(DCF), P < 0.05; glycine N-[4-[6-[(acetyloxy)methoxy]-
2,7-dichloro-3-oxo-3H-xanthen-9-yl]-2-[2-[2-[bis[2-[(ace-
tyloxy)methoxy]-2-oxyethyl]amino]-5-methylphenoxy]
ethoxy]phenyl]-N-[2-[(acetyloxy)methoxy]- 2-oxyethyl]-
(acetyloxy)methyl ester (Fluo-3), P < 0.0001 by two-
way ANOVA] (Fig. 2).
We used human small cell carcinoma (GLC4) cells
and GLC4⁄ P-glycoprotein cells to investigate the
effects of CsA and its analogs on DW
m
. There were no
significant increases in JC-1 fluorescence in response to
either CsA or its analogs in GLC4 cells. Inhibition of
P-glycoprotein by CsA and its analogs, including
NIM811, resulted in significant increases in JC-1 fluor-
escence as compared to GLC4 ⁄ P-glycoprotein control
cells untreated with CsA and its analogs (Fig. 3A).
We also used GLC4 cells to investigate CsA and its
analogs in the absence of disturbing effects mediated
by inhibition of P-glycoprotein pumps. Analyses with
DCF as probe for assessment of ROS production
showed, for all three analogs, a significant, more than
1.5-fold, increase in fluorescence (Fig. 3B). Treatment
with the antioxidant vitamin E blunted these increases
in DCF fluorescence. The Fluo-3 measurements pre-
sented in Fig. 3C suggest increases in cytosolic [Ca
2+
]
in response to CsA and its analogs. Both the intra-
cellular Ca
2+
chelator BAPTA and the extracellular
Ca
2+
chelator EGTA caused significant attenua-
tion of the effects of CsA and its analogs on Fluo-3
fluorescence.
Effects of CsA and its analogs on mitochondrial
function
We concluded that experiments in isolated mitochon-
dria were necessary to discern whether mitochondria
could be a source of increased ROS production,
because we observed ROS production with CsA and
both of its analogs even in GLC4 cells that were devoid
of P-glycoprotein. To perform these experiments, we
used mitochondria that were isolated from fresh
liver obtained from pigs. We first confirmed that CsA
and NIM811 actually inhibit the MPTP, using the
mitochondrial swelling assay. As shown in Fig. 4, iso-
lated mitochondria undergo large-amplitude swelling
that is dependent on Ca
2+
, which is a classical inducer
of MPTP opening. Pretreatment of mitochondria with
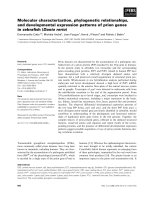
Fig. 2. Probe accumulation in GLC4 cells without expression of
P-glycoprotein (GLC4) and GLC4 cells with expression of P-glyco-
protein (GLC4 ⁄ P-gp). After loading of cells with probes and subse-
quent washing, they were kept in culture medium for 1 h, and then
measured by flow cytometry. (A) Dose–response curve of JC-1
(mitochondrial membrane potential). (B) Dose–response curve of
DCF (intracellular levels of ROS). (C) Dose–response curve of Fluo-3
(intracellular levels of Ca
2+
). The data presented are from at least
three independent experiments, and represent the mean value ±
SEM. If no error bar appears, it is hidden by the marker for the
mean value.
M. van der Toorn et al. Cyclosporin A-induced oxidative stress
FEBS Journal 274 (2007) 3003–3012 ª 2007 The Authors Journal compilation ª 2007 FEBS 3005
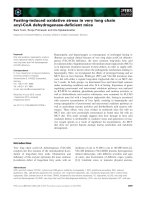
CsA (1 and 10 lm) and NIM811 (10 lm) significantly
reduced mitochondrial swelling, whereas CsA (0.1 lm)
and PSC833 (10 lm) did not.
Isolated mitochondria
To further examine whether closure of the MPTP
results in an increase in DW
m
, isolated mitochondria
were loaded with JC-1. After addition of succinate and
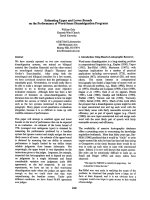
ADP, state III respiration was reached. Figure 5A
shows that CsA did not result in an increase in JC-1
fluorescence. In response to induction of state IV res-
piration, however, JC-1 fluorescence increased by
13.5 ± 2.8%. The protonophore 2,4-dinitrophenol
(DNP), which dissipates DW
m
, resulted in a significant
(50.7 ± 12.9%, P < 0.001) decrease.
Mitochondrial ATP levels were monitored during
state III respiration. CsA did not result in an increase
in ATP production (Fig. 5A). State IV respiration and
DNP were used as negative controls. State IV respir-
ation could not result in ATP production, because
there was no supply of ADP. Addition of DNP, an
established uncoupler of oxidative phosphorylation,
resulted in a decrease in ATP to 28.9 ± 4.5%
(P < 0.01) as compared to state III.
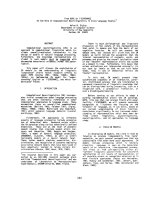
Fig. 4. Effects of different concentrations of CsA and its analogs
on the Ca
2+
-dependent induction of opening of the MPTP. The data
are representative of four experiments. A concentration of 1 m
M
Ca
2+
was used to induce opening of the MPTP. CsA (1 and 10 lM)
and NIM811 (10 l
M) caused significant inhibition of mitochondrial
swelling. **P < 0.01 versus control; ns, not significant by two-way
ANOVA.
A
B
C
Fig. 3. Effects of CsA (10 lM), NIM811 (10 lM) and PSC833
(10 l
M) in GLC4 cells without expression of P-glycoprotein (GLC4)
and GLC4 cells expressing P-glycoprotein (GLC4 ⁄ P-gp). (A) JC-1
(5 lgÆmL
)1
) was used to assess mitochondrial membrane potential.
(B) DCF (5 lgÆmL
)1
) was used to detect the generation of ROS. (C)
Fluo-3 (50 ngÆmL
)1
) was used to determine Ca
2+
levels. The data
presented are from four independent experiments, and represent
the mean value ± SEM. (A)
##
P < 0.01 versus GLC4; **P < 0.01
versus control. (B) **P < 0.01 versus control;
#
P < 0.05 versus
vitamin E (200 l
M) treatment. (C) ***P < 0.001 versus control;
$$P < 0.01 versus BAPTA (10 l
M) or EGTA (0.1 mM). P-values are
according to the Newman–Keuls multiple comparison test.
Cyclosporin A-induced oxidative stress M. van der Toorn et al.
3006 FEBS Journal 274 (2007) 3003–3012 ª 2007 The Authors Journal compilation ª 2007 FEBS
Oxygen consumption was monitored with sequential
addition of succinate, ADP (to induce state III respir-
ation) and CsA, until state IV respiration was reached
again, when all ADP was converted to ATP. DNP
was then added, followed by KCN (Fig. 5B). Isolated
mitochondria were incubated in an oxygraph sample
chamber with air-saturated respiration buffer in these
experiments. After addition of succinate as metabolic
substrate, mitochondria start to respire (4.8 ± 0.5
nmol O
2
Æmin
)1
Æmg
)1
). Addition of ADP causes a burst
of oxygen uptake (15.4 ± 1.8 nmol O
2
Æmin
)1
Æmg
)1
).
The respiratory control index was 3.2 ± 0.3. Addition
of CsA during state III respiration did not cause a sig-
nificant change in oxygen consumption as compared to
state III control. DNP was used as positive control.
Uncoupling of the mitochondria caused a burst of oxy-
gen uptake (17.8 ± 4.0 nmol O
2
Æmin
)1
Æmg
)1
). KCN,
a blocker of complex IV, was used as negative con-
trol. Addition of KCN acutely blocked respiration
of the uncoupled mitochondria (2.2 ± 6.8 nmol O
2
Æ
min
)1
Æmg
)1
).
Finally, we examined whether CsA exposure induces
changes in ROS production during state III respiration
in the presence and absence of 1 mm Ca
2+
. Mitoch-
ondrial ROS production was monitored with DCF in
these experiments. Figure 5C shows that addition of
Ca
2+
results in a significant increase in DCF fluores-
cence. Antimycin A, a blocker of complex III and a
well-known inducer of ROS production [26], was used
as positive control. Addition of CsA resulted in signifi-
cant attenuation of DCF fluorescence during state III
respiration, both in the absence and in the presence of
Ca
2+
, with no significant difference between the latter
two conditions.
Discussion
In this study, we found that CsA induces increases in
the production of ROS and in cytosolic [Ca
2+
]. In
contrast to expectations, we found that these increases
A
B
C
Fig. 5. Effects of 10 lM CsA in isolated liver mitochondria. (A) Mit-
ochondrial membrane potential (DW
m
) and ATP levels. (B) Respir-
ation rate. (C) ROS. Measurements for assessment of DW
m
, ATP
levels and ROS were performed under different conditions. Meas-
urements of oxygen consumption for assessment of respiration
rate represent four experiments in which isolated mitochondria
were subsequently exposed to different conditions, starting with
respiration medium with mitochondria alone (indicated as mitochon-
dria) and ending with addition of KCN (indicated as KCN). JC-1
(0.2 lgÆmL
)1
) probe was used to monitor mitochondrial membrane
potential. Mitochondrial ATP levels were quantified by using a
chemiluminescent ATP assay. Mitochondrial respiration rate was
measured using an oxygraph. DCF (1 lgÆmL
)1
) was used to quan-
tify ROS. Data are expressed as mean value ± SEM and are repre-
sentative of four experiments. (A) (mitochondrial DW
m
)
***P < 0.001 versus state III; ns, not significant. (A) (ATP levels)
##
P < 0.01 versus state III;
###
P < 0.001 versus state III; ns, not
significant. (B) ns, not significant; (C) **P < 0.01 versus state III;
##
P < 0.01 versus state III + Ca
2+
. P-values are according to the
Newman–Keuls multiple comparison test.
M. van der Toorn et al. Cyclosporin A-induced oxidative stress
FEBS Journal 274 (2007) 3003–3012 ª 2007 The Authors Journal compilation ª 2007 FEBS 3007
cannot be explained by blockage of the MPTP by
CsA. We also found that both the MPTP-blocking
CsA analog NIM811 and the P-glycoprotein-block-
ing CsA analog PSC833 induced comparable increases
in ROS and cytosolic [Ca
2+
] to those induced by CsA.
All three compounds induced a comparable degree in
ROS production in cells devoid of P-glycoprotein.
Unlike CsA, both NIM811 and PSC833 do not inhibit
calcineurin. Together, these results suggest that neither
mitochondria, inhibition of calcineurin nor blockage of
P-glycoprotein play a role in the comparable induction
of ROS production by CsA and its analogs.
We found that CsA induces a strong increase in JC-1
fluorescence in intact human kidney cells. Studies in
human neuroblastoma cells have found the same phe-
nomenon [20,27]. It was suggested by these authors that
this action of CsA derives from its inhibition of the
MPTP at the level of mitochondria. Our experiments
with PSC833, which we confirmed to be a potent inhi-
bitor of P-glycoprotein pumps, but not of the MPTP,
showed that it induced comparable increases in JC-1
fluorescence as CsA (Fig. 1). P-glycoprotein is located
at the plasma membrane, and is expressed in almost
every cell type, including human kidney and neurobla-
stoma cells [28–30]. This pump is able to excrete many
different fluorescent probes [22,31]. Our data imply that
the fluorescent probe JC-1 accumulates in cells as a con-
sequence of P-glycoprotein inhibition, resulting in an
apparent increase in DW
m
. We also subsequently tested
whether P-glycoprotein pumps are involved in the accu-
mulation of other fluorescent probes, because this might
disturb the interpretation of our data concerning these
probes. Parallel experiments with the fluorescent probes
JC-1, DCF and Fluo-3 in GLC4 cells with and without
expression of P-glycoprotein provided evidence that
probe accumulation and probe excretion were influ-
enced by the presence of these pumps (Fig. 2A–C). Cells
that did not express P-glycoprotein accumulated the
probes, resulting in a strong fluorescence signal. We can
conclude that P-glycoprotein expression gives rise to
false-positive results that do not correspond to the
increases in DW
m
, ROS production and [Ca
2+
] that the
investigated probes were intended to assess. This is a
major problem in the interpretation of studies, because
many pharmacologic agents can influence the efflux of
probes mediated by P-glycoprotein pumps [20,27,32].
In order to investigate the effect of MPTP blockage
by CsA in the absence of disturbance by probe efflux
effects due to P-glycoprotein pumps, we used GLC4
cells without these pumps. Our study is the first to
compare the effect of CsA on intracellular probe accu-
mulation between non-P-glycoprotein-containing cells
and the same cells transfected in such a way that they
express this protein. We demonstrated that in cells that
do not contain P-glycoprotein, neither CsA, NIM811
nor PSC833 was able to induce a significant increase
in JC-1 fluorescence (Fig. 3A). This was confirmed at
the level of isolated mitochondria (Fig. 5A). CsA
blockage of the temporary opening of the MPTP in
state III respiration did not result in an increase in
JC-1 fluorescence. If closure of the MPTP by CsA
altered the flow of electrons along the electron transfer
chain, mitochondrial ATP synthesis and respiration
rate would be expected to alter. Our results showed
that neither ATP synthesis nor mitochondrial respir-
ation rate was influenced by CsA, which is similar to
the observations by Sanchez et al. [33]. Strzelecki et al.
showed that CsA inhibited the process of spontaneous
Ca
2+
discharge in isolated mitochondria [34]. CsA
also inhibited the swelling and respiration induced by
accumulated Ca
2+
in these experiments. The authors
concluded that CsA at an immunosuppressive level
impairs Ca
2+
-induced membrane permeability. Our
findings show that Ca
2+
-induced increases in mito-
chondrial ROS production can be prevented by CsA,
thereby virtually excluding mitochondria as source of
increased ROS production in response to exposure of
cells to CsA. Elzinga et al. showed that Ca
2+
uptake
by mitochondria isolated from renal cortical cells of
rats that had been treated with CsA for 2 weeks was
significantly lower than Ca
2+
uptake by mitochondria
isolated from control rats [35]. It was not investigated
whether there was an increased concentration gradient
as a consequence of prior intramitochondrial Ca
2+
accumulation. If this was the case, it could be that
long-term treatment with CsA results in a net zero
effect on mitochondrial ROS production under steady-
state conditions in vivo.
We showed in experiments in isolated mitochondria
that the classic MPTP inducer Ca
2+
leads to mito-
chondrial swelling, and that this can be blocked by
CsA and NIM811, but not by PSC833. Our experi-
ments in whole cells suggested that both CsA, NIM811
and PSC833 induce an increase in cytosolic [Ca
2+
] and
production of ROS. The discrepancy in the effects of
PSC833 between GLC4 cells and isolated mitochondria
versus the consistency in the effects of CsA and
NIM811 in these experiments suggests that MPTP
blockage plays a role neither in the observed increases
in cytosolic [Ca
2+
] nor in increases in ROS produc-
tion. To further substantiate this suggestion, we per-
formed experiments in the presence and absence of
1mm Ca
2+
in isolated mitochondria. We found signi-
ficant stimulation of ROS production after addition of
Ca
2+
during state III respiration, whereas CsA resul-
ted in a significant attenuation of ROS production.
Cyclosporin A-induced oxidative stress M. van der Toorn et al.
3008 FEBS Journal 274 (2007) 3003–3012 ª 2007 The Authors Journal compilation ª 2007 FEBS
We observed the same degree of increased ROS pro-
duction in response to CsA and its analogs NIM811 and
PSC833. The increased production was not of mitoch-
ondrial origin. It is also unlikely that the calcineurin-
inhibiting properties of CsA play a role, because neither
NIM811 nor PSC833 inhibit calcineurin. It is further-
more also unlikely that the P-glycoprotein-inhibiting
properties of CsA play a role, because CsA, NIM811
and PSC833 all increased ROS production to the same
degree in cells that were devoid of P-glycoprotein. ROS-
forming candidates that may explain this side-effect
of CsA are NADPH oxidase, endoplasmic reticulum
cytochrome P450, and glycolate oxidase. Recently, a
study by Vetter et al. suggested that CsA activates
NADPH oxidase and generates release of O
2
.–
[36].
Other studies have found increased arachidonic acid
omega-hydroxylation activity by CsA. The omega-
hydroxylation of arachidonic acid is an activity associ-
ated with members of the cytochrome P450 family
[37,38].
In conclusion, our results showed induction of
increased ROS production and cytosolic [Ca
2+
]by
CsA and its analogs. However, mitochondria, involve-
ment of P-glycoprotein and inhibition of calcineurin
are unlikely to play a role in CsA-induced oxidative
stress and disturbed Ca
2+
homeostasis. Care must
be taken in the use of fluorescent probes in P-glycopro-
tein-expressing cells when substances with P-glycopro-
tein-blocking properties, such as CsA, are investigated,
because this may result in false-positive signals. More
detailed in vitro studies are required to further eluci-
date the mechanisms responsible for the CsA-induced
toxicity.
Experimental procedures
Chemicals
The cyclosporin analogs CsA, NIM811 and PSC833 were
kindly provided by Novartis (Basel, Switzerland). DNP was
obtained from Merck & Co., Inc. (Haarlem, the Nether-
lands), and sodium succinate, ATP, ADP, KCN and oligo-
mycin were obtained from Sigma-Aldrich Chemie B.V.
(Zwijndrecht, the Netherlands). Vincristine sulfate was pur-
chased from Abic Ltd (Netanya, Israel). JC-1, DCF and
Fluo-3 were purchased from Molecular probes Europe BV
(Leiden, the Netherlands).
Cell culture
Human-derived renal proximal tubular epithelial cells (HK-
2), obtained from the ATCC (Manassas, VA, USA) were
grown in keratinocyte serum-free medium (Gibco-BRL,
Breda, the Netherlands), supplemented with 5 ngÆmL
)1
epi-
dermal growth factor, 40 lgÆmL
)1
bovine pituitary extract
and 20 lgÆmL
)1
gentamicin (Centafarm Services, Etten-
Leur, the Netherlands). The human small cell lung cancer
(GLC4) cell line and GLC4 cell line transfected the human
multidrug resistance 1 gene were kindly provided by EGE
de Vries (Department of Medical Oncology, University
Medical Center Groningen, the Netherlands). The cells
were grown in RPMI-1640 with 25 mm Hepes and l-gluta-
mine (BioWitthaker, Verviers, Belgium), supplemented with
10% heat-inactivated fetal bovine serum (BioWitthaker)
and 20 lgÆmL
)1
gentamicin. The multidrug resistance
1-transfected GLC4 cell line expressing P-glycoprotein was
grown with a drug pressure of vincristine sulfate (50 nm)
until 1 week before the experiments. All cells were grown in
75 cm
2
plastic flasks (Costar, Cambridge, MA) at 37 °Cin
an atmosphere of 5% CO
2
.
Immunocytochemical staining of P-glycoprotein
Cytospins of GLC4 and GLC4 ⁄ P-glycoprotein cells were
incubated for 1 min with hematoxylin for staining of
nuclei. To assess the localization of P-glycoprotein expres-
sion in the membranes, stained cells were evaluated by
immunohistochemistry. Monoclonal antibody to P-glyco-
protein (C219) (Alexis, San Diego, CA) was used to
detect P-glycoprotein expression. An irrelevant antibody
was used as isotype control. GLC4 cells without expres-
sion of P-glycoprotein did not show P-glycoprotein stain-
ing. GLC4 cells expressing P-glycoprotein showed strong
and homogeneous membrane-bound staining of P-glyco-
protein.
Flow cytometry analyses
Cells at 90% confluence were washed with Hank’s buffered
saline solution (UMCG, Groningen, the Netherlands) and
cultured for 24 h in serum-free medium. After starvation,
the cells were resuspended in NaCl ⁄ P
i
, loaded with a fluor-
escent probe, and incubated for 20 min at room tempera-
ture in the dark. At the end of the incubation period, cells
were washed twice with NaCl ⁄ P
i
. The loaded cells were
incubated for 1 h with different concentration of CsA,
NIM811 and PSC833 in an incubator, and analyzed using
a FACSCalibur flow cytometer (Becton Dickinson Medical
Systems, Sharon, MA).
Isolation of mitochondria from pig liver
Mitochondria were isolated from fresh pig liver using a com-
mercial mitochondria isolation kit (Sigma-Aldrich Chemie
B.V.). Briefly, fresh liver tissue (obtained within 1 h of sacri-
fice) was washed twice with two volumes of extraction buf-
fer (10 mm Hepes, 200 mm mannitol, 70 mm sucrose and
M. van der Toorn et al. Cyclosporin A-induced oxidative stress
FEBS Journal 274 (2007) 3003–3012 ª 2007 The Authors Journal compilation ª 2007 FEBS 3009
1mm EGTA, pH 7.5). The liver was cut into small portions
and homogenized with 10 volumes of extraction buffer con-
taining 2 mgÆmL
)1
delipidated BSA (Sigma-Aldrich Chemie
B.V.), using a pestle and glass tube. The homogenate was
centrifuged at 600 g for 5 min using an Eppendorf centri-
fuge 5417R, rotor F45-30-11, Eppendorf AG, Hamburg,
Germany (all centrifugation carried out using same centri-
fuge and rotor types). The supernatant was collected and
centrifuged at 11 000 g for 10 min. The supernatant was
then removed, and the pellet was resuspended in 10 volumes
of extraction buffer and centrifuged at 600 g for 5 min.
Finally, the supernatant was centrifuged at 11 000 g for
10 min. The supernatant was removed, and the isolated
mitochondria were resuspended in respiratory buffer
(120 mm KCl, 5 mm K
2
PO
4
,3mm Hepes, 1 mm EGTA,
brought to pH 7.2 with 5 mm KH
2
PO
4
). Mitochondrial pro-
tein was estimated by the Bradford method (Bio-Rad
Laboratories, Veenendaal, the Netherlands) according to
the manufacturer’s instructions. To stabilize the mitochon-
dria, respiration buffer was supplemented with 0.2% delipi-
dated BSA (m ⁄ v).
Mitochondrial swelling assay
Mitochondria were resuspended in respiration buffer (with-
out EGTA) containing 4 mg mitochondrial proteinÆmL
)1
.
The mitochondria were energized with succinate (final con-
centration 5 mm). The suspension was pipetted into the
wells (100 lL per well) of a 96-well polystyrene microtiter
plate (Greiner Bio-One B.V., Alphen aan den Rijn, the
Netherlands). CsA and its analogs (0.1–10 lm) were added.
Five minutes after addition of the CsA and its analogs,
CaCl
2
(final concentration 1 mm) was added to each
well. Immediately after addition of CaCl
2
, the plate
was measured in an EL808 spectrophotometer using a
550 nm filter (Bio-Tek Instruments, Abcoude, the
Netherlands). Measurements were repeated every 30 s for a
period of 30 min. Measurements were performed at room
temperature.
DW
m
in isolated mitochondria
Isolated mitochondria were resuspended (final protein con-
centration 100 lgÆmL
)1
) in 1 mL of respiration buffer.
Mitochondria were stained with 0.2 lgÆmL
)1
JC-1 probe
for 10 min at 37 °C according to the manufacturer’s
instruction. State III respiration was reached after addition
of succinate (final concentration 5 mm) and ADP (final
concentration 1 mm). The loaded mitochondria were then
suspended in the wells of a 96-well fluorescent plate
(Costar) and exposed to 10 lm CsA for 15 min at 37 °C.
DNP (final concentration 20 lm) served as negative control.
DW
m
was measured with an excitation wavelength of
485 nm through a 590 nm bandpass filter in a FL500 fluor-
escent plate reader (Bio-Tek Instruments).
Luminescence monitoring of mitochondrial ATP
Mitochondria (final protein concentration 100 lgÆ mL
)1
)
were resuspended in respiration buffer. All experiments
were done in state III respiration. DNP (final concentration
20 lm) and state IV respiration served as negative controls.
Mitochondria were incubated for 15 min at 37 °C. At the
end of the incubation period, ATP synthesis was stopped
by freezing the samples in ) 196 °C nitrogen. Mitochondrial
ATP levels were measured using the Enliten ATP assay
(Promega, Leiden, the Netherlands) and a Berthold micro-
plate luminometer (Berthold Detection Systems GmbH,
Pforzheim, Germany).
Mitochondrial respirometry
Mitochondria (final concentration 2 mgÆmL
)1
) were resus-
pended in a 1 mL respiration chamber with air-saturated res-
piration buffer (209 lm O
2
). CsA (final concentration 10 lm)
was preincubated for 5 min. State III respiration was started
after addition of succinate (final concentration 5 mm) and
ADP (final concentration 0.5 mm). Mitochondrial respir-
ation was measured at 37 °C with a commercial Clark-type
oxygen electrode (U-53002-50; Cole-Parmer, Schiedam,
the Netherlands) covered with a high-sensitivity mem-
brane (Yellow Springs Instruments Co., Inc., Ohio, USA),
continuously registered with the Oxystat interface and
strathkelvin 928 oxygen system software (U-53002-05;
Cole-Parmer).
Mitochondrial ROS production
Mitochondrial ROS were measured using the procedure of
Garcia-Ruiz et al. [39].
Briefly, production of ROS was monitored using the
fluorescent probe DCF. Freshly isolated mitochondria
(100 lgÆmL
)1
) were incubated in respiratory buffer (without
EGTA) with 1 lm DCF in the absence or presence of
1mm Ca
2+
. The effects of CsA (10 lm) were tested under
conditions of state III respiration. Antimycin A was used
to stimulate maximal ROS production by inhibiting com-
plex III of the electron transfer chain. The mitochondrial
suspension was incubated for 15 min at 37 °C. DCF fluor-
escence was monitored with an excitation wavelength of
485 nm through a 530 nm bandpass filter in an FL500
fluorescent plate reader.
Statistical analysis
Data were analyzed using prism 4 for Windows (GraphPad
Software, Inc., San Diego, CA). Two-way ANOVA was
used for assessment of dose–response experiments (Figs 2
and 4). Comparisons between different experimental
groups were performed with the Newman–Keuls multiple
Cyclosporin A-induced oxidative stress M. van der Toorn et al.
3010 FEBS Journal 274 (2007) 3003–3012 ª 2007 The Authors Journal compilation ª 2007 FEBS
comparison test (Figs 1, 3 and 5). P < 0.05 was considered
significant. Results are presented as mean (± SEM) unless
otherwise mentioned.
Acknowledgements
We thank Inge de Vegt and Harold G. de Bruin for
their valuable technical support in carrying out experi-
mental studies, and the Dutch Kidney Foundation for
financial support (C01.1923).
References
1 Kopp JB & Klotman PE (1990) Cellular and molecular
mechanisms of cyclosporin nephrotoxicity. J Am Soc
Nephrol 1, 162–179.
2 Redondo-Horcajo M & Lamas S (2005) Oxidative and
nitrosative stress in kidney disease: a case for cyclospor-
ine A. J Nephrol 18, 453–457.
3 Hong F, Lee J, Song JW, Lee SJ, Ahn H, Cho JJ, Ha J
& Kim SS (2002) Cyclosporin A blocks muscle differen-
tiation by inducing oxidative stress and inhibiting the
peptidyl-prolyl-cis–trans isomerase activity of cyclophi-
lin A: cyclophilin A protects myoblasts from cyclosporin
A-induced cytotoxicity. FASEB J 16, 1633–1635.
4 Buetler TM, Cottet-Maire F, Krauskopf A & Ruegg
UT (2000) Does cyclosporin A generate free radicals?
Trends Pharmacol Sci 21, 288–290.
5 Perez de Lema G, Arribas I, Prieto A, Parra T, de
Arriba G, Rodriguez-Puyol D & Rodriguez-Puyol M
(1998) Cyclosporin A-induced hydrogen peroxide
synthesis by cultured human mesangial cells is blocked
by exogenous antioxidants. Life Sci 62 , 1745–1753.
6 Wang C & Salahudeen AK (1995) Lipid peroxidation
accompanies cyclosporine nephrotoxicity: effects of
vitamin E. Kidney Int 47, 927–934.
7 Parra Cid T, Conejo Garcia JR, Carballo Alvarez F &
de Arriba G (2003) Antioxidant nutrients protect
against cyclosporine A nephrotoxicity. Toxicology 189,
99–111.
8 Brookes PS, Yoon Y, Robotham JL, Anders MW &
Sheu SS (2004) Calcium, ATP, and ROS: a mitochon-
drial love–hate triangle. Am J Physiol Cell Physiol 287,
C817–C833.
9 Azzone GF, Schmehl I, Canton M & Luvisetto S (1994)
The effect of the protonmotive force on the redox state
of mitochondrial cytochromes. Biochim Biophys Acta
1187, 140–144.
10 Brown GC & Brand MD (1985) Thermodynamic con-
trol of electron flux through mitochondrial cytochrome
bc1 complex. Biochem J 225, 399–405.
11 Capitanio N, De Nitto E, Villani G, Capitanio G &
Papa S (1990) Protonmotive activity of cytochrome c
oxidase: control of oxidoreduction of the heme centers
by the protonmotive force in the reconstituted beef
heart enzyme. Biochemistry 29, 2939–2945.
12 Duszynski J & Wojtczak L (1985) The apparent
non-linearity of the relationship between the rate of
respiration and the protonmotive force of mitochondria
can be explained by heterogeneity of mitochondrial
preparations. FEBS Lett 182, 243–248.
13 Skulachev VP (1996) Role of uncoupled and non-
coupled oxidations in maintenance of safely low levels
of oxygen and its one-electron reductants. Q Rev
Biophys 29, 169–202.
14 Bakker SJ, IJzerman RG, Teerlink T, Westerhoff HV,
Gans RO & Heine RJ (2000) Cytosolic triglycerides and
oxidative stress in central obesity: the missing link
between excessive atherosclerosis, endothelial dysfunc-
tion, and beta-cell failure? Atherosclerosis 148, 17–21.
15 Fall CP & Bennett JP Jr (1999) Visualization of cyclos-
porin A and Ca2+-sensitive cyclical mitochondrial
depolarizations in cell culture. Biochim Biophys Acta
1410, 77–84.
16 Huser J & Blatter LA (1999) Fluctuations in mitochon-
drial membrane potential caused by repetitive gating of
the permeability transition pore. Biochem J 343 (Part 2),
311–317.
17 Smaili SS & Russell JT (1999) Permeability transition
pore regulates both mitochondrial membrane potential
and agonist-evoked Ca2+ signals in oligodendrocyte
progenitors. Cell Calcium 26, 121–130.
18 Crompton M, Virji S, Doyle V, Johnson N & Ward JM
(1999) The mitochondrial permeability transition pore.
Biochem Soc Symp 66, 167–179.
19 Halestrap AP, Connern CP, Griffiths EJ & Kerr PM
(1997) Cyclosporin A binding to mitochondrial cyclo-
philin inhibits the permeability transition pore and pro-
tects hearts from ischaemia ⁄ reperfusion injury. Mol Cell
Biochem 174, 167–172.
20 Cassarino DS, Swerdlow RH, Parks JK, Parker WD Jr
& Bennett JP Jr (1998) Cyclosporin A increases resting
mitochondrial membrane potential in SY5Y cells and
reverses the depressed mitochondrial membrane poten-
tial of Alzheimer’s disease cybrids. Biochem Biophys Res
Commun 248, 168–173.
21 Waldmeier PC, Feldtrauer JJ, Qian T & Lemasters JJ
(2002) Inhibition of the mitochondrial permeability
transition by the nonimmunosuppressive cyclosporin
derivative NIM811. Mol Pharmacol 62, 22–29.
22 Diaz G, Diana A, Falchi AM, Gremo F, Pani A,
Batetta B, Dessi S & Isola R (2001) Intra- and inter-
cellular distribution of mitochondrial probes and
changes after treatment with MDR modulators. IUBMB
Life 51, 121–126.
23 Boesch D, Gaveriaux C, Jachez B, Pourtier-Manzanedo
A, Bollinger P & Loor F (1991) In vivo circumvention
of P-glycoprotein-mediated multidrug resistance of
M. van der Toorn et al. Cyclosporin A-induced oxidative stress
FEBS Journal 274 (2007) 3003–3012 ª 2007 The Authors Journal compilation ª 2007 FEBS 3011
tumor cells with SDZ PSC 833. Cancer Res 51, 4226–
4233.
24 Iqbal T, Kinjo M & Dowling TC (2005) Determination
of Rhodamine 123 in cell lysate by HPLC with visible
wavelength detection. J Chromatogr B Anal Technol
Biomed Life Sci 814, 259–262.
25 Nieri P, Romiti N, Adinolfi B, Chicca A, Massarelli I &
Chieli E (2006) Modulation of P-glycoprotein activity
by cannabinoid molecules in HK-2 renal cells. Br J
Pharmacol 148, 682–687.
26 Indo HP, Davidson M, Yen HC, Suenaga S, Tomita K,
Nishii T, Higuchi M, Koga Y, Ozawa T & Majima HJ
(2006) Evidence of ROS generation by mitochondria in
cells with impaired electron transport chain and
mitochondrial DNA damage. Mitochondrion 7, 106–118.
27 Kowaltowski AJ, Smaili SS, Russell JT & Fiskum G
(2000) Elevation of resting mitochondrial mem-
brane potential of neural cells by cyclosporin A,
BAPTA-AM, and bcl-2. Am J Physiol Cell Physiol
279, C852–C859.
28 Bordow SB, Haber M, Madafiglio J, Cheung B,
Marshall GM & Norris MD (1994) Expression of the
multidrug resistance-associated protein (MRP) gene
correlates with amplification and overexpression of the
N-myc oncogene in childhood neuroblastoma. Cancer
Res 54, 5036–5040.
29 Ernest S, Rajaraman S, Megyesi J & Bello-Reuss EN
(1997) Expression of MDR1 (multidrug resistance) gene
and its protein in normal human kidney. Nephron 77,
284–289.
30 Romiti N, Tramonti G & Chieli E (2002) Influence of
different chemicals on MDR-1 P-glycoprotein expres-
sion and activity in the HK-2 proximal tubular cell
line. Toxicol Appl Pharmacol 183, 83–91.
31 Koizumi S, Konishi M, Ichihara T, Wada H, Mats-
ukawa H, Goi K & Mizutani S (1995) Flow cytometric
functional analysis of multidrug resistance by Fluo-3: a
comparison with rhodamine-123. Eur J Cancer 31A,
1682–1688.
32 Ho GT, Moodie FM & Satsangi J (2003) Multidrug
resistance 1 gene (P-glycoprotein 170): an important
determinant in gastrointestinal disease? Gut 52,
759–766.
33 Sanchez H, Bigard X, Veksler V, Mettauer B, Lampert
E, Lonsdorfer J & Ventura-Clapier R (2000) Immuno-
suppressive treatment affects cardiac and skeletal muscle
mitochondria by the toxic effect of vehicle. J Mol Cell
Cardiol 32, 323–331.
34 Strzelecki T, Kumar S, Khauli R & Menon M (1988)
Impairment by cyclosporine of membrane-mediated func-
tions in kidney mitochondria. Kidney Int 34, 234–240.
35 Elzinga LW, Mela-Riker LM, Widener LL & Bennett
WM (1989) Renal cortical mitochondrial integrity in
experimental cyclosporine nephrotoxicity. Transplanta-
tion 48, 102–106.
36 Vetter M, Chen ZJ, Chang GD, Che D, Liu S & Chang
CH (2003) Cyclosporin A disrupts bradykinin signaling
through superoxide. Hypertension 41, 1136–1142.
37 Ahmed SS, Napoli KL & Strobel HW (1995) Oxygen
radical formation during cytochrome P450-catalyzed
cyclosporine metabolism in rat and human liver micro-
somes at varying hydrogen ion concentrations. Mol Cell
Biochem 151, 131–140.
38 Nakamura M, Imaoka S, Miura K, Tanaka E, Misawa
S & Funae Y (1994) Induction of cytochrome P450
isozymes in rat renal microsomes by cyclosporin A.
Biochem Pharmacol 48, 1743–1746.
39 Garcia-Ruiz C, Colell A, Morales A, Kaplowitz N &
Fernandez-Checa JC (1995) Role of oxidative stress gen-
erated from the mitochondrial electron transport chain
and mitochondrial glutathione status in loss of mito-
chondrial function and activation of transcription factor
nuclear factor-kappa B: studies with isolated mitochon-
dria and rat hepatocytes. Mol Pharmacol 48, 825–834.
Cyclosporin A-induced oxidative stress M. van der Toorn et al.
3012 FEBS Journal 274 (2007) 3003–3012 ª 2007 The Authors Journal compilation ª 2007 FEBS