Báo cáo khoa học: The bile⁄arsenite⁄riboflavin transporter (BART) superfamily docx
Bạn đang xem bản rút gọn của tài liệu. Xem và tải ngay bản đầy đủ của tài liệu tại đây (468.79 KB, 18 trang )
REVIEW ARTICLE
The bile
⁄
arsenite
⁄
riboflavin transporter (BART) superfamily
Nahla M. Mansour*, Mrinalini Sawhney, Dorjee G. Tamang, Christian Vogl and Milton H. Saier Jr
Division of Biological Sciences, University of California at San Diego, La Jolla, CA, USA
Over the years, our research group has developed a
classification system universally applicable to all trans-
membrane transporters found in living organisms on
Earth [1,2]. This system, adopted by the International
Union of Biochemistry and Molecular Biology
(IUBMB) in 2003, currently includes about 400 famil-
ies of transporters of various types [3]. As a result of
the development of sensitive software (gap [4], ic [5]),
some of these families have been shown to be distantly
related by common descent, and hence they comprise
superfamilies [6].
The importance of family and superfamily assign-
ment is emphasized by the fact that structural, func-
tional and mechanistic data for transporters can be
extrapolated from one protein to another if, and only
if, they have been shown to be related by common des-
cent [1,2]. Further, the degree to which one can extra-
polate data from one protein to another is inversely
Keywords
arsenite; bile acids; cyclic di-GMP
metabolism; intragenic duplication;
phylogeny; regulation; riboflavin; secondary
carriers; topology; transporter
Correspondence
M. H. Saier Jr, Division of Biological
Sciences, University of California at San
Diego, La Jolla, CA 92093-0116, USA
Fax: +1 858 534 7108
Tel: +1 858 534 4084
E-mail:
*Present address
Vaccines & Recombinant DNA Technology
Lab, Nobel Project, NRC, Egypt
(Received 21 September 2006, revised
16 November 2006, accepted 4 December
2006)
doi:10.1111/j.1742-4658.2006.05627.x
Secondary transmembrane transport carriers fall into families and super-
families allowing prediction of structure and function. Here we describe
hundreds of sequenced homologues that belong to six families within a
novel superfamily, the bile ⁄ arsenite ⁄ riboflavin transporter (BART) super-
family, of transport systems and putative signalling proteins. Functional
data for members of three of these families are available, and they trans-
port bile salts and other organic anions, the bile acid:Na
+
symporter
(BASS) family, inorganic anions such as arsenite and antimonite, the arse-
nical resistance-3 (Acr3) family, and the riboflavin transporter (RFT) fam-
ily. The first two of these families, as well as one more family with no
functionally characterized members, exhibit a probable 10 transmembrane
spanner (TMS) topology that arose from a tandemly duplicated 5 TMS
unit. Members of the RFT family have a 5 TMS topology, and are homol-
ogous to each of the repeat units in the 10 TMS proteins. The other two
families [sensor histidine kinase (SHK) and kinase ⁄ phosphatase ⁄ synthe-
tase ⁄ hydrolase (KPSH)] have a single 5 TMS unit preceded by an N-ter-
minal TMS and followed by a hydrophilic sensor histidine kinase domain
(the SHK family) or catalytic domains resembling sensor kinase, phospha-
tase, cyclic di-GMP synthetase and cyclic di-GMP hydrolase catalytic
domains, as well as various noncatalytic domains (the KPSH family).
Because functional data are not available for members of the SHK and
KPSH families, it is not known if the transporter domains retain transport
activity or have evolved exclusive functions in molecular reception and sig-
nal transmission. This report presents characteristics of a unique protein
superfamily and provides guides for future studies concerning structural,
functional and mechanistic properties of its constituent members.
Abbreviations
aas, amino acyl residues; Acr3, arsenical resistance-3; BASS, bile acid:Na
+
symporter; BART, bile ⁄ arsenite ⁄ riboflavin transporter; HATPase-c,
histidine kinase-like ATPase; KPSH, kinase ⁄ phosphatase ⁄ synthetase ⁄ hydrolase; RFT, riboflavin transporter; SD, standard deviations;
SHK, sensor histidine kinase; TCDB, Transporter Classification Database; TMS, transmembrane spanner; UNK, unknown.
612 FEBS Journal 274 (2007) 612–629 ª 2007 The Authors Journal compilation ª 2007 FEBS
related to their phylogenetic distances [7–11]. Import-
antly, bioinformatic procedures can reveal the evolu-
tionary pathways taken for the appearance of the
proteins [12,13].
The criterion we have been using for the establish-
ment of homology is a comparison score of nine stand-
ard deviations (SD) or greater using the gap and ic
programs. These programs correct for unusual or
restricted amino acyl residue compositions as occur in
integral membrane proteins. The value of nine SD cor-
responds to a probability of 10
)19
that the degree of
sequence similarity observed could have occurred by
chance [1,14]. This is a highly reliable criterion of
homology that is far more rigorous than most other
criteria currently in use by the scientific community.
One recently identified superfamily was shown to
include the bile acid:Na
+
symporter (BASS) family
(TC #2.A.28) and the arsenical resistance-3 (Acr3)
family (TC #2.A.59) [6]. However, except for a brief,
outdated description of the BASS family in 1999 [15]
and the establishment of a common origin for these
two families [6], the characterization of this small
superfamily had not been reported previously.
We have conducted sequence comparisons which
revealed that the recently characterized riboflavin
transporter (RFT) of Lactococcus lactis, RibU [16] is a
member of a moderately sized family of five putative
a-helical transmembrane spanning (TMS) proteins that
is distantly related to the 10 TMS transporters of the
BASS and Acr3 families. This first became apparent
following BLAST searches of the Transporter Classifi-
cation Database (TCDB). In this paper, we show that
the putative 10 TMS proteins of the latter two families
arose by intragenic duplication of an element encoding
a 5 TMS protein similar to RibU and its orthologue
in Bacillus subtilis , YpaA. We further identify addi-
tional families within this ubiquitous superfamily,
demonstrating the presence of six families, three with
a single 5 TMS repeat unit and three with two, dupli-
cated, 5 TMS repeat units. Most unexpectedly, two of
the three families with a single 5 TMS unit exhibit fea-
tures of catalytic proteins. One of these families, the
SHK family, is a coherent group of proteins of similar
structure with the N-terminal hydrophobic transporter
domain linked to a C-terminal hydrophilic sensor his-
tidine kinase (SHK) domain. The other, the KPSH
family, is a heterogeneous group of multidomain pro-
teins, each exhibiting a different set of domain combi-
nations, suggesting differing catalytic and regulatory
functions. Catalytic domains in these proteins include
kinases, phosphatases, cyclic di-GMP synthetases and
cyclic di-GMP hydrolases (KPSH). None of the four
members of the KPSH family have been functionally
characterized, but the sequence similarity with charac-
terized proteins and protein domains allows us to
make functional predictions with a high degree of con-
fidence. The SHK and KPSH families have been
briefly described previously [17]; they are listed in the
Pfam and Interpro databases as the ‘5 TM receptors
of the 5TMR-LYT domain’ (PF07694) and the ‘5 TM
receptors of the LytS-YhcK type transmembrane
region’ (IPR011620), respectively. Finally, one of the
families (UNK or unknown family), consisting of
putative transporters with two tandemly repeated
5 TMS units, includes homologues with no function-
ally characterized members. In this case, we have no
basis for making confident predictions of substrates
transported or the energy coupling mechanism(s)
involved. The observations reported here reveal that
this superfamily is far more diverse than was previ-
ously recognized.
Results
Homologues with a basic 5 TMS unit
Using the 5 TMS riboflavin transporter (YpaA; Bsu1
in Table S1) of B. subtilis as the query sequence, PSI-
BLAST searches against the NCBI protein database
with iterations [18] brought up the homologues listed
in Tables S1–S3 on our website (d.
edu/msaier/supmat/BART/). These include the char-
acterized riboflavin transporter, RibU of L. lactis
(Lla3 in supplementary Table S1) [16]. The what pro-
gram [19] was used to predict the topologies of individ-
ual proteins. A multiple alignment was derived using
the clustal x program [20], and the treeview pro-
gram [21] was used to draw a phylogenetic tree
(data not shown). This tree revealed that these proteins
fall into three subfamilies which we call the RFT
(58 proteins), SHK (31 proteins) and KPSH (4 proteins)
families (see above). While the RFT family includes
both bacterial and archaeal proteins, the SHK and
KPSH families included members that are derived
exclusively from bacteria. Most of these bacterial
proteins are from either proteobacteria or firmicutes
(Tables S1–S3).
Using the gap and ic programs [4,5], we established
that all of the proteins listed in Tables S1–S6 are
homologous in the regions of their transmembrane
domains (see below). The hydrophobic domains of
members of the three 5 TMS families are relatively
similar in sequence to each other, as are those of mem-
bers of the three 10 TMS families (comparison scores
of ‡ 15 SD). The 5 TMS proteins are more distantly
related to the 10 TMS proteins.
N. M. Mansour et al. The BART superfamily
FEBS Journal 274 (2007) 612–629 ª 2007 The Authors Journal compilation ª 2007 FEBS 613
Homologues with a basic 10 TMS unit
To identify the protein homologues of the 10 TMS
families of the bile ⁄ arsenite ⁄ riboflavin transporter
(BART) superfamily, the ArsB protein of B. subtilis
(P45946) was used as the query sequence in PSI-
BLAST searches conducted with 11 iterations. Hun-
dreds of homologues were retrieved. Redundancies
were removed, leaving 285 protein sequences (supple-
mentary Tables S4–S6). About 82% are from bac-
teria while 15% are from eukaryotes, and 3% are
from archaea. A phylogenetic tree was generated
(data not shown). The proteins proved to fall into
three major families BASS, Acr3 and UNK. All
three families contain proteins from bacteria, archaea
and eukaryotes, and all three families include pro-
teins from both Gram-positive and Gram-negative
bacteria. However, there are some organismal distinc-
tions. For example, within the eukaryotic domain,
the BASS family has homologues from plants, ani-
mals and fungi, but the Acr3 family has only fungal
protein members, and the UNK family consists only
of animal and plant proteins. These distinctions
undoubtedly correlate with distinctive functions. The
fact that eukaryotes have 10 TMS members of the
BART superfamily, but not 5 TMS members, may
reflect the tendency of eukaryotic proteins to become
larger during evolution, possibly for purposes of
complex formation, subcellular targeting and regula-
tion [22].
In the archaeal domain, only one archaeal subdivi-
sion, the Euryarchaeota, is represented. However, the
genuses represented differ depending on the family.
The BASS family has homologues only from Pyrococ-
cus, the Acr3 family has proteins from Archaeoglobus,
Pyrococcus and Thermococcus, and the UNK family
has homologues only from Haloarcula and Methano-
sarcina. The low representation of archaeal homo-
logues is worthy of note.
The BASS and UNK families have equal numbers of
eukaryotic homologues (23 and 24, respectively), about
23% and 16%, respectively, of the total numbers of
members of these two families. The Acr3 family has
just 5% of its members derived from eukaryotes.
Many organisms encode within their genomes more
than one paralogue of the 10 TMS BART superfamily
proteins, but few if any seem to encode more than
four. No archaeon has more than one. Among the
eukaryotes, the fungi appear to have just one or
two per organism while most fully sequenced genomes
of plants and animals encode either two or three.
Bacteria represented have one to four 10 TMS para-
logues.
Preliminary evidence for homology of the 5 and
10 TMS proteins of the BART superfamily
When TCDB was blasted using TC-BLAST [18,25]
with the YpaA protein of B. subtilis (Bsu1 in cluster 3
of Fig. 1B) as the query sequence, the ArsB protein of
B. subtilis was retrieved with an e-value of 0.006. Resi-
dues 22–187 in YpaA (TMSs 2–5) aligned with resi-
dues 25–167 in ArsB (TMSs 2–5) showing 26%
identity and 42% similarity. When the best conserved
region of this binary alignment was examined with the
gap program and 500 random shuffles, a comparison
score of 7.0 SD was obtained. These values are already
sufficient to suggest, but not establish, homology.
The sequence similarity between the 5 TMS proteins
and the first repeat unit of the 10 TMS proteins was
substantially greater than observed when the 5 TMS
protein sequences were compared with the second
repeat units of the 10 TMS proteins. This observation
led us to suggest that when the 5 TMS proteins (which
presumably function as homodimers) duplicated to
give 10 TMS proteins, the first repeat unit retained its
original topology and its primary, generalized, trans-
port function, while the second repeat unit diverged in
sequence to a greater extent to assume the opposite
topology in the membrane and to serve a more special-
ized, permease-specific function. A generalized function
might, for example, be energy coupling, while a
specialized function might be substrate recognition.
Precedence for these concepts has been published pre-
viously [26–30]. Homology between the 5 TMS and
10 TMS proteins is established below.
The riboflavin transporter (RFT) family
The proteins of the RFT family within the BART
superfamily are presented in Table S1, and the
multiple alignments of their sequences are shown in
Figure S1A on our website. In Table S1 and sub-
sequent tables, the proteins are arranged first accord-
ing to phylogenetic cluster, and second according to
position in that cluster. Using the what program [19]
and the hmmtop program [31], most homologues have
five putative TMSs although some were predicted to
have six (Table S1).
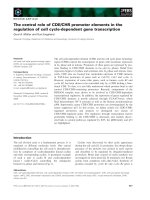
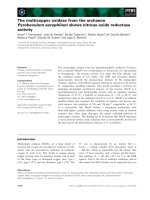
The average hydropathy and similarity plots for this
family are shown in Fig. 1A. There are five peaks of
average hydrophobicity corresponding to five peaks of
average similarity. It therefore appears that these pro-
teins share a common 5 TMS topology. The amphi-
pathicity plot (not shown) revealed no distinctive
characteristics. The multiple alignments upon which
these plots were based (Fig. S1A) showed no single
The BART superfamily N. M. Mansour et al.
614 FEBS Journal 274 (2007) 612–629 ª 2007 The Authors Journal compilation ª 2007 FEBS
residue position with full residue conservation or even
full conservation of residue type. However, as shown
in Fig. 1A, TMS 2 is best conserved. It shows the fol-
lowing consensus sequence:
D FSDVPðHyÞ
3
G G ðHyÞ
3
GPðHyÞ
2
G ðHyÞ
6
KNðHyÞ
3
Y ðHyÞ
2
XGX
3
G
(alignment positions 76–114; X, any residue; Hy, any
hydrophobic residue; italic residues, consensus residues
that are common to those in the SHK family; under-
lined residues, consensus residues that are common to
those in the KPSH family.)
The clustal x-derived phylogenetic tree of the RFT
family is shown in Fig. 1B, and the bootstrapped tree is
shown in Figure S1B. We also derived paup-based trees
using both neighbor joining and parsimony algorithms
(Figs S1C and S1D, respectively). Neighbor joining
bootstrapped trees for all six families (supplementary
Figs S1–6B and S1–6C) as well as parsimony trees (sup-
plementary Figs S1–6D) are provided on our website.
The neighbor joining and parsimony trees, with or
Va lu e
Alignment Position
-0.5
0
0.5
1
1 100 200
A
B
12
3
4
5
-1
Tma1
Tko1
Pab1
Pho1
Cac3
Cac2
Cte2
Sth3
Rxy1
Bac1
Tte3
Lca2
Lde2
Lac2
Lga2Ljo2
Lpl2
Ppe2
Efa4
Efa5
Lla4
Sth7
Spy3
Ssu2
Spn4
Sag4
Smu3
Lla3
Ssu1
Smu1
Spy2
Sag1
Spn2
Sth2
Lme1
Ooe2
Lmo3
Lin1
Gka1
Bsu1
Bli1
Bce1
Ban1
Bth1
Oih1
Sau2
Sep1
Cpe1
Tte1
Cac1
Cte1
Blo2
Lpl1
Ppe1
Efa1
Lca1
Lga1
Ljo1
1
2
3
4
Fig. 1. (A) Average hydropathy (top) and
similarity (bottom) plots for the RFT family.
The
AVEHAS program [79] was used to gener-
ate the plots shown here (and elsewhere in
this paper), based on the
CLUSTAL X [20] mul-
tiple alignment as shown in Fig. S1. The
proteins and their properties are tabulated in
Table S1A on our website (http://biology.
ucsd.edu/msaier/supmat/BART). (B) Phylo-
genetic tree of the RFT family. The tree is
based on the
CLUSTAL X alignment shown in
Fig. S1A. The bootstrapped tree is shown in
Fig. S1B.
PAUP-based trees [76] based on
neighbor joining (Fig. S1C) and parsimony
(Fig. S1D) are also available on our website.
All tables of the proteins (Tables S1–S6),
multiple alignments of the protein members
of the six families of the BART superfamily
(RFT, SHK, KPSH, BASS, ACR and UNK;
Figs S1A–S6A) as well as the bootstrapped
trees (Figs S1B–S6B) can be found on our
website ( />supmat/BART).
PAUP trees designed using
neighbor joining (with bootstrapping) and
parsimony (without bootstrapping) can be
found on our website in Figs S1C–S6C, and
S1D–S6D, respectively. The format of pres-
entation is the same for Figs 2–6.
N. M. Mansour et al. The BART superfamily
FEBS Journal 274 (2007) 612–629 ª 2007 The Authors Journal compilation ª 2007 FEBS 615
without bootstrapping, are very similar. Four clusters
are apparent. Cluster 1 consists of proteins from firmi-
cutes and one Actinobacterium, Rubrobacter xylanophi-
lus (Rxy1). This last protein falls into a subcluster with
three firmicute proteins, showing that although most of
these proteins follow the phylogenies of the host organ-
isms, this is not true of Rxy1. Proteins in cluster 1 show
a broader size range [176–222 amino acyl residues (aas)]
than for the other three clusters, but proteins in all four
clusters are of similar sizes.
Cluster 2 proteins are exclusively from firmicutes,
and seven of the nine homologues have paralogues in
cluster 1. The other two (Lme1 and Ooe2) apparently
lack paralogues in the RFT family. All but two pro-
teins in cluster 3 are from firmicutes, and the two
exceptions (Tma1 and Blo2) are distantly related to
each other and all other homologues of cluster 2. Clus-
ter 2 contains the characterized riboflavin transporter,
RibU, from Lactococcus lactis (Lla3) [16].
Cluster 3 contains the functionally characterized ribo-
flavin transporter of B. subtilis (Bsu1; YpaA; C. Vogl,
unpublished results). Because there is extensive overlap
of organismal sources between clusters 1 and 2, as well
as between clusters 1 and 3 (but not between clusters 2
and 3), we suggest that the proteins in cluster 1 primar-
ily represent one set of functionally related orthologues,
different from those in clusters 2 and 3, which may,
however, all be orthologous, serving a single function.
Three archaeal proteins comprise cluster 4. These
proteins are also likely to be orthologous to each
other, possibly also to cluster 1 or cluster 2 ⁄ 3 proteins.
The SHK family
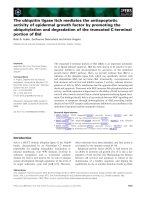
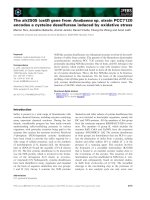
Thirty-one proteins comprise the current SHK family
(supplementary Table S2 and Figs S2A–D). These pro-
teins have an N-terminal 6 TMS hydrophobic domain
(Fig. 2A) where TMS 0 is unique to the SHK family.
It is, however, well conserved, suggesting that it serves
an important unified function in proteins of the SHK
family. TMSs 1–5 in Fig. 2A correspond in sequence
to TMSs 1–5 in the RFT family (Fig. 1A). Note that
in both Figs 1A and 2A, TMSs 1, 2 and 4 are more
hydrophobic than peaks 3 and 5.
The 6 TMS hydrophobic domain in SHK family
proteins is followed by three recognizable domains.
The first is a cGMP-binding phosphodiesterase ⁄
Anabaena adenyl cyclase ⁄ E. coli FhlA (GAF) domain,
present in phytochromes, cyclic GMP phosphodiest-
erases and other sensory transduction proteins [32].
The second is a large, well conserved sensor kinase
domain, homologous to thousands of other sensor kin-
ases in the NCBI database. Those included in this
study are all more similar to each other than they are
to any of the other sensor kinases, and only these have
the homologous N-terminal hydrophobic domain com-
mon to the RFT family proteins. The third domain is
the HATPase-c domain, a histidine kinase-like ATPase
domain. These domains are found not only in sensor
kinases, they are also found in topoisomerases I and II,
heat shock proteins of the HSP90 family, phytochrome
ATPases and DNA mismatch repair enzymes [33].
Because sensor kinase domains must be in the cyto-
plasm, we can infer that TMS 0 (Fig. 2A) passes
through the membrane from inside the cell to the
outside. By analogy, the 5 TMS proteins of the RFT
family may have their N-termini outside and their
C-termini inside (see below).
Examination of the SHK family multiple alignments
(Fig. S2A) revealed many fully conserved residues.
The most condensed region of conservation within the
hydrophobic domain occurred in TMS 2 where the
consensus sequence is:
N T
R ðHy Þ
2
G ðHyÞ
3
ðGÞ G ðHyÞ
2
G G P ðHyÞ
2
G ðHyÞ
3
G LTGG L HRYSHyG
(alignment positions 113–145; Hy, any hydrophobic
residue; bold, fully conserved; italic residues, common
to the consensus sequence residues for the RFT family;
underlined residues, common to those of the KPSH
family).
A few fully conserved positions are also present
in TMSs 3, 4 and 5 as well as the downstream hydro-
philic domains. The latter include an A VAI T
DREKI L A consensus region with three fully con-
served residues (alignment positions 292–303). Exam-
ination of Table S2 and Fig. 2B reveal that only one
organism, Photobacterium profundum, has more than
one SHK member, and the two paralogues in this
organism are distantly related, falling into different
clusters of the phylogenetic tree. With two exceptions,
proteins of the SHK family are of fairly uniform size
(556–597). Both firmicutes and proteobacteria as well
as one homologue from Fusobacterium nucleatum, are
represented. All members of the SHK family are pre-
dicted to have six TMSs (Table S2).
The phylogenetic tree for the SHK family (Fig. 2B)
shows four clusters. Bootstrap values are provided in
Figures S2B and S2C. Cluster 1 proteins are exclu-
sively from firmicutes, while cluster 3 and 4 proteins
are exclusively from proteobacteria. Each of these
three clusters is coherent with all proteins within any
one cluster branching from each other at points distant
from the center of the tree. The two short variants,
Ahy1 and Ppr2 (440 and 451 aas), from Aeromonas
The BART superfamily N. M. Mansour et al.
616 FEBS Journal 274 (2007) 612–629 ª 2007 The Authors Journal compilation ª 2007 FEBS
hydrophila and Photobacterium profundum, respectively,
comprise cluster 3. Cluster 2 is most diverse in
sequence as well as organismal source. These loosely
clustered proteins are from proteobacteria, firmicutes
and Fusobacterium nucleatum. The presence of this
cluster clearly suggests that members of the SHK fam-
ily are not all orthologous.
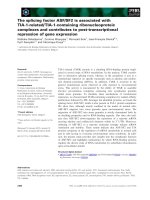
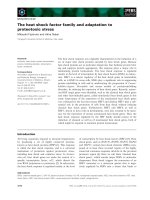
The KPSH family
Four proteins comprise the KPSH family (Table S3).
These proteins are about equally diverse in sequence as
revealed by the phylogenetic tree shown in Fig. 3B.
Each is from a different bacterial subdivision, one
from Deinococcus geothermalis, one from a c-proteo-
bacterium, one from a d-proteobacterium, and one
from a putative uncultured archaeon. The tree is based
on the multiple alignment shown in Fig. S3A. These
proteins exhibit six N-terminal peaks of hydrophobici-
ty (peaks 0–5 in Fig. 3A), corresponding to TMSs 0–5
in Fig. 2A. TMSs 1–5 correspond to TMSs 1–5 in
Fig. 1A. As with TMS 2 of the RFT and SHK famil-
ies, TMS 2 of the KPSH family is the best conserved
with the following consensus sequence:
G ðHyÞ
3
D Hy R X ðHyÞ
5
X G LFXG XLPðHyÞ
10
YRLXHyG G
(alignment positions 72–110 in Fig. S3A; X, any resi-
due; Hy, any hydrophobic residue; bold, fully con-
served; italic residues are common to those in the RFT
family consensus sequence; underlined residues are
-1.5
-1
-0.5
0
0.5
1
1 100 200 300 400 500 600
A
B
0
1
2
3
4
5
Ban2
Bsu2
Bli2
Ppe3
Efa3
Ooe1
Sag3
Smu2Dde1
Dvu1
Bcl1
Tte2
Fnu1
Ppr2
Ahy1
Dac1
Son1
Ppr1
Vfi1
Vch1
Vvu1
Vpa1
Eam1
Sen1
Sty1
Sfl1
Eco1
Rru1
Eca1
Cvi1
Dar1
12
3
4
Fig. 2. (A) Average hydropathy (top) and
similarity (bottom) plots for the SHK family.
(B) Phylogenetic tree for the SHK family.
The multiple alignment and list of proteins
used are presented in Fig. S2A and
Table S2, respectively. Four homologues of
abnormal size, listed in Table S2, were eli-
minated when the Fig. S2A alignment was
derived. The bootstrapped trees are shown
in Figs S2B and S2C. The parsimony tree is
shown in Fig. S2D.
N. M. Mansour et al. The BART superfamily
FEBS Journal 274 (2007) 612–629 ª 2007 The Authors Journal compilation ª 2007 FEBS 617
common to residues in the SHK family consensus
sequence.)
The four proteins that comprise the sequence diver-
gent members of the KPSH family are all multidomain
proteins that seem to share only the characteristic of
having a common N-terminal hydrophobic domain. In
the case of Son2 from Shewanella oneidensis (998 resi-
dues), following the N-terminal 6 TMS domain are
three PAS helix–loop–helix, protein–protein interaction
domains, common in proteins involved in energy sens-
ing and signal transduction [34,35], a GGDEF domain
(domain containing the conserved GDEF motif) and
an EAL domain (domain containing the conserved
EAL motif). The latter two domains are likely to be
involved in cyclic di-GMP synthesis and hydrolysis,
respectively [36–38].
The Uar2 protein, from an ‘uncultured archaeon’ is
of 654 aas and has (following the common N-terminal
hydrophobic domain) a LytS domain followed by a
COG4191 domain (of unknown function), a histidine
kinase A dimerization phosphoacceptor (HisKA)
domain, and a C-terminal HATPase-c domain. The
LytS domain is homologous to LytS, a signal transduc-
tion regulator of cell autolysis [17]. The HisKA domain
is a conserved bacterial histidine sensor kinase domain
[39], and the HATPase-c domain resembles a histidine
kinase ATPase domain [40]. Uar2 is similar in several
of these respects to members of the SHK family.
Following the N-terminal 6 TMS domain of the
Gsu1 protein from Geobacter sulfurreducens are at least
two AtoS-type sensor kinase domains [41], followed by
(a) a HisKA domain, (b) a HATPase-c domain, and (c)
a signal receiver (REC) domain at the extreme C-termi-
nus of this 1112 residue protein. Finally, the Dge1 pro-
tein from Deinococcus geothermalis is relatively short
(349 residues) with a single GGDEF domain following
the hydrophobic transmembrane domain.
The BASS family
Functionally characterized members of the BASS fam-
ily catalyze Na
+
:bile acid symport [15,42]. These sym-
porters exhibit broad specificity, taking up a variety of
nonbile organic compounds as well as taurocholate
and other bile salts [43]. They have been identified in
intestinal, liver and kidney tissues of animals, and at
least three isoforms are present in a single species such
as humans. The BASS family is also called the solute
carrier family 10 [23,24,43]. Functionally characterized
members of the BASS family appear to possess their
bile acid binding sites within and preceding the last
transmembrane spanner [23,44].
A BASS in the apical membrane of the human ileal
intestine catalyzes the electrogenic uptake of bile acids
with a stoichiometry of bile acid:Na
+
of 1 : 2 [24]. This
protein is associated with the 16 kDa subunit c of the
vacuolar proton pump, an association that may in part
account for its apical location [45]. Thus, the vacuolar
proton pump-associated apical sorting machinery may
play a role in sorting the apical Na
+
:bile symporter to
the basolateral membrane.
The rat liver Na
+
⁄ taurocholate cotransporter is sub-
ject to elaborate regulation in response to cyclic AMP
and cell swelling [46,47]. It has two N-terminal,
B
-1.5
-0.5
0.5
Value
Alignment Position
-1
0
1
1 100 200 300 400 500 600 700 800 900 1000 1100
A
0
1
2
3
4
5
Gsu1
Uar2
Dge1
Son2
Fig. 3. (A) Average hydropathy (top) and similarity (bottom) plots for
the four proteins of the KPSH family. (B) The phylogenetic tree for
these four proteins. The multiple alignment (Fig. S3) and list of pro-
teins (Table S3) are available on our website. The bootstrapped
trees are shown in Figs S3B and S3C. The parsimony tree is shown
in Fig. S3D.
The BART superfamily N. M. Mansour et al.
618 FEBS Journal 274 (2007) 612–629 ª 2007 The Authors Journal compilation ª 2007 FEBS
N-linked carbohydrate sites and two Tyr-based basolat-
eral sorting motifs at its carboxyl terminus (YEKI and
YKAA). The former targets the protein to the apical
membrane in the absence of the latter, but the latter
overrides the former, targeting the protein to the baso-
lateral membrane [48]. The ileal homologue has a
14-residue cytoplasmic tail with a b-turn structure that
targets the protein to the apical membrane [49].
The human orthologue of the rat Na
+
⁄ taurocholate
symporter (TC #2.A.28.1.1) (NTCP; SLC10A1) exhib-
its multiple single nucleotide polymorphisms in popula-
tions of European, African, Chinese and Hispanic
people [44]. Four nonsynonymous single nucleotide
polymorphisms are associated with significant loss of
transport function or change in substrate specificity.
One form, found in Chinese Americans, does not cata-
lyze bile acid uptake but catalyzes estrone sulfate
uptake. This transporter may play a role in mainten-
ance of enterohepatic recirculation of bile acids [44].
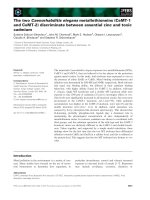
The members of the BASS family can be found on
our website (Table S4), and the clustal x alignment
of their sequences, shown in Fig. S4A, provides the
basis for the average hydropathy and similarity (Ave-
HAS) plots shown in Fig. 4A as well as the tree shown
in Fig. 4B and the bootstrapped trees shown in
Figs S4B and S4C. As revealed in Table S4, most
organisms represented have only one member of the
BASS family, but two can be found in a few bacteria,
plants and animals, and animals can have up to three.
Only Bos taurus and Tetraodon nigroviridis have three.
Most of the homologues from prokaryotes fall into the
size range 300–350 aas although a few are smaller or
larger. The plant proteins are about 400 aas in length,
and the animal homologues range from about 350–550
aas with one protein from the chicken having 679 aas.
The average hydropathy and similarity plots reveal
10 conserved peaks of average hydropathy. Striking
peaks of amphipathicity were observed just preceding
peak 1, between peaks 2 and 3, and between peaks 4
and 5, although striking peaks of average amphipathic-
ity were not observed in the second hydrophobic
halves of these proteins (data not shown). Only the
chicken homologue, Gga1, has an extension following
peak 10, and only Gga4 has an internal deletion not
found in the other homologues. These could be due
to errors in exon recognition. The Tni1 protein from
Tetraodon nigroviridis has several internal hydrophilic
insertions. Several proteins have N-terminal hydrophi-
lic extensions, but Gga4 has the longest. A single resi-
due proved to be fully conserved in all members of the
BASS family. This is a prolyl residue at alignment
position 451 in TMS 5. The best conserved regions
overlap the moderately hydrophobic peaks 4 (best
conserved) and 9 (less well conserved). The consensus
sequences for these two peaks are:
TMS 4: Hy A V G ðHyÞ
4
GCCPGGTASN
ðHyÞ
2
ðSTÞ FLALGDV
TMS 9: R ðSTÞ Hy ðSTGÞ FHyGHyQNðSTGÞ
GLðAGCÞðHyÞ
4
(Hy, any hydrophobic residue; residues in parentheses
represent alternative possibilities at a single position.)
The BASS family trees are shown in Figs 4B, and
Supplementary figures S4B, S4C and S4D, all of which
show excellent agreement as usual. The trees show
eight primary clusters as well as several branches that
stem from the center of the tree and therefore do not
belong to one of the primary clusters. Each of these
branches bears a bacterial protein. This tree reveals
that BASS family members cluster primarily according
to organismal type (also Table S4). Thus, clusters 1–2
consist only of prokaryotic proteins, including both
bacterial and archaeal proteins; the small cluster 3 pro-
teins are derived only from proteobacteria; cluster 4
proteins are from plants and cyanobacteria; cluster 5
proteins are from a range of nonproteobacterial types;
cluster 6 and 7 proteins derive exclusively from ani-
mals; and cluster 8 is derived only from bacteria.
Although bacterial paralogues were not observed in
clusters 1–4, the proteins in none of these clusters fol-
lowed the phylogenies of the host organisms. Perhaps
early extragenic duplication events followed by nonse-
lective gene loss or horizontal transfer of the encoding
genes account for these results. Only rice, with two
paralogues in cluster 4 (Osa2 and Osa3) has more than
one homologue in any one of these clusters.
In contrast to clusters 1–4, the clustering patterns in
cluster 5 follow those of the source organisms. Because
each protein is derived from a different organism, these
proteins may be orthologues serving a single function.
Like clusters 1–4, the animal proteins in clusters 6 and
7 and the bacterial proteins in cluster 8 are not likely
to be orthologous although subclusters of potential
orthologues can be identified. For example, the cluster-
ing of a spirochete protein (Lin5) with the cyanobacte-
rial homologues is unexpected, and possibly resulted
from horizontal gene transfer between subdivisions.
The ACR3 family
Two proteins of the Acr3 family have been function-
ally characterized. These proteins are the ‘Acr3’ pro-
tein of Saccharomyces cerevisiae, also called the Arr3
protein [50], and the ‘ArsB’ protein of Bacillus subtilis
[51]. The latter protein is not related to ArsB of
N. M. Mansour et al. The BART superfamily
FEBS Journal 274 (2007) 612–629 ª 2007 The Authors Journal compilation ª 2007 FEBS 619
Escherichia coli. The Acr3 protein is present in the
yeast plasma membrane and pumps arsenite, but not
arsenate, antimonite, tellurite, cadmium or phenyl-
arsine oxide out of the cell in response to the proton
motive force [50]. The Bacillus protein exports both
arsenite and antimonite [51]. The exact transport
mechanism is not established, but a uniport or cation
antiport mechanism seems probable.
Table S5 and Fig. S5A on our website present the
members of the Acr3 family and show the clustal x
multiple alignment, respectively, upon which the aver-
age hydropathy (Fig. 5A, top) and average similarity
(Fig. 5A, bottom) plots as well as the phylogenetic tree
(Fig. 5B) are based. The bootstrapped and parsimony
trees are shown in Figs S5B, S5C and S5D on our
website. Examination of Table S5 reveals that most
organisms represented have only one Acr3 homologue,
and those with two are all from bacteria. No archaeon
or eukaryote displays more than one, and no organ-
isms had more than two.
Examination of the size variations observed for these
proteins revealed that most of the prokaryotic
Alignment Position
Value
-0.5
-1.5
0
0.5
1
1 100 200 300 400 600 700 800 900
1
2
3
4
5
6
7
8
9
10
1500
-1
1
A
B
Aae1
Kra2
Asp4
Bli4
Son2
Wsu1
Dac2
Csa1
Mma7
Mac2
Gox2
Bfu3
Sen4
Sty2
Cef2
Cdi1
Mma5
Asp3
Bpa1
Sco2
Pae3
Psy
Pfl1
Sau3
Msu2
Nme3
Oih1
Bli3
Bsu2
Bcl1Bha1
Ban2
Bth5
Lme1
Sth1
Smu1
Nme4
Msu1
Hso1
Osa2
Les1
Ath1
Osa3
Mca2
Sel4
Ssp6
Ftu1
Spo1
Ava3
Sav2
Bli5
Gka3
Bha2
Bcl3
Pgi1
Bfr1
Bth6
Dme3
Cbr1
Jsp1
Mmu7
Bta1
Gga4
Tni1
Bta2
Gga1
Ocu1
Cfa1
Ptr1
Ppy1
Rno1
Cgr1
Dre1
Tni2
Bta3
Tni4
Ppr2
Mde2
Mma9
Lin5
Sel6
Ssp7
Cwa2
Ava2
Nsp2
Pae6
Ppu3
Rge3
Bab1
Bme1
6
7
1
2
3
4
5
8
Hsa5
2
Fig. 4. (A) Average hydropathy (top) and
similarity (bottom) plots for the BASS family.
(B) The phylogenetic tree for the BASS fam-
ily proteins. The list of proteins and the mul-
tiple alignment upon which these plots
were based can be found in Table S4 and
Fig. S4A on our website, respectively. The
bootstrapped trees are shown in Figs S4B
and S4C. The parsimony tree is shown in
Fig. S4D.
The BART superfamily N. M. Mansour et al.
620 FEBS Journal 274 (2007) 612–629 ª 2007 The Authors Journal compilation ª 2007 FEBS
homologues are of similar sizes (320–390 aas) with just
a few exceptions. All of the fungal proteins are larger
(389–454 aas), and the two Mycobacterial orthologues
are still larger (498 aas). The latter two proteins have
hydrophilic C-terminal extensions of about 140 resi-
dues. These extensions correspond to the entirety of low
molecular weight phosphatases of the LMWP family,
some of which (e.g., Wzb of E. coli; P0AAB2; 147 aas)
hydrolyze phosphotyrosine proteins, regulating capsular
exopolysaccharide production [52–54]. Possibly these
transporters play a role in polysaccharide secretion.
The fungal homologues proved to have either a 50
residue hydrophilic insertion between putative TMSs 8
and 9, or an N-terminal hydrophilic extension in front
of TMS 1, both of unknown function. The average
hydropathy and similarity plots reveal 10 well con-
served peaks of hydrophobicity (1–10) as well as an
additional C-terminal peak (11) present in several
homologues, but not in many others. Two prolyl resi-
dues are fully conserved, one at alignment position 185
in TMS 3 and the other at alignment position 337
in TMS 6. Nevertheless, the best conserved peaks over-
all were TMSs 4 and 9 as for the BASS family.
The consensus sequences for these two TMSs are:
TMS 4: G A A P C T A A ðHyÞ
3
WSXHyðASTÞ XG
ðDETÞ PXðFYÞðTACÞ
TMS 9: A A P ðSAÞ
2
ðHyÞ
2
GASNFFEHyAHyA
Hy A Hy ðSAGÞ Hy F G
(Hy, any hydrophobic residue; residues in parentheses
represent alternative possibilities at a single position.)
Phylogenetic trees for the Acr3 family are shown in
Figs 5B, S5B, S5C and S5D, all in good qualitative
agreement. Of the eight bacteria having two para-
logues, all but one (Dechloromonas aromatica) have
one of these paralogues in cluster 1 and the other in
cluster 3. D. aromatica has one in cluster 2 and one
in cluster 3. It is interesting to note that bacterial and
archaeal proteins are found in all three clusters, but
the eukaryotic proteins are all in cluster 3. These fun-
gal proteins cluster together, distant from any of the
bacterial proteins which cluster into two distinct sub-
clusters of cluster 3. The functionally characterized
arsenite exporters, Sce1 of Saccharomyces cerevisiae,
and Bsu1 of B. subtilis, are in the fungal and pro-
karyotic subclusters of cluster 3, respectively (see
below).
Cluster 1 is diffuse, consisting of distantly related
proteins. Subclusters correspond to specific types of
bacteria (firmicutes or proteobacteria). The same is
observed for some of the subclusters in the more com-
pact cluster 2, but there are also some notable
exceptions [e.g., Cth1 (from a firmicute) clusters with
proteobacterial proteins, and Rpa1 (from a Plancto-
mycetes) clusters with Msp1 from an a-proteobacteri-
um]. The two primary subclusters in cluster 3 include
proteins exclusively from fungi and exclusively from
bacteria and archaea, respectively. The latter subclus-
ter is split into two subsubclusters, one derived from
Actinobacteria with one exception (Mma1 from Mag-
netospirillum magnetotacticum,ana-proteobacterium),
the other derived from various other prokaryotic sub-
divisions, but not from Actinobacteria. This last one
includes proteins from proteobacteria, firmicutes,
cyanobacteria, chlorobi and euryarchaeota.
The UNK family
The members of the UNK family are listed in
Table S6, and the multiple sequence alignment is
shown in Fig. S6A. The latter provided the basis for
the average hydropathy and similarity plots shown in
Fig. 6A and the tree presented in Fig. 6B. The UNK
proteins are derived from eukaryotes (animals, plants
and fungi) and bacteria (proteobacteria and actinobac-
teria primarily). No two UNK family proteins are
derived from a single organism.
The average hydropathy plot reveals 10 conserved
peaks of hydropathy. A single strong peak of amphi-
pathicity (angle set at 100°) was observed between
putative TMSs 6 and 7 (data not shown). As expected,
based on the properties of the previously described
families, peaks 4 and 9 were only weakly hydrophobic.
Several fully conserved residues were found: prolyl
and glycyl residues in peak 4, a P in peak 6, a K pre-
ceding peak 9, and a P and a Q in peak 10. The best
conserved peaks were 4 and 5, and 9 and 10 (Fig. 6A).
One protein, Mgr2, had an internal deletion near the
N-terminus as well as a long C-terminal extension of
about 300 residues.
Consensus sequences for the four best conserved
regions are:
P4: G ðHyÞ
4
CX LP ðSTÞTVQS SIAFTSHyAKGNV
P9: F C G S K K SLAðSTÞ GHyPMAXHyHyF
P5: S S ðHyÞ
2
G ðHyÞ
3
TPðHyÞ
3
TPðHyÞ
3
G ðHyÞ
3
P10: GðHyÞ
4
P ðHyÞ
3
FHQ IQ L MVCAðHyÞ
2
(X, any residue; Hy, any hydrophobic residue; bold,
fully conserved.)
Limited sequence similarity can be observed between
the P4 and P9 sequences, and between the P5 and P10
sequences.
N. M. Mansour et al. The BART superfamily
FEBS Journal 274 (2007) 612–629 ª 2007 The Authors Journal compilation ª 2007 FEBS 621
The phylogenetic tree shown in Fig. 6B reveals 10
clusters plus a few orphan proteins. Clustering is in
general according to organismal type with a few inter-
esting exceptions. In cluster 1, Rba2 from a plancto-
mycetes, clusters loosely with the plant orthologues.
Cluster 2 proteins are all derived from animals. Clus-
ters 3 and 4 proteins are all of fungal origin. Cluster 5
includes two distantly related proteins from two differ-
-0.5
0
0.5
1
1 100 200 300 400 500 600
1
2
3
Value
Alignment Position
4
5
67
8
9
10
11
-1.5
-1
A
B
Rpa1
Afu3
Gsu2
Tfu2
Bcl2
Ban3
Bth4
Bpa3
Eca2
Xca2
Gox3
Car1
Bce17
Ppu2
Avi2
Bli6
Asp6
Cef4
Pho2
Tma1
Te r1
Nsp1
Ava1
Ssp3
Cwa1
Dac1
Rba1
Mac1
Pfu1
Tko1
Nme1
Bth3
Cth1
Rsp1
Ilo1
Mde1
Son1
Apl1
Hin1
Pmu1
Sus1
Mca1
Rru1
Atu1
Msp1
Cvi1
Avi1
Rge2
Tde1
Sfl1
Dar2
Bvi1
Bma1
Bps1
Rme1
Reu1
Yli
1
Gze1
Mgr1
Ncr1
Cne2
Uma1
Sdo1
Sce1
Dha1
Cal1
Tfu1
Ssp2
Nfa2
Rer1
Mbo1
Mtu1
Mma1
Bli2
Asp1
Kra1
Cgl3
Cef1
Nar1
Ppr1
Vvu2
Vfi1
Vpa1
Ljo1
Chu1
Dde1
Dps1
Cac1
Ade1
Gka2
Bsu1
Bsp1
Ssp1
Bce1
Bth1
Ban1
Npu1
Dar1
Gsu1
Mth1
Cte1
Cli1
Bja1
Bfu1
1
2
3
Fig. 5. (A) Average hydropathy (top) and similarity (bottom) plots for the Acr3 family. (B) The phylogenetic tree for the Acr3 family proteins.
The list of proteins and the multiple alignment upon which these plots were based can be found in Table S5 and Fig. S5A on our website,
respectively. The bootstrapped trees are shown in Figs S5B and S5C. The parsimony tree is shown in Fig. S5D.
The BART superfamily N. M. Mansour et al.
622 FEBS Journal 274 (2007) 612–629 ª 2007 The Authors Journal compilation ª 2007 FEBS
ent bacterial subdivisions. Clusters 6, 8, 9 and 10
include only proteobacterial homologues while clus-
ter 7 includes only actinobacterial proteins. Although
some of these clusters include proteins that roughly
follow the 16S RNA phylogenies, others do not. The
former clusters may consist of orthologues serving the
same primary function. In fact, several of these clusters
may consist of proteins that are orthologous to each
Va lu e
Alignment Position
0.5
1.5
1
0
1
100 200 300 400 500
A
B
-0.5
-1
-1.5
1
2
3
4
5
6
7
8
9
10
Gox1
Eli1
Rba2
Ath13
Osa6
Xla2
Rno6
Dre3
Tni3
Yli3
Ago1
Kla3
Dha2
Cal2
Cgl5
Sce2
Gze2
Mgr2
Mma8
Chu2
Rso1
Rme2
Reu2
Msp2
Cef3
Cdi2
Pac1
Nfa3
Sav1
Kra4
Ccr1
Nar2
Sfl2
Eco2
Sen3
Sty1
Plu1
Eca1
Yps1
Ype1
Cvi2
Bfu2
Bps4
Bce9
Bvi2
Bbr1
Bpa2
Pae1
Pfl2
Ppu1
Xca1
Xor1
Xax1
Mlo1
Atu2
Sme1
Bsu3
Bab2
Bme2
Asp5
1
2
3
4
5
6
7
8
9
10
Fig. 6. (A) Average hydropathy (top) and similarity (bottom) plots for the UNK family. (B) Phylogenetic tree for the UNK family proteins. The
list of proteins and the multiple alignment upon which these plots were based can be found in Table S6 and Fig. S6A on our website,
respectively. The bootstrapped trees are shown in Figs S6B and S6C. The parsimony tree is shown in Fig. S6D.
N. M. Mansour et al. The BART superfamily
FEBS Journal 274 (2007) 612–629 ª 2007 The Authors Journal compilation ª 2007 FEBS 623
other. This suggestion arises from the observation that
each of the proteobacterial clusters derives from a dif-
ferent subclass: cluster 6 is b-proteobacterial, cluster 8
is a-proteobacterial, and cluster 9 is c-proteobacterial.
However, cluster 10 consists of a-, b- and c-proteobac-
terial proteins. While the a-proteobacterial proteins
cluster together in a single subcluster, as do the b-pro-
teobacterial proteins, the c-proteobacterial proteins of
cluster 10 fall into two subclusters, one for the Pseudo-
monads and one for the Xanthomonads. These two
c-proteobacterial genuses are known to be distantly
related to each other.
Motif similarities among all 10 TMS homologues
The C-terminal regions of the consensus sequences
of TMSs 4 in the three 10 TMS families showed simi-
larities as follows:
BASS: Hy S F L A L G DV
ACR3: WSX Hy A X G DP
UNK: FTS Hy A K G NV
The same was observed for the homologous TMS 9s
in these three families of 10 TMS proteins:
BASS: E Hy AHyA Hy S Hy F
ACR3: G Hy PMA XHyHy F
UNK: Q N GLA Hy Hy Hy Hy
Limited similarity between TMSs 4 and 9 is also
apparent.
Homology of the 5 and 10 TMS proteins as well
as the first and second repeat units in the
10 TMS proteins
The gap and ic programs [4,5] were used to establish
homology between the 5 and 10 TMS proteins. Fig-
ure 7 shows an alignment of the sequence of a 5 TMS
protein with that of the first 5 TMSs of a 10 TMS pro-
tein. This alignment exhibits 30.4% identity and
42.2% similarity with a comparison score of 9.1 SD.
This value is sufficient to establish homology [1].
Because all 5 TMS proteins are homologous to each
other throughout their 5 TMS hydrophobic domains,
and all 10 TMS proteins are homologous to each other
throughout their 10 TMS hydrophobic domains,
according to the superfamily principle, this establishes
that all 5 TMS proteins are homologous to the
N-terminal repeat units of all 10 TMS proteins [1].
Figure 8 shows an alignment of one of the first repeat
units of a 10 TMS protein with the second repeat unit
of another 10 TMS protein. This alignment shows
26.4% identity and 32.6% similarity with a comparison
score of 9.5 SD. This last value is sufficient to establish
homology [1]. The six families described above as well
as the two repeat units of the 10 TMS proteins are
therefore derived from a single ancestral sequence, and
consequently, they comprise a single superfamily.
Discussion
In addition to defining the phylogenetic and structural
properties of the two previously recognized families
(BASS and Acr3), and the newly discovered 5 TMS
transport protein family (RFT), we discovered three
additional families of the BART superfamily with no
functionally characterized members. One (UNK)
includes members that look like typical 10 TMS por-
ters. The second (SHK) proved to be a coherent family
of structurally similar proteins with an N-terminal
6 TMS transporter domain with TMSs 2–6 being
homologous to the 5 TMS element that characterizes
all members of the BART superfamily. Because the
C-termini of these proteins must be present in the
cytoplasm, this suggests that the additional N-ter-
minal TMSs probably have their N-termini in the cyto-
plasm. If so, the conserved 5 TMS unit goes from out
to in. This would suggest that members of the RFT
family, with 5 putative TMSs, may also have their
N-termini outside and their C-termini inside. Because
the 5 TMS transporters show greatest sequence simi-
larity with the first N-terminal repeat units in the
10 TMS homologues, we suggest that these proteins
also display their N- and C-termini outside and their
central loops inside. These predictions were confirmed
when we conducted charge distribution studies (data
not presented). The positive inside rule [55–57] has
provided valid predictions for transport protein topol-
ogy. Its application to members of the six families of
the BART superfamily confirmed the topological sug-
gestions made above.
Interesting questions arise regarding the mechanism
of sensory detection and transmission in the SHK fam-
ily. For example, does the N-terminal porter domain
actually catalyze transport, or has it evolved into a
binding receptor specific for some extracellular solute?
Precedence for the latter event has been noted for a
few other superfamilies of transporters where transpor-
ter homologues serve as receptors, either while retain-
ing their transport function, or while losing it [3,58–
63]. In a few members of the sodium:solute symporter
superfamily, full-length transporter domains are fused
to sensor kinase domains [3]. As for the SHK family,
it is not known if the transporter domain is active as a
transporter, or if it functions exclusively as a receptor.
It could, of course, possess neither function and merely
The BART superfamily N. M. Mansour et al.
624 FEBS Journal 274 (2007) 612–629 ª 2007 The Authors Journal compilation ª 2007 FEBS
serve as an anchor. We tend to discount this last possi-
bility because these proteins show residue conservation
that suggests a more specific catalytic function.
If members of the SHK family are transporters, sev-
eral possibilities can be entertained. First, transport
function might be completely independent of the sensor
kinase activity. Second, passage of the extracellular lig-
and through the membrane could actually be the sensed
event that activates or inhibits the sensor kinase as in
the case of phosphoryl transfer-dependent regulation
via the E. coli phosphoenolpyruvate-dependent phos-
photransferase system [64,65]. Third, the N-terminal
domain might be both a sensor and a transporter, act-
ing on the same ligand, but with the sensor function
independent of the transport function. In this case,
sensing would only require binding of the ligand to the
outside. Such a scenario has been documented in the
E. coli phosphate-specific ABC transporter which inter-
acts noncovalently with a sensor kinase (PhoR) to influ-
ence its activity [66]. Fusion of the transporter domain
to the sensor kinase domain suggests a close functional
relationship between the two domains [58,67–69].
The last family within the BART superfamily, the
KPSH family, consists of four proteins, all with N-ter-
minal 6 TMS transporter domains, but with various
C-terminal catalytic and noncatalytic domains arranged
in differing orders. The catalytic domains can be sensor
kinase, phosphatase, cyclic di-GMP synthetase and ⁄ or
cyclic di-GMP hydrolase domains. These four proteins
are distantly related to each other, and may in fact,
prove to belong to different families when additional
sequence data become available. However, with regards
to the mechanisms of signal transduction and regulatory
control of the catalytic domains, all of the possibilities
and arguments considered above for the SHK family
could be applicable. These proteins also possess a
variety of noncatalytic domains that undoubtedly have
subfunctions that facilitate signal transduction via
protein–protein interactions and subcellular compart-
mentation [70–72]. The work described here thus serves
Fig. 7. Alignment of TMSs 1–5 of the
5 TMS protein, Bsu1 (YpaA) from Bacillus
subtilis (gi 16679362), with the first repeat
unit (TMSs 1–5) of the 10 TMS protein,
Ade1 from Anaeromyxobacter dehalogenans
(gi 66854425). The
GAP program with default
settings and 500 random shuffles gave
30.4% identity, 42.2% similarity and a com-
parison score of 9.1 SD. Vertical lines, iden-
tities; vertical dots, similarities as defined by
the
GAP program. Numbers at the beginning
and end of each line refer to the residue
numbers of the two proteins.
Fig. 8. Alignment of the first repeat unit
(TMSs 1–5) of the 10 TMS protein, Bli4 of
Brevibacterium linens (gi 62424343) with
the second repeat unit (TMSs 6–10) of
another 10 TMS protein, Bce9 of Burkholde-
ria cepacia (gi 46314941). This alignment
gave 26.4% identity, 32.6% similarity and a
comparison score of 9.5 SD. The convention
of presentation is as for Fig. 7.
N. M. Mansour et al. The BART superfamily
FEBS Journal 274 (2007) 612–629 ª 2007 The Authors Journal compilation ª 2007 FEBS 625
as the starting point for the elucidation of novel regula-
tory mechanisms that may differ in detail, or even in
principle from any such mechanism currently recognized.
Computer methods
Computer methods used in this study were as reported
previously [1,2,72,73]. PSI-BLAST searches (e-value
£ 10
)4
) of the NCBI protein database were carried out
with protein sequences in TCDB or the YpaA protein
of B. subtilis as the query sequence [74]. Redundant
sequences were eliminated using an unpublished pro-
gram [S Singhi and MH Saier Jr, unpublished]. The
clustal x program [20] and the tree program [75]
were used for multiple alignments of homologous
sequences and construction of a phylogenetic tree with
the aid of the blosum30 scoring matrix and the tree-
view drawing program [21]. Other programs (e.g.
paup) and algorithms (neighbor joining and parsi-
mony) were used to confirm these results [76]. Family
assignments were based upon phylogenetic results and
the statistical analyses obtained with the gap and ic
programs [4,5]. The standard for establishing homol-
ogy between two proteins is nine standard deviations
for regions of at least 60 residues that are compared
with the gap program, using 500 random shuffles with
a gap opening penalty of eight and a gap extension
penalty of two [1]. Sequence comparisons between
multiple homologues were conducted using the ic pro-
gram [5], and individual pairs of protein sequences
were compared using the gap program [4]. The TMs
split program [77] was used to generate fragmented
protein sequences used for detection of internal repeats
using the ic [5], gap [4], and TMs-align [77] pro-
grams. The TMhmm [78], hmmtop [31], and what [19]
programs were used to estimate the topology of indi-
vidual membrane proteins. The avehas program [79]
was used for plotting the average hydropathy, similar-
ity and amphipathicity as a function of alignment posi-
tion for each family after aligning the sequences with
the clustal x program [20]. Other more specific meth-
ods are described with references in the text.
Acknowledgements
This work was supported by NIH grant GM077402.
We thank Mary Beth Hiller for her assistance in the
preparation of this manuscript.
References
1 Saier MH Jr (1994) Computer-aided analyses of trans-
port protein sequences: gleaning evidence concerning
function, structure, biogenesis, and evolution. Microbiol
Rev 58, 71–93.
2 Saier MH Jr (2000) A functional-phylogenetic classifica-
tion system for transmembrane solute transporters.
Microbiol Mol Biol Rev 64, 354–411.
3 Busch W & Saier MH Jr (2002) The transporter classifi-
cation (TC) system, 2002. Crit Rev Biochem Mol Biol
37, 287–337.
4 Devereux J, Haeberli P & Smithies O (1984) A compre-
hensive set of sequence analysis programs for the VAX.
Nucleic Acids Res 12, 387–395.
5 Zhai Y & Saier MH Jr (2002) A simple sensitive pro-
gram for detecting internal repeats in sets of multiply
aligned homologous proteins. J Mol Microbiol
Biotechnol 4, 29–31.
6 Chang AB, Lin R, Studley WK, Tran CV & Saier MH
Jr (2004) Phylogeny as a guide to structure and function
of membrane transport proteins. Mol Membr Biol 21,
171–181.
7 Anantha RP, McVeigh AL, Lee LH, Agnew MK,
Cassels FJ, Scott DA, Whittam TS & Savarino SJ
(2004) Evolutionary and functional relationships of
colonization factor antigen i and other class 5 adhesive
fimbriae of enterotoxigenic Escherichia coli. Infect
Immun 72, 7190–7201.
8 Girardeau JP, Bertin Y & Callebaut I (2000) Conserved
structural features in class I major fimbrial subunits
(Pilin) in gram-negative bacteria. Molecular basis of
classification in seven subfamilies and identification of
intrasubfamily sequence signature motifs which might
be implicated in quaternary structure. J Mol Evol 50,
424–442.
9 Latiff K, Meanger J, Mills J & Ghildyal R (2004)
Sequence and structure relatedness of matrix protein of
human respiratory syncytial virus with matrix proteins
of other negative-sense RNA viruses. Clin Microbiol
Infect 10, 945–948.
10 Lau AY & Chasman DI (2004) Functional classification
of proteins and protein variants. Proc Natl Acad Sci
USA 101, 6576–6581.
11 Yount NY & Yeaman MR (2006) Structural congruence
among membrane-active host defense polypeptides
of diverse phylogeny. Biochim Biophys Acta 1758,
1373–1386.
12 Saier MH Jr (2003) Answering fundamental questions
in biology with bioinformatics. ASM News 69, 175–
181.
13 Saier MH Jr (2003) Tracing pathways of transport
protein evolution. Mol Microbiol 48, 1145–1156.
14 Dayhoff MO, Barker WC & Hunt LT (1983) Establish-
ing homologies in protein sequences. Methods Enzymol
91, 524–545.
15 Saier MH Jr, Eng BH, Fard S, Garg J, Haggerty DA,
Hutchinson WJ, Jack DL, Lai EC, Liu HJ, Nusinew
DP, et al. (1999) Phylogenetic characterization of novel
The BART superfamily N. M. Mansour et al.
626 FEBS Journal 274 (2007) 612–629 ª 2007 The Authors Journal compilation ª 2007 FEBS
transport protein families revealed by genome analyses.
Biochim Biophys Acta 1422, 1–56.
16 Burgess CM, Slotboom DJ, Geertsma ER, Duurkens
RH, Poolman B & van Sinderen D (2006) The ribofla-
vin transporter RibU in Lactococcus lactis: molecular
characterization of gene expression and the transport
mechanism. J Bacteriol 188, 2752–2760.
17 Anantharaman V & Aravind L (2003) Application of
comparative genomics in the identification and analysis
of novel families of membrane-associated receptors in
bacteria. BMC Genomics 4, 34.
18 Altschul SF, Gish W, Miller W, Myers EW & Lipman
DJ (1990) Basic local alignment search tool. J Mol Biol
215, 403–410.
19 Zhai Y & Saier MH Jr (2001) A web-based program
(WHAT) for the simultaneous prediction of hydropathy,
amphipathicity, secondary structure and transmembrane
topology for a single protein sequence. J Mol Microbiol
Biotechnol 3, 501–502.
20 Thompson JD, Gibson TJ, Plewniak F, Jeanmougin F
& Higgins DG (1997) The CLUSTAL–windows inter-
face: Flexible strategies for multiple sequence alignment
aided by quality analysis tools. Nucleic Acids Res 25,
4876–4882.
21 Zhai Y, Tchieu J & Saier MH Jr (2002) A web-based
Tree View (TV) program for the visualization of phylo-
genetic trees. J Mol Microbiol Biotechnol 4, 69–70.
22 Chung YJ, Krueger C, Metzgar D & Saier MH Jr
(2001) Size comparisons among integral membrane
transport protein homologues in bacteria, archaea, and
eucarya. J Bacteriol 183, 1012–1021.
23 Kramer W, Girbig F, Glombik H, Corsiero D, Stenge-
lin S & Weyland C (2001) Identification of a ligand-
binding site in the Na
+
⁄ bile acid cotransporting protein
from rabbit ileum. J Biol Chem 276, 36020–36027.
24 Weinman SA, Carruth MW & Dawson PA (1998) Bile
acid uptake via the human apical sodium-bile acid
cotransporter is electrogenic. J Biol Chem 273, 34691–
34695.
25 Saier MH Jr, Tran CV & Barabote RD (2006) TCDB:
The transporter classification database for membrane
transport protein analyses and information. Nucleic
Acids Res 34, D181–D186 (Database issue).
26 Guan L & Kaback HR (2006) Lessons from lactose per-
mease. Annu Rev Biophys Biomol Struct 35, 67–91.
27 Kaback HR & Wu J (1997) From membrane to mole-
cule to the third amino acid from the left with a mem-
brane transport protein. Q Rev Biophys 30, 333–364.
28 Pao GM, Wu L-F, Johnson KD, Ho
¨
fte H, Chrispeels
MJ, Sweet G, Sandal NN & Saier MH Jr (1991) Evolu-
tion of the MIP family of integral membrane transport
proteins. Mol Microbiol 5, 33–37.
29 Park JH & Saier MH Jr (1996) Phylogenetic characteri-
zation of the MIP family of transmembrane channel
proteins. J Membr Biol 15, 171–180.
30 Reizer J, Reizer A & Saier MH Jr (1993) The MIP
family of integral membrane channel proteins: sequence
comparisons, evolutionary relationships, reconstructed
pathway of evolution, and proposed functional differen-
tiation of the two repeated halves of the proteins. Crit
Rev Biochem Mol Biol 28, 235–257.
31 Tusnady GE & Simon I (2001) The HMMTOP trans-
membrane topology prediction server. Bioinformatics 17,
849–850.
32 Galperin MY (2004) Bacterial signal transduction net-
work in a genomic perspective. Environ Microbiol 6,
552–567.
33 Mittenhuber G (2002) A phylogenomic study of the
general stress response sigma factor r
B
of Bacillus sub-
tilis and its regulatory proteins. J Mol Microbiol
Biotechnol 4, 427–452.
34 Taylor BL & Zhulin IB (1999) PAS domains: internal
sensors of oxygen, redox potential, and light. Microbiol
Mol Biol Rev 63, 479–506.
35 Taylor BL, Rebbapragada A & Johnson MS (2001) The
FAD-PAS domain as a sensor for behavioral responses
in Escherichia coli. Antioxid Redox Signal 3, 867–879.
36 D’Argenio DA & Miller SI (2004) Cyclic di-GMP as a
bacterial second messenger. Microbiology 150, 2497–2502.
37 Jenal U (2004) Cyclic di-guanosine-monophosphate
comes of age: a novel secondary messenger involved in
modulating cell surface structures in bacteria? Curr Opin
Microbiol 7, 185–191.
38 Simm R, Fetherston JD, Kader A, Romling U & Perry
RD (2005) Phenotypic convergence mediated by
GGDEF-domain-containing proteins. J Bacteriol 187,
6816–6823.
39 Brunsing RL, La Clair C, Tang S, Chiang C, Hancock
LE, Perego M & Hoch JA (2005) Characterization of
sporulation histidine kinases of Bacillus anthracis.
J Bacteriol 187, 6972–6981.
40 Mittenhuber G (2002) An inventory of genes encoding
RNA polymerase sigma factors in 31 completely
sequenced eubacterial genomes. J Mol Microbiol Bio-
technol 4, 77–91. (Erratum in J Mol Microbiol
Biotechnol 4, 514.)
41 Lioliou EE & Kyriakidis DA (2004) The role of bacter-
ial antizyme: From an inhibitory protein to AtoC tran-
scriptional regulator. Microb Cell Fact 3, 8–17.
42 Reizer J, Reizer A & Saier MH Jr (1994) A functional
superfamily of sodium ⁄ solute symporters. Biochim
Biophys Acta 1197, 133–166.
43 Hagenbuch B (1997) Molecular properties of hepatic
uptake systems for bile acids and organic acids. J Membr
Biol 160, 1–8.
44 Ho RH, Leake BF, Roberts RL, Lee W & Kim RB
(2004) Ethnicity-dependent polymorphism in Na
+
-tauro-
cholate cotransporting polypeptide (SLC10A1) reveals a
domain critical for bile acid substrate recognition. J Biol
Chem 279, 7213–7222.
FEBS Journal 274 (2007) 612–629 ª 2007 The Authors Journal compilation ª 2007 FEBS 627
N. M. Mansour et al. The BART superfamily
45 Sun A-Q, Balasubramaniyan N, Liu C-J, Shahid M &
Suchy FJ (2004) Association of the 16-kDa subunit c of
vacuolar proton pump with the ileal Na
+
-dependent bile
acid transporter. Protein–protein interaction and intra-
cellular trafficking. J Biol Chem 279, 16295–16300.
46 McConkey M, Gillin H, Webster CRL & Anwer MS
(2004) Cross-talk between protein kinases Cf and B in
cyclic AMP-mediated sodium taurocholate co-transport-
ing polypeptide translocation in hepatocytes. J Biol
Chem 279, 20882–20888.
47 Webster CR, Blanch CJ, Phillips J & Anwer MS (2000)
Cell swelling-induced translocation of rat liver
Na
+
⁄ taurocholate cotransport polypeptide is mediated
via the phosphoinositide 3-kinase signaling pathway.
J Biol Chem 275, 29754–29760.
48 Sun A-Q, Arrese MA, Zeng L, Swaby I, Zhou M-M &
Suchy FJ (2001) The rat liver Na
+
⁄ bile acid cotrans-
porter: importance of the cytoplasmic tail to function
and plasma membrane targeting. J Biol Chem 276,
6825–6833.
49 Sun A-Q, Salkar R, Sachchidanand, Xu S, Zen L, Zhou
M-M & Suchy FJ (2003) A 14-amino acid sequence
with a b-turn structure is required for apical membrane
sorting of the rat ileal bile acid transporter. J Biol Chem
278, 4000–4009.
50 Wysocki R, Bobrowicz P & Ulaszewski S (1997) The
Saccharomyces cerevisiae ACR3 gene encodes a putative
membrane protein involved in arsenite transport. J Biol
Chem 272, 30061–30066.
51 Sato T & Kobayashi Y (1998) The ars operon in the
skin element of Bacillus subtilis confers resistance to
arsenate and arsenite. J Bacteriol 180, 1655–1661.
52 Paiment A, Hocking J & Whitfield C (2002) Impact of
phosphorylation of specific residues in the tyrosine auto-
kinase, Wzc, on its activity in assembly of group 1 cap-
sules in Escherichia coli. J Bacteriol 184, 6437–6447.
53 Vincent C, Doublet P, Grangeasse C, Vaganay E,
Cozzone AJ & Duclos B (1999) Cells of Escherichia coli
contain a protein-tyrosine kinase, Wzc, and a phospho-
tyrosine-protein phosphatase, Wzb. J Bacteriol 181,
3472–3477.
54 Vincent C, Duclos B, Grangeasse C, Vaganay E, Riber-
ty M, Cozzone AJ & Doublet P (2000) Relationship
between exopolysaccharide production and protein-tyro-
sine phosphorylation in gram-negative bacteria. J Mol
Biol 304, 311–321.
55 Sipos L & von Heijne G (1993) Predicting the topology
of eukaryotic membrane proteins. Eur J Biochem 213,
1333–1340.
56 von Heijne G (1986) Net N-C charge imbalance may be
important for signal sequence function in bacteria.
J Mol Biol 192, 287–290.
57 von Heijne G & Gavel Y (1988) Topogenic signals in
integral membrane proteins. Eur J Biochem 174,
671–678.
58 Saier MH Jr, Hvorup RN & Barabote RD (2005) Evo-
lution of the bacterial phosphotransferase system: from
carriers and enzymes to group translocators. Biochem
Soc Trans 33, 220–224.
59 Saier MH Jr (2000) Families of transmembrane sugar
transport proteins. Mol Microbiol 35, 699–710.
60 Saier MH Jr (2000) Families of transmembrane trans-
porters selective for amino acids and their derivatives.
Microbiology 146, 1775–1795.
61 Saier MH Jr (2000) Vectorial metabolism and the
evolution of transport systems. J Bacteriol 182, 5029–
5035.
62 Saier MH Jr (2001) Evolution of transport proteins. In
Genetic Engineering. Principles and Methods, Vol. 23
(Setlow JK, ed.) pp. 1–10. Kluwer Academic ⁄ Plenum
Press, New York.
63 Saier MH Jr & Tseng T-T (1999) Evolutionary origins
of transmembrane transport systems. In Transport of
Molecules Across Microbial Membranes, Symposium, 58,
Society for General Microbiology (Broome-Smith JK,
Baumberg S, Stirling CJ & Ward FB, eds) pp. 252–274.
Cambridge University Press, Cambridge, UK.
64 Barabote RD & Saier MH Jr (2005) Comparative geno-
mic analyses of the bacterial phosphotransferase system
(PTS). Microbiol Mol Biol Rev 69, 608–634.
65 Saier MH Jr (1989) Protein phosphorylation and allos-
teric control of inducer exclusion and catabolite repres-
sion by the bacterial phosphoenolpyruvate: sugar
phosphotransferase system. Microbiol Rev 53, 109–120.
66 Wanner BL (1993) Gene regulation by phosphate in
enteric bacteria. J Cell Biochem 51, 47–54.
67 Harvat EM, Zhang YM, Tran CV, Zhang Z, Frank
MW, Rock CO & Saier MH Jr (2005) Lysophospholi-
pid flipping across the Escherichia coli inner membrane
catalyzed by a transporter (LplT) belonging to the
major facilitator superfamily. J Biol Chem 280, 12028–
12034.
68 Hvorup RN, Chang AB & Saier MH Jr (2003) Bioinfor-
matic analyses of homologues of the bacterial 1-ascor-
bate PTS permeases. J Mol Microbiol Biotechnol 6,
191–205.
69 von Rozycki T, Yen M-R & Saier MH Jr (2004) The
YedZ family: Possible heme binding proteins that can
be fused to transporters and electron carriers. J Mol
Microbiol Biotechnol 8, 129–140.
70 Felce J & Saier MH Jr (2004) Carbonic anhydrases
fused to anion transporters of the SulP family: evidence
for a novel type of bicarbonate transporter. J Mol
Microbiol Biotechnol 8, 169–176.
71 Reizer J & Saier MH Jr (1997) Modular multidomain
phosphoryl transfer proteins of bacteria. Curr Opin
Struc Biol 7, 407–415.
72 Barabote RD, Tamang DG, Abeywardena SN, Fallah
NS, Fu JYC, Lio JK, Mirhosseini P, Pezeshk R, Podell
S, Salampessy ML, Thever MD & Saier MH Jr (2006)
628 FEBS Journal 274 (2007) 612–629 ª 2007 The Authors Journal compilation ª 2007 FEBS
The BART superfamily N. M. Mansour et al.
Extra domains in secondary transport carriers. Biochim
Biophys Acta 1758, 1557–1579.
73 von Rozycki T, Schultzel M & Saier MH Jr (2004)
Sequence analyses of cyanobacterial bicarbonate trans-
porters and their homologues. J Mol Microbiol Biotech-
nol 7, 102–108.
74 Altschul SF, Madden TL, Scha
¨
ffer AA, Zhang J, Zhang
Z, Miller W & Lipman DJ (1997) Gapped BLAST and
PSI-BLAST: a new generation of protein database
search programs. Nucleic Acids Res 25, 3389–3402.
75 Feng D-F & Doolittle RF (1990) Progressive alignment
and phylogenetic tree construction of protein sequences.
Methods Enzymol 183, 375–387.
76 Swofford DL (2002) Phylogenetic Analysis Using Parsi-
mony (PAUP), Version 4.0b. t.
fsu.edu
77 Zhou X, Yang NM, Tran CV, Hvorup RN & Saier
MH Jr (2003) Web-based programs for the display and
analysis of transmembrane a-helices in aligned protein
sequences. J Mol Microbiol Biotechnol 5, 1–6.
78 Krogh A, Larsson B, von Heijne G & Sonnhammer E
(2001) Predicting transmembrane protein topology with
a hidden Markov model. Application to complete gen-
omes. J Mol Biol 305, 567–580.
79 Zhai Y & Saier MH Jr (2001) A web-based program for
the prediction of average hydropathy, average amphi-
pathicity and average similarity of multiply aligned
homologous proteins. J Mol Microbiol Biotechnol 3,
285–286.
Supplementary material
The following supplementary material is available
online:
Table S1. Proteins of the RFT family.
Table S2. Proteins of the SHK family.
Table S3. Proteins of the KPSH family.
Table S4. Proteins of the BASS family.
Table S5. Proteins of the ACR3 family.
Table S6. Proteins of the UNK family.
Fig. S1. (A) Multiple alignment of RFT family. (B)
clustalx generated neighbor-joining tree with boot-
strapping for RFT family. (C) Paup distance with
neighbor-joining tree for RFT family. (D) Paup parsi-
mony tree for RFT family.
Fig. S2. (A) Multiple alignment of SHK family. (B)
clustalx generated neighbor-joining tree with boot-
strapping for SHK family. (C) Paup distance with
neighbor-joining tree for SHK family. (D) Paup parsi-
mony tree for SHK family.
Fig. S3. (A) Multiple alignment of KPSH family. (B)
clustalx generated neighbor-joining tree with boot-
strapping for KPSH family. (C) Paup distance with
neighbor-joining tree for KPSH family. (D) Paup par-
simony tree for KPSH family.
Fig. S4. (A) Multiple alignment of BASS family. (B)
clustalx generated neighbor-joining tree with boot-
strapping for BASS family. (C) Paup distance with
neighbor-joining tree for BASS family. (D) Paup parsi-
mony tree for BASS family.
Fig. S5. (A) Multiple alignment of ACR3 family. (B)
clustalx generated neighbor-joining tree with boot-
strapping for ACR3 family. (C) Paup distance with
neighbor-joining tree for ACR3 family. (D) Paup par-
simony tree for ACR3 family.
Fig. S6. (A) Multiple alignment of UNK family. (B)
clustalx generated neighbor-joining tree with boot-
strapping for UNK family. (C) Paup distance with
neighbor-joining tree for UNK family. (D) Paup parsi-
mony tree for UNK family.
This material is available from the author’s website
at />Please note: Blackwell Publishing is not responsible
for the content or functionality of any supplementary
materials supplied by the authors. Any queries (other
than missing material) should be directed to the corres-
ponding author for the article.
FEBS Journal 274 (2007) 612–629 ª 2007 The Authors Journal compilation ª 2007 FEBS 629
N. M. Mansour et al. The BART superfamily