Báo cáo khoa học: Synechocystis DrgA protein functioning as nitroreductase and ferric reductase is capable of catalyzing the Fenton reaction potx
Bạn đang xem bản rút gọn của tài liệu. Xem và tải ngay bản đầy đủ của tài liệu tại đây (206.36 KB, 10 trang )
Synechocystis DrgA protein functioning as nitroreductase
and ferric reductase is capable of catalyzing the Fenton
reaction
Kouji Takeda
1
, Mayumi Iizuka
1
, Toshihiro Watanabe
2
, Junichi Nakagawa
1
, Shinji Kawasaki
1
and
Youichi Niimura
1
1 Department of Bioscience, Tokyo University of Agriculture, Japan
2 Department of Food science and Technology, Tokyo University of Agriculture, Japan
Oxygen is a double-edged sword in that it is essential
for any aerobic organisms, but a part of it is conver-
ted to reactive oxygen species (ROS), which could kill
the cells. Among such ROS, the hydroxyl radical is
the most cytotoxic agent, being generated via the Fen-
ton reaction from hydrogen peroxide. The Fenton
reaction is a collective designation for the reaction in
which hydrogen peroxide is reduced univalently
through the transfer of an electron in the presence of
Fe
2+
to produce an hydroxyl radical. It is thought
that most of intracellular iron exists as Fe
3+
in order
not to trigger the Fenton reaction. Therefore, when
the Fenton reaction occurs, the Fe
3+
must be reduced
to Fe
2+
. In some in vitro Fenton systems, superoxide
was shown to be capable of reducing free iron [1–3].
However, it is not likely that intracellular concentra-
tion of superoxide is high enough to contribute in that
way [4,5]. Other candidate reductants, such as thiols,
a-ketoacids, and NAD(P)H, are all abundant inside
cells, and each of these can reduce Fe
3+
in vitro [6–8].
However it is still impossible to conclude that these
candidates would function as predominant reductants
in vivo. Under exceptional pressure to the cells, Wood-
mansee and Imlay [9] demonstrated that in Escheri-
chia coli, the Fenton reaction takes place through
reduction of Fe
3+
by the reduced free flavin generated
Keywords
DrgA; Fenton reaction; flavin reductase;
iron(III) reductase; nitroreductase
Correspondence
K. Takeda, The Department of Bioscience,
Tokyo University of Agriculture, 1-1-1
Sakuragaoka, Setagaya-ku, Tokyo 156–8502,
Japan
Fax ⁄ Tel: +81 3 54772764
E-mail:
(Received 19 November 2006, revised 31
December 2006, accepted 8 January 2007)
doi:10.1111/j.1742-4658.2007.05680.x
In order to identify an enzyme capable of Fenton reaction in Synechocystis ,
we purified an enzyme catalyzing one-electron reduction of t-butyl hydro-
peroxide in the presence of FAD and Fe(III)-EDTA. The enzyme was a
26 kDa protein, and its N-terminal amino acid sequencing revealed it to be
DrgA protein previously reported as quinone reductase [Matsuo M, Endo
T and Asada K (1998) Plant Cell Physiol 39, 751–755]. The DrgA protein
exhibited potent quinone reductase activity and, furthermore, we newly
found that it contained FMN and highly catalyzed nitroreductase, flavin
reductase and ferric reductase activities. This is the first demonstration of
nitroreductase activity of DrgA protein previously identified by a drgA
mutant phenotype. DrgA protein strongly catalyzed the Fenton reaction in
the presence of synthetic chelate compounds, but did so poorly in the pres-
ence of natural chelate compounds. Its ferric reductase activity was
observed with both natural and synthetic chelate compounds with a better
efficiency with the latter. In addition to small molecular-weight chemical
chelators, an iron transporter protein, transferrin, and an iron storage pro-
tein, ferritin, turned out to be substrates of the DrgA protein, suggesting it
might play a role in iron metabolism under physiological conditions and
possibly catalyze the Fenton reaction under hyper-reductive conditions in
this microorganism.
Abbreviations
ROS, reactive oxygen species.
1318 FEBS Journal 274 (2007) 1318–1327 ª 2007 Tokyo University of Agriculture Journal compilation ª 2007 FEBS
by flavin reductase in a hyper-reductive environment
when respiration is blocked in the bacteria. In this
process, electrons are transferred from the enlarged
NADH pools to FAD, from FADH
2
to iron, and
finally from iron to H
2
O
2
.
In photosynthetic organisms, excess light energy
over the utilizing capacity leads to generation of ROS.
Especially under high-intensity light and other stresses,
intercellular ROS accumulation tends to occur, but an
antioxidant protection system usually exists to counter-
act it [10–15]. Whether the Fenton reaction is involved
in the production of ROS during photosynthesis as
demonstrated in E. coli is an open question.
In this study we investigated the Fenton reaction in
Synechocystis sp. PCC6803, a prokaryote capable of
photosynthesis and categorized as an oxygenic photo-
synthetic bacterium. From cell-free extracts, we puri-
fied an enzyme catalyzing one-electron reduction of
t-butyl hydroperoxide in the presence of FAD and
Fe(III)-EDTA. The enzyme turned out to be DrgA
protein and its catalytic activities for ferric reductase,
nitroreductase and flavin reductase were demonstrated.
Enzyme characterization and its possible involvement
in the Fenton reaction will be presented.
Results
Cell free NAD(P)H oxidoreductase activity driving
the Fenton reaction
We examined the Fenton reaction by measuring t-butyl
hydroperoxide reducing activity using cell-fee extracts
after dialysis, NADH or NADPH (as electron donor),
FAD or FMN (as free flavin), and FeCl
3
or Fe(III)-
EDTA (as iron compounds). In Fenton reactions using
the cell-free extracts prepared after dialysis supplemen-
ted with NADH and NADPH, we detected lower
activity with FeCl
3
than with Fe(III)-EDTA in the
presence or absence of free flavin. We detected the
highest Fenton activity with NADPH and Fe(III)-
EDTA, while a marked potentiation by flavin was
observed when using NADH and Fe(III)-EDTA
(Table 1).
Although the enzyme system in E. coli proposed by
Woodmansee and Imlay [9] required free flavin for
activation, in Synechocystis, there are flavin-dependent
and flavin-independent systems. In the Fenton reaction
with NADH using Synechocystis cell-free extracts pre-
pared prior to dialysis, we detected high activity in the
presence of Fe(III)-EDTA, but this was not further po-
tentiated by addition of free flavin (supplementary
Table S1). We attributed this to free flavin contained
in the cell-free extracts.
Purification of the NAD(P)H oxidoreductase
responsible for the Fenton reaction associated
with free flavin
In an attempt to identify the presumed enzyme in the
presence of the Fenton reaction, we purified an enzyme
catalyzing flavin-dependent peroxide-reducing activity
using t-butyl hydroperoxide. The purification proce-
dure was described in Experimental procedures. The
purified protein showed a single protein band of
26 kDa on a SDS ⁄ PAGE gel (supplementary Fig. S1).
The N-terminal amino acid sequence was determined
to be MDTFDAIYQRRSVKHFDPDH, and it turned
out to be identical to that of DrgA protein [16].
The purification procedure, as described in the
Experimental procedures section, gave a yield of 51%
in the terms of t-butyl hydroperoxide reducing activity
(Table 2).
Characterization of DrgA protein
Identification of FMN contained in DrgA protein
The amino acid sequence predicted from the DNA
sequence of the drgA gene displayed sequence homolo-
gies to several bacterial flavoproteins [17–22]. Several
highly FMN-binding regions (at positions 10–14 and
148–151) have been identified in the amino acid
sequences of DrgA. Both endogenous and recombinant
DrgA protein exhibited an absorption spectrum typical
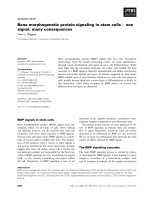
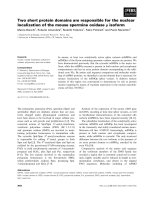
of a flavoprotein (Fig. 1 at 459 nm, arrow). Further-
more, by HPLC analysis, the flavin coenzyme released
from native DrgA protein by hot methanol treatment
[23] was identified as FMN (data not shown). The
Table 1. NAD(P)H oxidoreductase activities responsible for Fenton
reaction in the dialyzed cell-free extracts. The activity was deter-
mined following absorbance of NAD(P)H oxidation at 340 nm in a
50 m
M sodium phosphate buffer (pH 7.0) at 30 °C. The reaction
mixture contained 100 l
M Fe(III)-EDTA, 15 lM flavin and 1 mM t-bu-
tyl hydroperoxide. Specific activity is expressed as enzyme activity
per mg of total protein. ND, not detected.
NAD(P)H oxidoreductase activities responsible
for Fenton reaction (mU ⁄ mg protein)
FAD FMN No addition
NADH
No addition ND ND ND
FeCl
3
ND ND ND
Fe(III)-EDTA 67.9 ± 13.9 59.1 ± 14.3 10.7 ± 3.0
NADPH
No addition ND ND ND
FeCl
3
16.8 ± 1.6 11.3 ± 0.6 ND
Fe(III)-EDTA 119.2 ± 18.4 87.2 ± 0.7 76.2 ± 13.7
K. Takeda et al. DrgA protein catalyzing the Fenton reaction
FEBS Journal 274 (2007) 1318–1327 ª 2007 Tokyo University of Agriculture Journal compilation ª 2007 FEBS 1319
recombinant DrgA protein preparation also showed a
similar absorption maximum, confirming the associ-
ation of FMN with DrgA protein. The absorption
maximum at 459 nm disappeared upon addition of
0.3 mm NADH under anaerobic conditions indicating
reduction of protein-bound FMN (Fig. 1). The ratio
of absorbance at 280 and 459 nm was 4.32 : 1 for
native DrgA protein, and 4.36 : 1 for recombinant
DrgA protein.
Substrate specificity
As summarized in Table 3, the Synechocystis DrgA
protein showed significant substrate preference to qui-
nones as previously reported by Matsuo et al. [24]. We
measured quinone reductase activity using ubiquinone
0 as substrate. In the presence of NADH, the specific
activities of endogenous Synechocystis DrgA protein
and recombinant DrgA protein were 7.03 UÆmg
)1
pro-
tein and 7.67 UÆmg
)1
protein. Those in the presence of
NADPH were 11.33 UÆmg
)1
protein and 11.98 UÆmg
)1
protein, respectively, indicating endogenous and
recombinant DrgA protein were equally potent as qui-
none reductase.
Moreover, the recombinant DrgA protein showed
substrate specificity similar to that of endogenous Syn-
echocystis DrgA protein (data not shown). Therefore,
we used recombinant DrgA protein in subsequent
experiments.
DrgA protein showed nitroreductase activity
for nitrobenzene, dinoseb and nitrofurazone, with the
highest activity for nitrofurazone.
The flavin reductase activities of DrgA protein for
FAD and FMN were 7.41 and 6.95 UÆmg
)1
protein,
respectively, in the presence of NADPH.
Ferric reductase activities and peroxide reducing
activities responsible for Fenton reaction
Reduction of iron is known to require reduced flavins
provided by flavin reductase. In the presence of free
FAD, we found ferric reductase activity of recombin-
ant DrgA protein using various iron compounds
(Table 4). The specific activity of ferric reductase of
DrgA protein for natural chelators varied between 0.1
and 2.0 UÆmg
)1
protein, and that for synthetic chela-
tors varied between 1.7 and 5.2 UÆmg
)1
protein
Surprisingly, as well as being active with small
molecular weight chemicals, DrgA protein was also
active with the iron transport protein transferrin
(1.06 UÆmg
)1
protein), and the iron storage protein
ferritin (1.74 UÆmg
)1
protein).
For measurement of the Fenton reaction we used
peroxide as substrate, and the specific activities for
natural chelators were 0.5–3.5 UÆmg
)1
protein and
those for synthetic chelators were 12.3–39.0 UÆmg
)1
protein. Thus, the activity for the Fenton reaction was
about 10 times higher for synthetic chelators than for
natural chelators.
Chemical stoichiometry of the Fenton reaction
The chemical stoichiometry of hydrogen peroxide
reducing activity of DrgA protein in the presence of
NADH and Fe(III)-EDTA was investigated. From a
mass balance, we estimated that in this enzymatic reac-
tion, 148 lm of hydrogen peroxide were reduced by
Table 2. Purification of NADH-dependent t-butyl hydroperoxide-
reducing activity responsible for the Fenton reaction. The activity
was determined following absorbance of NAD(P)H oxidation at
340 nm in a 50 m
M sodium phosphate buffer (pH 7.0) at 30 °C.
The reaction mixture contained cell-free extracts, 150 l
M NADH,
100 l
M Fe(III)-EDTA, 15 lM FAD and 1 mM t-butyl hydroperoxide.
Specific activity is expressed as enzyme activity per mg of total
protein. The cell-free extracts were prepared starting from 10 g
wet cells
Total
protein
(mg)
Total
activity
(U)
Specific
activity
(U ⁄ mg
protein)
Purification
index
Yield
(%)
Cell-free extracts 695.4 7.0 0.01 1.0 100
Butyl toyopearl 50.8 17.0 0.33 33 242.9
DEAE Sepharose 2.0 6.2 3.1 310 88.6
HQ-H 0.2 3.6 18.0 1800 51.4
0.15
0.10
0.05
0.00
300
400
500 600
Wavelength (nm)
Absorbance
Fig. 1. Absorption spectra of native, recombinant DrgA protein and
recombinant DrgA protein reduced by NADH. Absorption spectra of
the purified native (16.8 l
M; ——), recombinant DrgA protein
(23.6 l
M; ) and recombinant DrgA protein after anaerobic reduc-
tion with 0.3 m
M NADH (– – – –) in a 50 mM sodium phosphate buf-
fer, pH 7.0, at 25 °C.
DrgA protein catalyzing the Fenton reaction K. Takeda et al.
1320 FEBS Journal 274 (2007) 1318–1327 ª 2007 Tokyo University of Agriculture Journal compilation ª 2007 FEBS
consuming 84 lm of NADH, generating 148 lm of
hydroxyl radical as final product.
Collectively, the chemical stoichiometry of the reac-
tion can be formulated as follows (a one-electron
reduction):
2H
2
O
2
þ NADH þ H
þ
! 2OH
þ NAD
þ
þ 2H
2
O
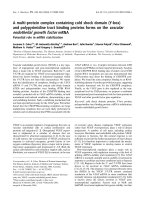
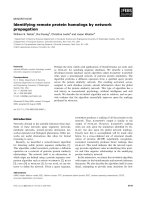
In addition, when DNA degradation was measured
using pBR322 plasmid as substrate (in the absence of
FAD), the reaction resulted in complete degradation
of the DNA (no band was detected in Fig. 2, lane V).
A partial DNA degradation was observed in the
absence of iron compound (Fig. 2, lane III).
Kinetic parameters for substrates
DrgA protein catalyzed activity for nitroreductase, fla-
vin reductase and ferric reductase. In the presence of
saturated concentration of the substrates for these
activities, namely, 50 lm nitrofurazone (nitroreduc-
tase), 30 lm FAD or FMN (flavin reductase), and
50 lm Fe(III)-EDTA in the presence and absence of
30 lm FAD (ferric reductase), we measured the K
m
values of NADH and NADPH (supplementary Table
S2). As the K
m
values for NADPH were much lower
using any substrates than those for NADH, we meas-
ured the K
m
and k
cat
values of these reactions with a
Table 3. Substrate specificity of purified DrgA protein in the pres-
ence of either NADH or NADPH. Experimental details are described
in the Experimental procedures section. Oxidation of 150 l
M NADH
or NADPH was measured in the presence of an electron acceptor.
Specific activity is expressed as enzyme activity per milligram of
purified native or recombinant DrgA protein. ND, not detected.
Electron acceptor
Enzyme activity
(UÆmg protein
)1
)
NADH NADPH
Quinone reductase
Ubiquinone 0 7.03 11.33
Duroquinone 7.44 10.60
Flavin reductase
FAD 4.70 7.41
FMN 4.60 6.95
Other related enzyme activity
Ferricyanide 0.72 0.54
Oxygen ND ND
Cytochrome C 0.14 0.13
Nitroreductase
Nitrobenzene 0.32 0.36
Dinoseb 1.08 5.77
Nitrofurazone 10.24 14.68
Table 4. Effect of different iron compounds on the ferric reductase
activities and NAD(P)H oxidoreductase activities responsible for the
Fenton reaction. Experimental details are described in the Experi-
mental procedures section. Oxidation of 150 l
M NADPH was meas-
ured at 340 nm in a reaction mixture containing Fe(III) complexes,
15 l
M FAD and recombinant DrgA protein for ferric reductase activ-
ity, and the same reaction mixture was used the addition of 200 l
M
H
2
O
2
for the Fenton reaction. The final concentration of the Fe(III)
complexes was 10 l
M except for Ferritin, where the reaction mix-
ture contained 382.5 lg ferritin. Specific activity is expressed as
enzyme activity per milligram of purified recombinant DrgA protein
Iron compounds
Enzyme activity (UÆmg protein
)1
)
Ferric reductase
activity
Fenton
reaction
Natural chelate iron compounds
FeCl
3
0.91 ± 0 1.03 ± 0.09
Fe(III) citrate 1.41 ± 0 1.83 ± 0.26
Fe(III) ammonium citrate 1.98 ± 0.06 2.82 ± 0.18
Fe(III)-deoxymugineic acid 0.13 ± 0.05 0.53 ± 0.16
Fe(III)-nicotianamine 0.58 ± 0.25 3.46 ± 0.11
Fe(III)-ferrichrome 1.48 ± 0.09 2.38 ± 0.14
Fe(III)-deferoxamine 0.51 ± 0.18 1.33 ± 0.03
Synthetic chelate iron compounds
Fe(III)-nitrilotriacetic acid 1.74 ± 0.3 12.33 ± 0.12
Fe(III)-EDTA 3.28 + 0.31 38.98+1.66
Fe(III)-DTPA
a
5.22 ± 0.18 25.65 ± 0.27
Natural iron transporter protein
Transferrin from bovine 1.06 ± 0 8.16 ± 0.05
Natural iron storage protein
Ferritin from horse spleen 1.74 ± 0.03 0.95 ± 0.06
a
Diethylenetriamine-N,N,N ¢,N ¢¢,N ¢¢-pentaacetic acid.
M I II III IV V
Fig. 2. DNA degradation. Experimental details are described in the
Experimental procedures section. The reaction mixture contained
3.2 lg pBR322 (lane I), 3.2 lg pBR322 plus 300 l
M H
2
O
2
(lane II),
3.2 lg pBR322 plus recombinant DrgA protein (lane III), 3.2 lg
pBR322 plus Fe(III)-EDTA plus 300 l
M H
2
O
2
(lane IV), 3.2 lg
pBR322 plus Fe(III)-EDTA plus 300 l
M H
2
O
2
plus recombinant DrgA
protein (lane V).
K. Takeda et al. DrgA protein catalyzing the Fenton reaction
FEBS Journal 274 (2007) 1318–1327 ª 2007 Tokyo University of Agriculture Journal compilation ª 2007 FEBS 1321
saturated concentration of NADPH (150 lm). Table 5
summarizes the values of K
m
, k
cat
and k
cat
⁄ K
m
for
these reactions.
The k
cat
⁄ K
m
value of DrgA protein for nitrofura-
zone was 8.57 ± 0.67 · 10
5
m
)1
Æs
)1
, a value similar to
those reported for nitrofurazone of E. coli nitro-
reductase NfsA and NfsB (6.5 · 10
6
m
)1
Æs
)1
and
8.3 · 10
4
m
)1
Æs
)1
, respectively) [25,26]. The k
cat
⁄ K
m
value for FMN reductase activity of DrgA protein was
2.65 ± 0.14 · 10
5
m
)1
Æs
)1
. It is relatively low com-
pared with the corresponding value of Vibrio harveyi
NADPH-flavin oxidoreductase, which is 5.5 ·
10
6
m
)1
Æs
)1
[27–29].
Many flavin reductases display ferric reductase activ-
ity [30–34]. In parallel, iron compounds, such as FeCl
3
or Fe(III)-EDTA have been used as model substrates
to study ferric reductase, and such effort has yielded in
identification of several ferric reductases from various
organisms [35–39]. The k
cat
⁄ K
m
value for Fe(III)-
EDTA of DrgA protein was 10.9 ± 0.21 · 10
6
m
)1
Æs
)1
in the presence of free FAD. In the absence of free
FAD, it was 3.67 ± 0.05 · 10
4
m
)1
Æs
)1
, indicating that
this activity is markedly stimulated by addition of free
flavin.
Discussion
The Fenton reaction generates compounds that are
toxic to cells and presumably plays a role in restrain-
ing bacterial growth under severe environmental
pressure. In E. coli, the Fenton reaction takes place
when the respiratory chain is blocked, as shown by
Woodmansee and Imlay [9]. The photosynthetic
bacterium Synechocystis would be under stress when
exposed to strong light due to overproduction of ROS,
and the enzyme responsible for the Fenton reaction is
identified here as DrgA protein. DrgA protein was first
purified by Matsuo et al. [24], who showed that its
reductase activity worked best towards quinone,
among other substrates tested; weak activity for nitro-
benzene was also demonstrated. However, upon
homology search for DrgA protein using BLAST, the
amino acid sequence of the DrgA protein deduced
from its DNA sequence was found to be similar to
that of several nitroreductase-like proteins [17–22]. The
highest sequence homology (67% identity) was
assigned to a nitroreductase from Trichodesmium ery-
thraeum IMS101.
Furthermore, by examining DrgA mutant strains,
Elanskaya and co-workers demonstrated that the pro-
tein could be involved not only in quinone reduction
[40,41], but also in the reduction of nitroaromatic com-
pounds [40,42].
In the present study, nitroreductase activity of
purified DrgA protein was first demonstrated by
using nitrobenzene, dinoseb and nitrofrazone as sub-
strate, with the highest activity for nitrofurazone.
The k
cat
⁄ K
m
value of DrgA protein for nitrofurazone
was 8.57 ± 0.67 · 10
5
m
)1
Æs
)1
. Together, our data
indicate that DrgA protein functions as nitroreduc-
tase in vitro.
The two crystallized nitroreductases of E. coli and
Enterobacter cloacae which are homologous to DrgA
protein were reported to contain FMN [43–47] and
their highly conserved FMN binding sites (NCBI
database, Conserved domains cd02149.2) are also
found in the DrgA protein sequence at positions 10–
14 and 148–151. Indeed our DrgA protein was also
shown to contain FMN, although this was not so in
the previous report by Matsuo et al. [24]. As pro-
tein-bound FMN is known to be readily released by
dialysis and gel filtration, we kept these procedures
at a minimum. Therefore, it is likely that the differ-
ence in the FMN content in the two DrgA protein
preparations is due to the difference in the purifica-
tion scheme.
Table 5. Kinetic parameters of DrgA protein (recombinant DrgA protein was used). Experimental details are described in the Experimental
procedures section. Oxidation of 150 l
M NADPH (saturated concentration) was measured in the presence of an electron acceptor.
Substrate
K
m
value for
substrate (l
M) k
cat
(s
)1
) k
cat
⁄ K
m
(M
)1
Æs
)1
)
Nitroreductase
Nitrofurazone 4.96 ± 0.52 4.22 ± 0.12 8.57 ± 0.67 x 10
5
Flavin reductase
FAD 8.35 ± 0.66 2.02 ± 0.1 2.43 ± 0.08 x 10
5
FMN 8.49 ± 0.68 2.24 ± 0.07 2.65 ± 0.14 x 10
5
Ferric reductase
Fe(III)-EDTA (in the presence of FAD) 0.31 ± 0.01 3.38 ± 0.05 10.9 ± 0.21 x 10
6
Fe(III)-EDTA (in the absence of FAD) 0.45 ± 0.02 0.0165 ± 0.0005 3.67 ± 0.05 x 10
4
DrgA protein catalyzing the Fenton reaction K. Takeda et al.
1322 FEBS Journal 274 (2007) 1318–1327 ª 2007 Tokyo University of Agriculture Journal compilation ª 2007 FEBS
An amino acid sequence homology search of DrgA
protein picked up flavin reductase as the second high-
est score after nitroreductase. Indeed in this study it
was demonstrated that DrgA protein has a reductase
activity to flavin as well as to nitroaromatic com-
pounds. Flavin reductases are known to be capable of
ferric reduction [30–34] and, recently, Woodmansee
and Imlay [9] proposed that this reaction can be
involved in the Fenton reaction both in vivo and
in vitro. Our DrgA protein also catalyzed the Fenton
reaction as well as iron(III) reduction in vitro.
There are two types of ferric reductase reactions:
namely, a reaction using flavin, and a reaction inde-
pendent of flavin. While ferric reductase observed in
E. coli required flavin, it was not essential for iron(III)
reduction by DrgA protein, though addition of flavin
stimulated the reaction. The k
cat
⁄ K
m
values of DrgA
protein for Fe(III)-EDTA were 10.9 ± 0.21 ·
10
6
m
)1
Æs
)1
in the presence of FAD and
3.67 ± 0.05 · 10
4
m
)1
Æs
)1
in its absence, much higher
than the reported k
cat
⁄ K
m
value of a ferric reductase,
FerB, of Paracoccus denitrificans, which is only
1 · 10
2
m
)1
Æs
)1
[39]. Although variation caused by
technical differences in the measurement of the two
experiments should be considered, these results support
the idea that DrgA protein probably functions as a fer-
ric reductase using free flavin rather than functioning
simply as a flavin reductase.
We have showed here that DrgA protein utilizes both
a synthetic iron chelator, such as EDTA, and natural
chelators such as citric acid. In addition to these small
molecular weight chemical chelators (natural chelate
compounds and synthetic chelate compounds), transfer-
rin and ferritin could be substrates of the ferric reduc-
tase activity of DrgA protein. These observations
indicate that DrgA protein might function in iron meta-
bolism under physiological conditions.
Collectively, DrgA protein is an oxidoreductase util-
izing NADH or NADPH as electron donors, and qui-
none, nitroaromatic compounds, flavin and iron
chelated compounds as electron acceptors. Enzyme
kinetic studies indicate that DrgA protein exerts an
efficient reductase reaction to iron in the presence of
flavin.
The driving force of the Fenton reaction is a diva-
lent iron generated from the ferric reductase reaction.
In a hyper-reductive environment, possibly caused by
exposure to strong light, this enzyme system might
trigger the Fenton reaction. It would now be interest-
ing to compare wild-type strains and drgA gene dele-
tion mutant strains for growth rate and the regulation
of DrgA protein expression under environmental
stresses such as iron depletion.
Experimental procedures
Cell culture and preparation of cell-free extracts
Synechocystis sp. PCC6803 cell culture and preparation of
cell-free extracts were carried out as described previously
[48].
Enzyme purification
All purification steps were carried out below 4 °C. The
cell-free extracts from 10 g wet cells were ultracentrifuged
at 100 000 g for 2 h (XL-100K centrifuge, Beckman, rotor
type 45 Ti) and the supernatant (38 mL) was treated with
streptomycin (final concentration 2%) to remove nucleic
acids and stirred for 30 min on ice. After centrifugation at
17 400 g for 20 min (Avanti HP-25 centrifuge, Beckman,
rotor type JA 25.5), the supernatant (47 mL) was supplied
with 1.14 m ammonium sulfate and the pH of the cell-free
extracts was adjusted to 7.0 with 2.8% ammonium solu-
tion, followed by stirring for 30 min. After centrifugation
at 17 400 g for 15 min (Avanti HP-25 centrifuge, Beck-
man, rotor type JA 25.5), the supernatant (49 mL) was
subjected to a butyl toyopearl (Tosoh, Tokyo, Japan) col-
umn (3.5 · 22.0 cm) equilibrated with a 50 mm sodium
phosphate buffer, pH 7.0, containing 1.14 m ammonium
sulfate. The column was washed with four column vol-
umes of the same buffer, and the protein was eluted with
a linear gradient of 1.14 m ammonium sulfate to 0 m. The
pooled fraction (100 mL) was dialyzed twice against 5 L
of a 10 mm sodium phosphate buffer, pH 8.0. The dialy-
sate was subjected to a DEAE Sepharose Fast Flow (GE
Healthcare Bio-Sciences, Piscataway, NJ, USA) column
(3.3 · 23.5 cm) equilibrated with a 10 mm sodium phos-
phate buffer, pH 8.0. The column was washed with three
column volumes of the same buffer, and the enzyme was
eluted with a linear gradient of NaCl (0–250 mm). The
active fractions (62 mL) were pooled, concentrated and
dialyzed against 10 mm sodium phosphate buffer, pH 8.0,
by an Apollo membrane (cut-off size 10 kDa, Orbital Bio-
science, Topsfield, MA, USA). Pooled fractions (6.2 mL)
were put on a POROS HQ-H (Applied Biosystems,
Tokyo, Japan) column (1.0 · 10.0 cm) equilibrated with
the same buffer. The column was washed with five column
volumes of the same buffer, and the enzyme was eluted
with a linear gradient of NaCl (0–250 mm). The active
fractions (120 mL) were pooled, concentrated and dialyzed
against a 50 mm sodium phosphate buffer, pH 7.0, by an
Apolo membrane (cut-off size 10 kDa, Orbital Bioscience).
The purity and molecular mass of the enzyme were deter-
mined by SDS ⁄ PAGE by the method of Laemmli [49].
The proteins were electro-transferred to a polyvinylidene
difluoride membrane and the N-terminal sequence was
determined by a protein sequencer (model 492, Applied
Biosystems).
K. Takeda et al. DrgA protein catalyzing the Fenton reaction
FEBS Journal 274 (2007) 1318–1327 ª 2007 Tokyo University of Agriculture Journal compilation ª 2007 FEBS 1323
Enzyme assay
Fenton reaction activity
Enzyme activities were measured anaerobically. Enzyme solu-
tions containing cell-free extracts (0.14–0.48 mg protein), or
1 lg purified enzyme in the presence or absence of flavin in a
50 mm sodium phosphate buffer (pH 7.0) were loaded into a
Tunberg tube. After anaerobiosis was established by repeated
evacuation and equilibration with oxygen-free argon at
30 °C, the reaction was initiated by addition of enzyme solu-
tion to mixtures of iron(III) compounds and NADH solution.
The reaction was monitored at 340 nm in a spectrophotome-
ter (Hitachi U-3000). The iron(III) compounds and 150 lm
NADH solution in a 50 mm sodium phosphate buffer
(pH 7.0), in the presence or absence of 1 mm t-butyl hydro-
peroxide, were made anaerobic by bubbling with oxygen-free
argon at 30 °C. Fenton reaction activity was determined by
measuring the difference of NAD(P)H consumption in the
presence and absence of t-butyl hydroperoxide.
The absorbance coefficient of NADH and NADPH were
set to be 6.22 and 6.20 m m
)1
Æcm
)1
, respectively. One unit
activity of the Fenton reaction is defined as the amount of
enzyme that oxidizes 1 lmole of NAD(P)H per minute.
Ferric reductase activity
Ferric reductase activity was measured anaerobically in
the same reaction mixture as for the Fenton reaction, but
without t-butyl hydroperoxide, at 30 °C. The activity was
determined by measuring the difference of NAD(P)H
consumption at 340 nm in the presence and absence of
iron(III) compounds.
Flavin reductase activity
Flavin reductase activity was measured anaerobically using
the same reaction mixture as for ferric reductase, but with-
out iron(III) compounds, at 30 °C. Flavin reductase activity
was determined by measuring the difference in NAD(P)H
consumption at 340 nm in the presence and absence of the
enzyme.
Nitroreductase activity
The nitroreductase activity was measured aerobically at
30 °C. The reaction mixture contained 50 mm sodium phos-
phate buffer (pH 7.0), 150 lm NAD(P)H, nitro compounds
and enzyme. Nitroreductase activity was determined by
measuring NAD(P)H consumption at 340 nm in the presence
and absence of an enzyme.
Substrate specificity for NAD(P)H oxidation
Substrate specificity was examined under aerobic conditions
because purified DrgA protein does not react with oxygen.
NAD(P)H solution (final concentration 150 lm, in a 20 mm
Tris ⁄ HCl buffer, pH 7.5) was prewarmed to 30 °C and
placed in a micro black-cell and set into a spectrophoto-
meter (Hitachi U-3000). NAD(P)H oxidation measurement
was immediately started at 340 nm, and substrates were
added to the mixture. After baseline equilibrium was
reached, DrgA protein was added to the mixture 2,3-
dimethoxy-5-methyl-1, 4-benzoquinone (ubiquinone 0),
duroquinone, ferricyanide, FAD, FMN, nitrobenzene, di-
noseb and nitrofurazone were used as substrates at a final
concentration of 100 lm each. In the case of cytochrome C,
the concentration was set to 50 lm and absorbance was
measured at 550 nm. The absorbance coefficient of NADH
and NADPH was set as described above.
Stoichiometry of the Fenton reaction
Stoichiometry and confirmation of the product of the Fen-
ton reaction were carried out under anaerobic conditions.
DrgA protein (140.8 lg), deoxyribose (final concentration
0.6 mm) and Fe(III)-EDTA (final concentration 5 lm) were
mixed in a 15 mm sodium phosphate buffer, pH 7.0, in a
Tunberg tube (final volume, 1.6 mL), then the air was sub-
stituted with argon for 15 min. NADH (final concentration
100 lm) and hydrogen peroxide (final concentration
300 lm) were added in a 15 mm sodium phosphate buffer,
pH 7.0, in another aerobic cuvette, and air was substituted
with argon for 15 min. The anaerobic cuvette and the tube
were warmed at 30 °C for 5 min, and the initial concentra-
tion of NADH was determined on site by measuring its
absorption at 340 nm. Then, the content of the Tunberg
tube was transferred to an anaerobic cuvette using a syringe
and the solution was mixed well. The reaction was monit-
ored by measuring the consumption of NADH at 340 nm.
In parallel, the amount of hydrogen peroxide and hydroxyl
radicals was measured before and after the reaction. The
quantitation of hydrogen peroxide and hydroxyl radicals
was carried out as described previously [50,51].
DNA degradation in the Fenton reaction
DNA degradation was measured under anaerobic condi-
tions. The recombinant DrgA protein (140.8 lg), Fe(III)-
EDTA (final concentration 5 lm) and 3.2 lg pBR322 DNA
were mixed in a 15 mm sodium phosphate buffer, pH 7.0,
in a Tunberg tube (final volume 1.6 mL), and the air was
substituted with argon for 15 min. In another aerobic cu-
vette NADH (final concentration 100 lm) and hydrogen
peroxide (final concentration 300 lm) were added in a
15 mm sodium phosphate buffer, pH 7.0, and the tubes
were warmed at 30 °C for 5 min. Following confirmation
of the initial concentration of NADH by measuring its
absorption at 340 nm, the content of the Tunberg tube was
transferred to an anaerobic cuvette using a syringe, mixed
well and incubated for 5 min. The reaction was monitored
DrgA protein catalyzing the Fenton reaction K. Takeda et al.
1324 FEBS Journal 274 (2007) 1318–1327 ª 2007 Tokyo University of Agriculture Journal compilation ª 2007 FEBS
by measuring the decrease of absorption of NADH at
340 nm. Each 20 lL of reaction mixture was subjected to
agarose gel electrophoresis and DNA bands were visualized
on the gel by staining with ethidium bromide.
Steady-state kinetics
The values of K
m
and k
cat
for Fe(III)-EDTA, FAD, FMN
and nitrofurazone was determined from Lineweaver)Burk
plots of the kinetic data obtained at 30 °C at various sub-
strate concentrations in a 50 mm sodium phosphate buffer,
pH 7.0, containing 150 lm NADPH. The consumption of
NADPH was monitored with a spectrophotometer at
340 nm (Hitachi U-3000).
Cloning, expression, and purification of DrgA
from Synechocystis sp. PCC6803
We cloned the gene of drgA from Synechocystis sp.
PCC6803. A Synechocystis DNA fragment containing the
open reading frame, slr 1719, was amplified by the PCR using
the forward primer, 5’-ac
g aat tcc acc acc acc acc acc aca tgg
aca cct ttg acg cta tt-3’ and the reverse primer, 5’-tag
ctc gag
tta ggc aaa gga gtt ttc cca-3’. The forward primer was
designed to introduce six His Tags following an EcoR I site,
and the reverse primer contained a Xho I site as underlined.
Amplified DNA fragments were subcloned into the
pTrc99A vector for transformation of E. coli strain JM109.
IPTG-induced recombinant protein was purified.
All steps of the purification procedure of recombinant
Synechocystis DrgA were carried out at 4 °C and monit-
ored by SDS ⁄ PAGE. Cells (23 g wet weight) were suspen-
ded in 92 mL of 50 mm sodium phosphate buffer, pH 7.0.
The suspension was stirred at 4 °C for 20 min. Cells were
thawed and passed through a French pressure cell (Thermo
IEC, Needham, Heights, MA, USA) twice at 88.99 kgÆcm
)2
and then sonicated for 3 min. Phenylmethylsulfonyl fluoride
(final concentration, 2 mm) was added to the suspension
three times, i.e. immediately before and after the passage
through the French pressure cell, and after sonication. The
resultant suspension was centrifuged at 64 000 g for 20 min
(Avanti HP-25 centrifuge, Beckman, JA 25.5 rotor) to
remove unbroken cells. The supernatant was treated with
streptomycin to remove nucleic acids and was stirred at
4 °C for 30 min. After centrifugation at 64 000 g for
20 min (Avanti HP-25 centrifuge, Beckman, JA 25.5 rotor),
the supernatant (112 mL) was dialyzed twice against 5 L of
the 50 mm sodium phosphate buffer, pH 7.0, containing
300 mm NaCl. The dialysate (120 mL) was subjected to a
Talon (Takara, Tokyo, Japan) column (2.2 · 5.3 cm) equili-
brated with 50 mm sodium phosphate buffer, pH 7.0, con-
taining 300 mm NaCl. The column was washed with five
volumes of the same buffer. The enzyme was eluted step-
wise with 50, 100 and 150 mm imidazole from the column.
The pooled fraction from 50 to 100 mm imidazole elution
was dialyzed three times against 5 L of a 10 mm sodium
phosphate buffer, pH 8.0. The dialysate (35.5 mL) was sub-
jected to a DEAE Sepharose Fast Flow (GE Healthcare
Bio-Sciences) column (3.3 · 23.5 cm) equilibrated with a
10 mm sodium phosphate buffer, pH 8.0. The column was
washed with five column volumes of the same buffer, and
the enzyme was eluted with a linear gradient of NaCl (0–
250 mm). Active fractions were pooled, concentrated and
dialyzed against 45 mL of 50 mm sodium phosphate buffer,
pH 7.0, by an Apollo membrane (cut-off size 10 kDa, Orbi-
tal Bioscience). The measurement of maximum absorption
wavelength and extinction coefficient of DrgA protein pre-
paration was carried out as described previously [52]. The
extinction coefficient for the bound FMN at 459 nm was
estimated to be 11.9 mm
)1
Æcm
)1
.
Acknowledgements
We are grateful to Professor S. Mori of The University
of Tokyo for providing deoxymugineic acid and nico-
tianamine. We thank A. Sekine and M. Fujiya for
their technical assistance.
References
1 Brawn K & Fridovich I (1981) DNA strand scission by
enzymically generated oxygen radicals. Arch Biochem
Biophys 206, 414–419.
2 Lesko SA, Lorentzen RJ & Ts’o POP (1980) Role of
superoxide in deoxyribonucleic acid strand scission. Bio-
chemistry 19, 3023–3028.
3 McCord JM & Day ED Jr (1978) Superoxide-dependent
production of hydroxyl radical catalyzed by iron-EDTA
complex. FEBS Lett 86, 139–142.
4 Imlay JA & Fridovich I (1991) Assay of metabolic
superoxide production in Escherichia coli. J Biol Chem
266, 6957–6965.
5 Tyler DD (1975) Polarographic assay and intracellular
distribution of superoxide dismutase in rat liver. Bio-
chem J 147, 493–504.
6 Rowley DA & Halliwell B (1982) Superoxide-dependent
formation of hydroxyl redicals from NADH and
NADPH in the presence of iron salts. FEBS Lett 142,
39–41.
7 Winterbourn CC (1979) Comparison of superoxide
with other reducing agents in the biological produc-
tion of hydroxyl radicals. Biochem J 182, 625–
628.
8 Imlay JA & Linn S (1988) DNA damage and oxygen
radical toxicity. Science 240, 1302–1309.
9 Woodmansee AN & Imlay JA (2002) Reduced flavins
promote oxidative DNA damage in non-respiring
Escherichia coli by delivering electrons to intracellular
free iron. J Biol Chem 277, 34055–34066.
K. Takeda et al. DrgA protein catalyzing the Fenton reaction
FEBS Journal 274 (2007) 1318–1327 ª 2007 Tokyo University of Agriculture Journal compilation ª 2007 FEBS 1325
10 Asada K (1994) Mechanisms for scavenging reactive
molecules generated in chloroplasts under light stress. In
Photoinhibition of Photosynthesis: from Molecular
Mechanisms to the Field (Baker NR & Bowyer JR, eds.)
pp. 129–142. Bios Scientific Publications, Oxford.
11 Foyer CH, Descourvie
`
res P & Kunert KJ (1994) Protec-
tion against oxygen radicals: an important defence
mechanism studied in transgenic plants. Plant Cell
Environ 17, 507–523.
12 Asada K (1996) Radical production and scavenging in
the chloroplasts. In Photosynthesis and the Environment
(Baker NR, ed.), pp. 123–150. Kluwer Academic Pub-
lishers, Dordrecht.
13 Asada K (1997) In Oxidative Stress and the Molecular
Biology of Antioxidant Defences (Scandalios JG, ed.),
pp. 715–735. Cold Spring Harbor Laboratory Press,
New York, NY.
14 Asada K (1999) The water–water cycle in chloroplasts:
scavenging of active oxygens and dissipation of excess
photons. Annu Rev Plant Physiol Plant Mol Biol 50,
601–639.
15 Mano J & Asada K (1999) Molecular mechanisms of
the water-water cycle and other systems to circumvent
photooxidative stress in plants. In Molecular Mechan-
isms of Response and Adaptation to Environmental Sti-
muli (Kazuo, S, Masayuki, Y, Syou, O & Masaki, I,
eds), pp. 2239–2245. Kyoritu Press, Tokyo.
16 Kaneko T & Tabata S (1997) Complete genome struc-
ture of the unicellular cyanobacterium Synechocystis sp.
PCC6803. Plant Cell Physiol 38, 1171–1176.
17 Cocco D, Rinaldi A, Savini I, Cooper JM & Bannister
JV (1988) NADH oxidase from the extreme thermophile
Thermus aquaticus YT-1. Eur J Biochem 174, 267–271.
18 Watanabe M, Ishidate M Jr & Nohmi T (1990) Nucleo-
tide sequence of Salmonella typhimurium nitroreductase
gene. Nucleic Acids Res 18, 1059.
19 Bryant C, Hubbard L & McElroy WD (1991) Cloning,
nucleotide sequence, and expression of the nitroreduc-
tase gene from Enterobacter cloacae . J Biol Chem 266,
4126–4130.
20 Park H-J, Reiser COA, Kondruweit S, Erdmann H,
Schmid RD & Sprinzl M (1992) Purification and char-
acterization of a NADH oxidase from the thermophile
Thermus thermophilus HB8. Eur J Biochem 205, 881–
885.
21 Zenno S, Saigo K, Kanoh H & Inouye S (1994) Iden-
tification of the gene encoding the major NAD(P)H-
flavin oxidoreductase of the bioluminescent bacterium
Vibrio fischeri ATCC 7744. J Bacteriol 176, 3536–
3543.
22 Fleischmann RD, Adams MD, White O, Clayton RA,
Kirkness EF, Kerlavage AR, Bult CJ, Tomb J-F,
Dougherty BA, Merrick JM, et al. (1995) Whole-gen-
ome random sequencing and assembly of Haemophilus
influenzae Rd. Science 269, 496–512.
23 Saeki Y, Nozaki M & Matsumoto K (1985) Purification
and properties of NADH oxidase from Bacillus mega-
terium. J Biochem (Tokyo) 98, 1433–1440.
24 Matsuo M, Endo T & Asada K (1998) Isolation of a
novel NAD(P)H-quinone oxidoreductase from the cya-
nobacterium Synechocystis PCC 6803. Plant Cell Physiol
39, 751–755.
25 Zenno S, Koike H, Kumar AN, Jayaraman R, Tanok-
ura M & Saigo K (1996) Biochemical characterization
of NfsA, the Escherichia coli major nitroreductase exhi-
biting a high amino acid sequence homology to Frp, a
Vibrio harveyi flavin oxidoreductase. J Bacteriol 178,
4508–4514.
26 Zenno S, Koike H, Tanokura M & Saigo K (1996)
Gene cloning, purification, and characterization of
NfsB, a minor oxygen-insensitive nitroreductase from
Escherichia coli, similar in biochemical properties to
FRase I, the major flavin reductase in Vibrio fischeri.
J Biochem 120, 736–744.
27 Lei B, Liu M, Huang S & Tu S-C (1994) Vibrio harveyi
NADPH-flavin oxidoreductase: cloning, sequencing and
overexpression of the gene and purification and charac-
terization of the cloned enzyme. J Bacteriol 176, 3552–
3558.
28 Jablonski E & DeLuca M (1977) Purification and prop-
erties of the NADH and NADPH specific FMN oxido-
reductases from Beneckea harveyi. Biochemistry 16,
2932–2936.
29 Jablonski E & DeLuca M (1978) Studies of the control
of luminescence in Beneckea harveyi: properties of the
NADH and NADPH: FMN oxidoreductases. Biochem-
istry 17, 672–678.
30 Coves J & Fontecave M (1993) Reduction and mobiliza-
tion of iron by a NAD (P) H: flavin oxidoreductase
from Escherichia coli. Eur J Biochem 211, 635–641.
31 Pierre JL, Fontecave M & Crichton RR (2002) Chemis-
try for an essential biological process: the reduction of
ferric iron. Biometals 15, 341–346.
32 Fontecave M, Eliasson R & Reichard P (1987)
NAD(P)H: flavin oxidoreductase of Escherichia coli.
J Biol Chem 262, 12325–12331.
33 Fontecave M, Coves J & Pierre. J-L (1994) Ferric
reductases or flavin reductases? Biometals 7, 3–8.
34 Filisetti L, Valton J, Fontecave M & Nivie
`
re V (2005)
The flavin reductase ActVB from Streptomyces coelico-
lor: characterization of the electron transferase activity
of the flavoprotein form. FEBS Lett 579, 2817–2820.
35 Fukuda H, Takahashi M, Fujii T, Tazaki M & Ogawa
T (1989) An NADH: Fe(III) EDTA oxidoreductase
from Cryptococcus albidus: an enzyme involved in ethy-
lene production in vivo? FEMS Microbiol Lett 60, 107–
112.
36 Bru
¨
ggemann W & Moog PR (1989) NADH-dependent
Fe
3+
EDTA and oxygen reduction by plasma membrane
vesicles from barley roots. Physiol Plant 75, 245–254.
DrgA protein catalyzing the Fenton reaction K. Takeda et al.
1326 FEBS Journal 274 (2007) 1318–1327 ª 2007 Tokyo University of Agriculture Journal compilation ª 2007 FEBS
37 Bru
¨
ggemann W, Moog PR, Nakagawa H, Janiesch P &
Kuiper PJC (1990) Plasma membrane-bound NADH:
Fe
3+
-EDTA reductase and iron deficiency in tomato
(Lycopersicon esculentum). Is there a Turbo reductase?
Physiol Plant 79, 339–346.
38 Vadas A, Monbouquette HG, Johnson E & Schro
¨
der I
(1999) Identification and characterization of a novel fer-
ric reductase from the hyperthermophilic archaeon
Archaeoglobus fulgidus. J Biol Chem 274, 36715–36721.
39 Mazoch. J, Tesar
ˇ
ı
´
k R, Sedla
´
c
ˇ
ek V, Kuc
ˇ
era I & Tura
´
nek
J (2004) Isolation and biochemical characterization of
two soluble iron(III) reductases from Paracoccus denitri-
ficans. Eur J Biochem 271, 553–562.
40 Elanskaya IV, Grivennikova VG, Groshev VV,
Kuznetsova GV, Semina ME & Timofeev KN (2004)
Role of NAD(P)H: quinone oxidoreductase encoded by
drgA gene in reduction of exogenous quinones in cyano-
bacterium Synechocystis sp. PCC 6803 cells. Biochemis-
try (Moscow) 69, 137–142.
41 Elanskaya IV, Timofeev KN, Grivennikova VG,
Kuznetsova GV, Davletshina LN, Lukashev EP &
Yaminsky FV (2004) Reduction of photosystem I reac-
tion center in DrgA mutant of the cyanobacterium
Synechocystis sp. PCC 6803 lacking soluble NAD(P)H:
quinone oxidoreductase. Biochemistry (Moscow) 69,
445–454.
42 Elanskaya IV, Chesnavichene EA, Vernotte C & Astier
C (1998) Resistance to nitrophenolic herbicides and
metronidazole in the cyanobacterium Synechocystis sp.
PCC 6803 as a result of the inactivation of a nitroreduc-
tase-like protein encoded by drgA gene. FEBS Lett 428,
188–192.
43 Parkinson GN, Skelly JV & Neidle S (2000) Crystal
structure of FMN-dependent nitroreductase from
Escherichia coli B: a prodrug-activating enzyme. J Med
Chem 43, 3624–3631.
44 Lovering AL, Hyde EI, Searle PF & White SA (2001)
The structure of Escherichia coli nitroreductase com-
plexed with nicotinic acid: Three crystal forms at 1.7A
˚
,
1.8 A
˚
and 2.4 A
˚
resolution. J Mol Biol 309, 203–213.
45 Haynes CA, Koder RL, Miller A-F & Rodgers DW
(2002) Structures of nitroreductase in three states. J Biol
Chem 277, 11513–11520.
46 Johansson E, Parkinson GN, Denny WA & Neidle S
(2003) Studies on the nitroreductase prodrug-activating
system. Crystal structures of complexes with the inhibi-
tor dicoumarol and dinitrobenzamide prodrugs and of
the enzyme active form. J Med Chem 46, 4009–4020.
47 Race PR, Lovering AL, Green RM, Ossor A, White
SA, Searle PF, Wrighton CJ & Hyde EI (2005) Struc-
tural and mechanistic studies of Escherichia coli nitrore-
ductase with the antibiotic nitrofurazone. J Biol Chem
280, 13256–13264.
48 Takeda K, Nishiyama Y, Yoda K, Watanabe T, Mats-
une NK, Mura K, Tokue C, Katoh T, Kawasaki S &
Niimura Y (2004) Distribution of Prx-linked hydroper-
oxide reductase activity among microorganisms. Biosci
Biotechnol Biochem 68, 20–27.
49 Laemmli UK (1970) Cleavage of structural proteins
during the assembly of the head of bacteriophage T4.
Nature 227, 680–685.
50 Sedewitz B, Schleifer KH & Go
¨
tz F (1984) Purification
and biochemical characterization of pyruvate oxidase
from Lactobacillus plantarum. J Bacteriol 160, 273–278.
51 Gutteridge JMC (1987) Ferrous-salt-promoted damage
to deoxyribose and benzoate. The increased effectiveness
of hydroxyl-radical scavengers in the presence of
EDTA. Biochem J 243, 709–714.
52 Ohnishi K, Niimura Y, Hidaka M, Masaki H, Suzuki
H, Uozumi T & Nishino T (1995) Role of cysteine 337
and cysteine 340 in flavoprotein that functions as
NADH oxidase from Amphibacillus xylanus studied by
site-directed mutagenesis. J Biol Chem 270, 5812–5817.
Supplementary material
The following supplementary material is available
online:
Fig. S1. SDS ⁄ PAGE of the purified t-butyl hydro-
peroxide reducing enzyme. SDS ⁄ PAGE was carried
out as described in Experimental procedures using
15% polyacrylamide gels.
Table S1. NAD(P)H oxidoreductase activities
responsible for the Fenton reaction in the pre-dialysis
cell-free extracts. The activity was determined follow-
ing absorbance of NAD(P)H oxidation at 340 nm in a
50 mm sodium phosphate buffer (pH 7.0) at 30 °C.
The reaction mixture contained 100 lm Fe(III)-EDTA,
15 lm flavin and 1 mm t-butyl hydroperoxide. Specific
activity is expressed as enzyme activity per milligram
of total protein.
Table S2. Km for NADH or NADPH. Experimen-
tal details are described in the Experimental proce-
dures section. Oxidation of 150 lm NADH or
NADPH was measured in the presence of an electron
acceptor.
This material is available as part of the online article
from
Please note: Blackwell Publishing is not responsible
for the content or functionality of any supplementary
materials supplied by the authors. Any queries (other
than missing material) should be directed to the corres-
ponding author for the article.
K. Takeda et al. DrgA protein catalyzing the Fenton reaction
FEBS Journal 274 (2007) 1318–1327 ª 2007 Tokyo University of Agriculture Journal compilation ª 2007 FEBS 1327