DECISION SUPPORT SYSTEMS: A CASE STUDY IN VESTEL DURABLE GOODS MARKETING pptx
Bạn đang xem bản rút gọn của tài liệu. Xem và tải ngay bản đầy đủ của tài liệu tại đây (255.2 KB, 8 trang )
Number18,2006
113
DECISIONSUPPORTSYSTEMS:ACASESTUDY
INVESTELDURABLEGOODSMARKETING
LutfuSagbansua
UniversityofMississippi
MIS/POMDepartment
ABSTRACT
Supply chain management d eals with the efficient coordination of enterprises along a value chain to
providegoodsandservicesto endusers.Thesuccessinmanagingasupplychainheavilydependsonthe
effectiveusageoftechnology.Decisionsupportsystems(DSS)playsucharole.ADSSassistsandsupportsthe
humandecisionmakerinthedecisionmakingprocess.ImplementationofsuchaDSStoolbyVestelDurable
GoodsMarketingintheirdistributionresourceplanningprocessisanalyzedandpresentedinthisstudy.
Keywords:DSS,SupplyChain,InformationTechnology,Distribution
TƏDARÜKİDARƏETMƏŞƏBƏKƏSİVƏVESTEL
ELEKTRİKMALLARININSATIŞINDATƏTBİQİ
XÜLASƏ
Tədarükİdarəetmə Şəbəkəsi son istifadəçilərə xidmət etmək və malları tədarük etmək üçün səmərəli
kordinasiyalimüəssisələril əbirgəəlaqəqurur.Ağırbirtədarükzincirinin
idərəolunmasındamüvəffəqiyyət
qazanmaq,effektlitexnologiyanınistifadəsindənirəligəlir.Qərardəstəksistemidəeləbucürbirroloynayır.
Bir Qərar Dəstək Sistemi, qərar vermə mərhələsində insanın qə
rar qəbul etməsinə yardim edir və onu
dəstəkləyir.Vesteltərəfindənmalbazarıvəonlarınpaylanmaresursplanlarıbucürbirqərarverməsistem
alətinintərəfindəntəhlilolunuraqbutətqiqatobyektindətəqdimolunur.
Açar
sözlər:Texnikitəchizat,informasiyatexnologiyaları,çatdırılma
INTRODUCTION
Many of the advances in the control and
management of supply chains are driven by
advancing computer technology. Supply
chainmanagementproblemsarenotsorigid
and well defined that they can be delegated
entirelytocomputers.Instead,inalmostevery
case, the flexibility, intuition, and wisdom
that is
a unique characteristic of humans is
essential to manage the systems effectively.
However, there are many aspects of these
systems that can only be analyzed and
understood effectively with the aid of a
computer.Itisexactlythistypeofassistance
whichdecision‐supportsystemsaredesigned
to provide. As
the name implies, these
systems do not make decision, instead, they
assistandsupportthehumandecisionmaker
inhisorherdecision‐makingprocess.
Decision‐support systems range from
spreadsheets, in which users perform their
own analysis, to expert systems, which
attempt to incorporate the knowledge of
expertsinvarious
fieldsandsuggestpossible
alternatives. The appropriate DSS for a
particularsituationdependsonthenatureof
the problem, the planning horizon, and the
type of decisions that need to be made. In
LutfuSagbansua
JournalofQafqazUniversity
114
addition, there is frequently a trade‐off
between generic tools that are not problem‐
specificandallowanalysisofmanydifferent
kinds of data, and often more expensive
systems that are tailored to a specific
application. Within the various disciplines
that make up supply chain ma nagement,
DSSs are used to
address various problems,
from strategic problems such as logistic
network design to tactical problems such as
the assignment of products to warehouses
and manufacturing facilities, all the way
through to day‐to‐day operation problems
like production scheduling, delivery mode
selection, and vehicle routing. The inherent
sizeandcomplexityof
manyofthesesystems
make DSSs essential for effective decision
making.DSSinsupplychainmanagementare
often called Advanced Planning and
Scheduling systems. These systems typically
coverthefollowingareas:Demandplanning,
supply planning, manufacturing planning
andscheduling.
Typically, decision‐support‐systems use the
quantifiableinformation available to illustrate
various
possible solutions, and allo w the
decisionmakertodecidewhichoneisthemost
appropriate, based on other, possibly non ‐
quantifiable factors. Often, DSSs allow the
decisionmakertoanalyzetheconsequencesof
decision, depending on different possible
scenarios. This kind of what ‐if analysis can
helpavoidproblemsbefore
theyoccur.
Manydecision‐supportsystemsusemathema‐
tical tools to assist in the decision ‐making
process. These tools, often from the mathe‐
maticaldisciplineofoperationsresearch,were
firstdevelopedtoassistthearmedforceswith
the enormous logistical challenges of World
War II. Since th en, improvements in these
techniques,
as well as ever‐increasingcompu‐
terpower,havehelpedtoimprovethesetools
andmakethemmoreaccessibletoothers.
The to ols of art ificial intelligence are also
employed in the design of decision‐support
systems. Intelligent agents use AI to assist in
decision making, especially in real‐time
decision,
suchasdetermininghowtosupplya
customer in the shorte st possible time or to
quote a delivery lead time as the cust o mer
waitsonthephone.FollowingFox,Chionglo,
and Barbuceanu, we define an agent as a
softwareprocesswhosegoalistocommunicate
and interact with other agents, so
that
decisionsaffectingtheentiresupplychaincan
bemadeonagloballevel.
SUPPLYCHAINDECISIONSUPPORT
SYSTEMS
Supply chain management encompasses a
larger variety of decision. A list of such
decisionsisprovidedbelow:
‐ DemandPlanning
‐ Logisticsnetworkdesign
‐ Inventorydeployment
‐ Salesandmarketingregionassignment
‐ Distributionresourceplanning
‐ Materialrequirementsplanning
‐ Inventorymanagement
‐ Productionlocationassignment/facility
deployment
‐ Fleetplanning
‐ Leadtimequotation
‐ Productionscheduling
‐ Workforcescheduling
SELECTINGASUPPLYCHAINDSS
For each of the supply chain problems and
issueslistedabove,decisionsupportsystems
are available in many configurations,
platforms, and price ranges. DSS platforms
have evolved in the last 15 years from
relatively inflexible mainframe systems, to
isolated PC tools, to client/ server processes;
lately, there is a new breed of high‐
performance and extensible enterprise
decision‐support applications. These systems
come in a wide range of pricing
from PC
systems costing several thousand dollars to
company‐wide installations costing a few
milliondollars.
DecisionSupportSystems:ACaseStudyinVestelDurableGoodsMarketing
Number18,2006
115
When evaluating a particular DSS, the
followingissuesneedtobeconsidered:
‐ Thescopeoftheproblemaddressedbythe
decision maker, including the planning
horizon.
‐ Thedatarequiredbythedecision‐support
system
‐ Analysisrequirements,includingaccuracy
of the model, ability to quantify perfor‐
mance measures, desired analytical
tools‐
thatis,optimization,heuristics,simulation,
financial calculation requirements, and
computationalspeedneeded.
‐ The system’s ability to generate a variety
ofsolutionssothattheusercanselectthe
most appropriate one, typically based on
issuesthatcannotbequantified.
‐ The presentation requirements, including
issues such as user‐friendliness,
graphic
interface, geographic abilities, tables,
reports,andsoon.
‐ Compatibility and integration with
existingsystems.
‐ Hardware and software system require‐
ments, including platform requirements,
flexibility to changes, user interfaces, and
technicalsupportavailable.
‐ Theoverallprice,includin gthebasicmodel,
customization,andlong‐termupgrades.
‐ Finally,considercomplementarysystems.
LITERATUREREVIEW
Asupplychaincanbedefinedasanetworkof
autonomous or semiautonomous business
entities collectively responsible for procure‐
ment,manufacturinganddistributionactivities
associated with one or more families of
relatedproducts.Differententitiesinasupply
chain operate subject to different sets of
constraints and objectives.
However, these
entities are highly interdependent when it
comes to improving performance of the
supplychainintermsofobjectivessuchason‐
time delivery, quality assurance and cost
minimization.
As a result, performance of any entity in a
supplychaindependsontheperformanceof
others, and their willingness and
ability to
coordinateactivitieswithinthesupplychain.
A global economy and increase in customer
expectations regarding cost and service have
influencedmanufacturerstostrivetoimprove
processes within their supply chains, often
referred to as supply chain re‐engineering
(Swaminathan,1996).
Supply chain re‐engineering efforts have po‐
tential
to impact the performance of supply
chains.Oftentheyareundertakenwithonlya
probabilistic view of the future, and it is
essential to perform a detailed risk analysis
before adopting a new process. In addition,
many times these re‐engineering efforts are
made under politically ad emotiona lly
charged circumstances. As
a result, decision
support tools that can analyze various
alternativescanbeveryuseful inimpartially
quantifying gains and helping the
organizationmakethe rightdecision(Feigin,
An,Connors,andCrawford1996).
The goals of supply chain management are
design, operation and maintenance of
integrated value chains to satisfy consumer
needs in the most efficient way by
simultaneously maximizing customer service
(Christopher,1998;Hewitt,1994;Ross,1998).
Today, SCM is accepted as a concept
integrating inter‐organizational business
processesandcomprises other conceptssuch
as Efficient Consumer Response, Quick
Response, Continuous Replenishment and
Customer Relationship Management (Bechtel
and Jayaram, 1997). The
design of supply
chains requires the specification of business
processes and supply chain wide planning
routinesasspecialtaskofthedevelopmentof
information systems as the backbone of any
supply chain integration. Information
technologyiswidelyperceivedastheenabler
of supply chain integration (Bechtel and
Jayaram, 1997; Hewitt,
1994). Enterprises
participating as partners in a supply chain
LutfuSagbansua
JournalofQafqazUniversity
116
havetoprovidetheiractivitiesina waythat
maximizes the supplychainefficiency.Thus,
they have to concentrate on their core
competencies(Christopher,1998).
TheneedforDSScomesfromagapthatexists
in the typical organization’s information
resource management scheme. This gap is a
clear indicator that
classical data procession
has not met the growing needs of modern
businessconcerns.Forexample,today’schief
executive is faced with an extensive list of
fast‐developingproblems:
- Thereisalargesetofincreasinglycomplex
and comprehensive government agencies
andregulationsimpactingonabusiness.
- The economic
climate has increased
financialpressureonbusiness.
- Many companies are now dealing in the
world marketplace. With the improved
capabilities of the transportation and
communications industries, the business
world has become smaller and more
intensecompetitionhasresulted.
Thesearesomeofthecurrentchallengesthat
needtobeaddressed
bybusiness.
SUPPLYCHAINMANAGEMENTAT
VESTEL
Vestel Electronics A.S. is the largest
electronics manufacturer in Turkey. Its core
productTVswereaccountingfor70%oftotal
salesin2000andmonitorsrepresented5%.In
2001,VestelElectronicsproducedatotalof4.6
million televisions, making up to 65% of
the
country’s total TV production. In 2002, TV
productionincreasedto6.4million.
While being a leading brand in the Turkish
televisionmarketwith30%marketshareasof
year2002VestelElectronicsisalsothelargest
domestic brand exporter with 65% share.
Being the largest full‐range television ODM
(Original
Design and Manufacturing) in
Europe,VestelElectronicshadamarketshare
of17%inOEMsales.
VESTELDISTRIBUTIONNETWORK
Most of the production occurs in a plant in
Manisa. Imported goods are also received
there. Until 1999, the company had four
warehouses,servingthedealersandoutletsin
different regions
of the country. Distribution
isperformedbyHorozLogistics.Withtheflat
price per item pricing scheme given by the
third‐party‐logistics (3PL) company, it was
clear that there was no need to keep four
warehouses. This led to an initiative of
warehouse consolidation, whereby the
distribution network took its
current form
with two warehouses. Other than the
reductionindurablegoodsmarketcausedby
thefinancialcrisisinTurkeyin2001,Vestel’s
productionhasincreasedcontinuouslyasitis
statedinthefollowingtable.
Table1.ThenumberofUnitsShipped:Annualyand
Monthly
2000 2001 2002 2003
Annual
900,000 518,867 592,652 1,007,701
Monthly
75,000 43,239 49,387 83,975
• In2001,duetothefinancialcrisisinTurkey,the
durablegoodsmarketreducedby48%
ANEWPLANNINGSYSTEM:MANUGISTICS
TRANSPORTATIONMANAGEMENT
Given the object ive of a better measurable
system, Vestel decided to implement
Manugistics’NetworkTransportManagement
(MTM) module as the nex t improvement
effortsforthedistributionsystemin2000.This
package was chosen based on service options
madeavailableinTurkeyby the various
SCP
providers and subsequent to anegotiation on
price.VestelDurableGoodsMarketingwasthe
firstcompanyinTurkeytoimplementsucha
transportationplanningsystem,andremained
theonlycompanyin2003.
The distribution planning program is run
daily to schedule deliveries to Vestel’s
customers. The planning process is
a part of
theorderfulfillmentprocess:
DecisionSupportSystems:ACaseStudyinVestelDurableGoodsMarketing
Number18,2006
117
OrderEntry
OrderAuthorization
DistributionPlanning
StockMovement
Billing
Distribution
MTMCAPABILITIES
MTMisatransportationoptimizationsoftware
program, which provides the optimal route
and truck planning for daily‐prepared
deliveries. The inputs to the system are
location of Vestel’s warehouses, transfer
stations, and its customers; customer orders,
transportation modes, and associated costs.
The optimization program uses these inputs
and finds
a solution within the constraints
imposedbythemanagementtominim izethe
totaltransportationcosts.Therouteandtruck
planningismadeaccordingtotheinputsand
theconstraints.
There are 3 different location types in MTM:
warehouse, transfer station, customer. All the
locationshavezipcodesgenera tedspecifically
for
MTM. These codes are different for each
province.Somebigprovincesaredividedinto
two or more regions. Th e distances between
eachtwozipcodesareputinanetworktable.
The distance between two points location in
thesamezipcodeissettobe3km.
VestelDurableGoods
MarketingInc.hastwo
warehouses, one in Manisa and the other in
Istanbul. There are 9 regions throughout
Turkey and the total number of transfer
station in these regions is 19. The logistics
companyownsandoperatesthesestations.
The volume information for each product is
providedasaninput
intothesystem.
Three different size trucks can be used for
transportation in addition to a direct cargo
alternative.Thecostsofusingeachalternative
are set in the system. 10‐wheel or 8‐wheel
trucks are used for the transportation to
transfer station from the warehouses. Small
trucks then make
the deliveries from the
transfer stations to the customers. There is
also a direct cargo alternative from the
warehouse in Manisa. Dealers with high
volume demand can have direct deliveries
with large trucks. MTM selects the direct
cargo option based on transportation costs.
Trucks utilizations constitute an important
criterionfor
decidingondeliverymode.
Themanagementuses twopoliciesrelatedto
efficiency and customer service. The first
policy is related to truck utilization.A truck
hastobeatleast65%fullinordertodepart
for its destination. Otherwise it waits until
this rate is achieved. The maximum waiting
time
is the other policy related to customer
service.Thiswaitingtimeisrestrictedtobeat
most 3 days to provide a good service to
distributors. After 3 days, even if a truck is
not65%full,itwillleavethewarehouseeither
by truck or by cargo, whichever is
more
efficient. MTM does not optimize truck
loading.SinceMTMdoesnotpla ninsidethe
truckaloadingproblemmayoccur.Giventhe
differenceinshapeofthevariousgoodsbeing
transported, not all items planned by MTM
may be loaded on a truck due to space
constraints. As a result,
volumes were
increasedtoenablethefeasibilityoftheplans
generated by the software. While truck load
optimization would be feasible for simple
deliveries between two points, the Vestel
distribution problem is significantly more
complex due to routes that have multiple
drop‐off points. As a result, the planning
objective
is not to find the loading that
maximizes truck utilization, but rather the
loadingthatallows forthebestunloadingof
LutfuSagbansua
JournalofQafqazUniversity
118
trucks without having to load and unload
differentitemsatthevariousdrop‐offpoints.
In 2002, Vestel scheduled on average 125
truckseverydayanddelivered49,000products
to1000differentlocationseverymonthusing
thisplanningsystem.
Table2.TransportationFigures
Year
Month Amount
Total
Scheduled
Truck
Volume
(dm
3
)
Cumula‐
tive
Truck
Utiliza‐
tion
January 41,153 18,667,200 61%
February 43,160 16,691,200 57%
March 35,594 17,062,400 57%
April 46,284 25,747,200 68%
May 58,658 32,291,200 64%
June 64,319 25,102,400 72%
July 60,552 35,147,200 70%
August 46,983 26,148,800 82%
September 43,418 20,894,731 85%
October 52,533 26,940,860 73%
November 69,612 32,733,792 66%
2002
December 68,257 25,111,986 76%
January 77,063 28,046,400 89%
February 82,877 25,745,600 91%
March 104,717 33,944,000 90%
April 115,406 31,480,000 95%
May 158,242 43,228,800 93%
2003
June 154,923 42,427,200 90%
IMPLEMENTATIONISSUESFORVESTEL
Theresultsobtainedfromtheimplementation
of Manugistics were phenomenal. The truck
utilization went up while the transportation
costsdecreasedbetween1999‐2003.
Table3.DecreaseinTotalTransportationCostfrom
1999to2003
1999 2000 2001 2002 2003
IndexTrans.
Cost/Sales
Revenue
100.00 119.92 96.69 84.08 81.32
IndexTrans.
Cost/Costof
GoodsSold
100.00 118.21 98.84 87.91 80.67
Indexof
TL/dm3
transporta‐
tion
100.00 109.82 124.61 158.93 163.12
In 2002, transportation costs were decreased
by 46% despite the increase in diesel prices
and increase in Consumer Price Index. The
unit cost of transportation per item went
downinsomecasesbyasmuchas75%.
Table4.TheUnitTransportationCostDecrease
Between1999‐2002
Products %ChangeinUSD
TV‐42.92%
WashingMachine‐47.36%
Refrigerator‐12.92%
DishWasher‐44.73%
MiniMusicPlayer(portable)‐68.62%
Midimusicplayer‐41.50%
Micromusicplayer‐28.64%
Smallhomeappliances‐51.25%
Receiver‐66.41%
Dishantenna‐33.52%
TVrack‐62.49%
Minirefrigerator‐48.97%
Carpetwashingmachine‐29.31%
Airconditioner(split)‐76.69%
Airconditioner(window)‐64.48%
Computer ‐66.20%
Aspirator ‐52.06%
Oven ‐60.77%
Stove ‐34.78%
Flasheater‐45.10%
Vacuumcleaner‐71.20%
In addition to the new planning system, a
numberofotherfactorswerealsoinstrumental
in achieving high utilization rates. First, the
number of orders entered manually into the
system decreased. The total volume also
increasedin2003.
Increaseinpre‐paidord ershelpedtoachieve
amoreevendistributionof
theorderswithin
amonth.
DecisionSupportSystems:ACaseStudyinVestelDurableGoodsMarketing
Number18,2006
119
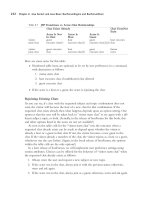
Table 5. Weekly Distribution of the Monthly Revenue and Truck Utilizations
FirstWeek SecondWeek ThirdWeek FourthWeek
2003Jan‐June
19.5% 20.8% 24.3% 35.4%
2002Jan‐June
10.28% 17.17% 19.91% 52.65%
WeeklyDistribution
2002Jan‐Dec
9.92% 18.42% 19.62% 52.04%
2003Jan‐June
93% 94% 71% 90%
2002Jan‐June
41% 44% 53% 79%
CumulativeTruck
Utilization
2002Jan‐Dec
78% 72% 75% 78%
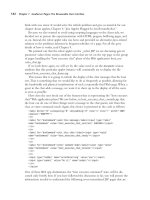
Figuresbelowreflecttheincreasedtruckutilizationratesandthetotalscheduledtruckvolumes.
Truckutilizationratesarecalculatedusingthefollowingformula:CumulativeTruckUtilization=
TotalTransportedVolume(dm
3
)/TotalScheduledTruckVolume(dm
3
).
Figure 1. Cumulative Truck Utilization (%)
Cumulative Truck Utilization
0%
10%
20%
30%
40%
50%
60%
70%
80%
90%
100%
January
February
March
April
May
June
July
August
September
October
November
December
January
February
March
April
May
June
2002 2003
Cumulative Truck
Utilization
Figure 2. Total Scheduled Truck Volume (dm
3
)
Total Scheduled Truck Volume (dm3)
0
5000000
10000000
15000000
20000000
25000000
30000000
35000000
40000000
45000000
50000000
January
February
March
April
May
June
July
August
September
October
November
December
January
February
March
April
May
June
2002 2003
Total Scheduled
Truck Volume (dm3)
LutfuSagbansua
JournalofQafqazUniversity
120
CONCLUSIONS
Decision support systems for supply chain
managementareafastgrowingsector of the
logisticssoftwareindustry.DSSswillcontinue
evolvingandadoptingstandardfeaturesand
interfacesinordertoadapttothecompetitive
environmentandprovidetheflexiblesolutions
requiredintoday’smarkets().Sincethebasic
data
that are required to make decisions are
being collected, there is a strong drive to
utilizethisinformationinsophisticatedways
to gain competitive advantage by improving
service and cutting supply chain costs.
‘Integration with ERP systems’, ‘Improved
optimization’,and‘Developmentofstandards’
are the current major trends in DSS
and
especially supply chain DSS and advanced
planningsystems.
ThesuccessthatVestelhasexperiencedatthe
endoftheimplementationofaDSSmodelin
the distribution planning process has once
againprovedtheimportanceandvitalroleof
DSSineffectivesupplychainpractices.
REFERENCES
Bechtel, C., Jayaram, J., (1997), “Supply Chain
Management: A strategic Perspective”, The
InternationalJournalofLogisticsManagement8,pp.
15‐34.
Christopher,M.,(1998),“LogisticsandSupplyChain
Management. Strategies for Reducing Cost and
Improving Service”, 2
nd
ed., Financial Times
Professional,London,UK.
Deutsch, C. H., (1996), “New Software Manages
SupplytoMatchDemand”,NewYorkTimes.
Feigin, G., An, C., Conners, D., Crawford, I., (1996),
“ShapeUp,ShipOut”,OR/MSToday,24‐30.
Fox, M. S., Chionglo, J.F., Barbuceanu, M., (1993),
“TheIntegratedSupplyChainManagementSystem”
Workingpaper,UniversityofToronto.
Hewitt, F., (1994), “Supply Chain Redesign”, The
InternationalJournalofLogisticsManagement,5,pp.
1‐9.
Lee, H. L., Billington, C., (1992), “Managing Supply
Chain Inventory: Pitfalls and Opportunities”, Sloan
ManagementReview,33(3),65‐73.
Proudlove, N. C., Vadera, S. K., Kobbacy, A. H.,
(1998), “Intelligent Management Systems in
Operations”,TheJournaloftheOperationalResearch
Society,Vol.49,No.7,pp.682‐699.
Ross, D. F., (1998), “Competing Through SupplY
Chain Management. Creating Market‐Winning
Strategies Through Supply Chain Partnerships”,
KluwerAcademicPublishers,Boston,MA,etal.
Simchi‐LeviD.,Kaminsky,P.,Simchi‐Levi,E.,(2000),
Designing and Managing the Supply Chain,
McGraw‐Hill,USA.
Swamithan, J. M., (1996), “Quantitative Analysis of
Emerging Practices in Supply Chains”, Ph.D.
Dissertation,GSIA,CarnegieMellonUniversity.
Swaminathan,J.M.,Smith,S.F.,Sadeh,N.M.,(1996),
“Modeling Supply Chain Dynamics: A Multiagent
Approach”,DecisionSciences.
Tan, B., Aksin, Z., (2004), “Vestel: Improving
Distribution Management and 3PL Relations”, Case
StudyforKocUniversity.
Vierck, K.R., (1981), “Decision Support Systems: An
MISManagerPerspective”,MISQuarterly,pp.35‐48.