Báo cáo khoa học: Functionally different pools of Shiga toxin receptor, globotriaosyl ceramide, in HeLa cells doc
Bạn đang xem bản rút gọn của tài liệu. Xem và tải ngay bản đầy đủ của tài liệu tại đây (549.81 KB, 14 trang )
Functionally different pools of Shiga toxin receptor,
globotriaosyl ceramide, in HeLa cells
Thomas Falguie
`
res
1,
*, Winfried Ro
¨
mer
1
, Mohamed Amessou
1
, Carlos Afonso
2
, Claude Wolf
3
,
Jean-Claude Tabet
2
, Christophe Lamaze
1
and Ludger Johannes
1
1 Laboratoire Trafic et Signalisation, Unite
´
Mixte de Recherche 144, Institut Curie ⁄ CNRS, Paris, France
2 Laboratoire de Chimie Structurale Organique et Biologique, Unite
´
Mixte de Recherche 7613, Universite
´
Pierre et Marie Curie, Paris, France
3 Centre Hospitalier Universitaire Saint-Antoine, Unite
´
Mixte de Recherche 538, INSERM ⁄ UMPC, Universite
´
Pierre et Marie Curie, Paris,
France
Globotriaosyl ceramide (Gb
3
or CD77) is a glyco-
sphingolipid that was initially described as the rare P
K
blood group antigen [1]. Gb
3
has also been identified
as a germinal center B-cell marker [2] that is overex-
pressed by Burkitt’s lymphomas [3] and other centro-
follicular lymphomas. More recent studies have
revealed that several hematopoietic malignancies and
solid tumors express Gb
3
[4,5]. The physiologic func-
tion of Gb
3
is still unknown. Some studies have
suggested that Gb
3
could regulate the function of
signaling molecules, such as type I interferon receptors
and CD19 [6]. Indeed, Gb
3
ligation has been shown to
lead to several signaling events such as apoptosis [7],
cytokine release [8], and nitric oxide production [9].
On Burkitt’s lymphoma B-cells, Gb
3
binding by nat-
ural ligands or antibodies has been shown to induce
apoptosis [7].
Gb
3
has also been identified as a pathogen receptor.
Although its exact role in HIV infection remains to be
established [10], it is well recognized that Gb
3
is the
Keywords
globotriaosyl ceramide; HeLa cells;
membrane microdomains; molecular
species; Shiga toxin
Correspondence
L. Johannes, Unite
´
Mixte de Recherche
144, Institut Curie ⁄ CNRS, 26 rue d’Ulm,
75248 Paris cedex 05
Fax: +33 1 42 34 65 07
Tel: +33 1 42 34 63 51
E-mail:
*Present address
University of Geneva, Science II, Depart-
ment of Biochemistry, Geneva, Switzerland
(Received 4 July 2006, revised 23 August
2006, accepted 27 September 2006)
doi:10.1111/j.1742-4658.2006.05516.x
Many studies have investigated the intracellular trafficking of Shiga toxin,
but very little is known about the underlying dynamics of its cellular recep-
tor, the glycosphingolipid globotriaosyl ceramide. In this study, we show
that globotriaosyl ceramide is required not only for Shiga toxin binding to
cells, but also for its intracellular trafficking. Shiga toxin induces globotria-
osyl ceramide recruitment to detergent-resistant membranes, and subse-
quent internalization of the lipid. The globotriaosyl ceramide pool at the
plasma membrane is then replenished from internal stores. Whereas endo-
cytosis is not affected in the recovery condition, retrograde transport of
Shiga toxin to the Golgi apparatus and the endoplasmic reticulum is
strongly inhibited. This effect is specific, as cholera toxin trafficking on
GM
1
and protein biosynthesis are not impaired. The differential behavior
of both toxins is also paralleled by the selective loss of Shiga toxin associ-
ation with detergent-resistant membranes in the recovery condition, and
comparison of the molecular species composition of plasma membrane
globotriaosyl ceramide indicates subtle changes in favor of unsaturated
fatty acids. In conclusion, this study demonstrates the dynamic behavior of
globotriaosyl ceramide at the plasma membrane and suggests that globo-
triaosyl ceramide-specific determinants, possibly its molecular species com-
position, are selectively required for efficient retrograde sorting on
endosomes, but not for endocytosis.
Abbreviations
CTxB, cholera toxin B-subunit; DRM, detergent-resistant membrane; ER, endoplasmic reticulum; Gb
3
, globotriaosyl ceramide; PPMP,
1-phenyl-2-hexadecanoyl-amino-3-morpholino-1-propanol; STxB, Shiga toxin B-subunit; Tf, transferrin; TfR, transferrin receptor; TGN,
trans-Golgi network.
FEBS Journal 273 (2006) 5205–5218 ª 2006 The Authors Journal compilation ª 2006 FEBS 5205
cellular receptor of Shiga toxin and the closely related
verotoxins (or Shiga-like toxins). These are produced
by Shigella dysenteriae and by enterohemorrhagic
strains of Escherichia coli [11]. Notably, Shiga toxin-
producing E. coli O157:H7 has developed into an
emerging cause of foodborne illness, and has been
identified among the principal causes of postdiarrheal
hemolytic uremic syndrome leading to acute renal fail-
ure in infancy and childhood. The homopentameric
B-subunits of these toxins (STxB) bind to 10–15 mole-
cules of Gb
3
at the plasma membrane [12] and allow
the intracellular transport of the holotoxin and the
delivery of the monomeric catalytic A-subunit into the
cytosol, leading to the inhibition of protein biosynthe-
sis [13,14].
In numerous cell lines [15], it has been shown that Shi-
ga toxin follows the retrograde transport route from the
plasma membrane to the endoplasmic reticulum (ER),
via the early endosome and the Golgi apparatus, cir-
cumventing the degrading environment of the late endo-
cytic pathway [16–18]. The molecular mechanisms
underlying the most critical step in the retrograde route,
i.e. escape from the endocytic pathway, are beginning to
be unraveled. Shiga toxin transport from early⁄ recycling
endosomes to the trans-Golgi network (TGN) involves
the small GTPase Rab6a¢, soluble N -ethyl maleimide-
sensitive factor attachment protein receptor (SNARE)
complexes around the heavy chain t-SNAREs syntaxin
16 [19,20] and syntaxin 5 [21], clathrin [22,23], the phos-
phatidylinositol lipid-binding clathrin adaptor epsinR
[22], golgin-97 [24], and the GPP130 protein [25]. Fur-
thermore, evidence was provided for a role of membrane
microcompartmentalization in Shiga toxin sorting to the
retrograde route [26,27].
Although it is clear that Gb
3
is critical for Shiga
toxin binding to cells, very few studies have aimed at
investigating the lipid directly. A correlation has been
described between the sensitization of cells to Shiga
toxin following exposure to butyric acid and the
change of the molecular species composition of the cel-
lular Gb
3
[28,29]. In in vitro binding assays, the fatty
acid chain of Gb
3
was found to influence the binding
to Shiga toxin [30,31].
In this study, we investigated the Gb
3
distribution
and dynamics underlying the internalization and retro-
grade transport of Shiga toxin, a poorly described
aspect of the cell biology of this pathogenic protein.
Gb
3
was surprisingly dynamic, in that after its Shiga
toxin-induced internalization, the plasma membrane
pool of Gb
3
rapidly recovered. However, we observed
that retrograde transport to the Golgi apparatus and
the ER was significantly less efficient on recovered Gb
3
than under control conditions, whereas internalization
was not affected. In parallel, Shiga toxin association
with detergent-resistant membrane (DRM) was
reduced in the recovery condition. Using appropriate
controls, i.e. another glycosphingolipid-binding pro-
tein, cholera toxin, we created an experimental situ-
ation in which the Shiga toxin–Gb
3
system was
selectively targeted, and our data strongly suggest the
existence of plasma membrane Gb
3
pool-specific fac-
tors, possibly the molecular species composition of
Gb
3
itself, that are selectively required for efficient ret-
rograde transport.
Results
Gb
3
is required for retrograde transport of Shiga
toxin from endosomes to the TGN
The glycosphingolipid Gb
3
is required for Shiga toxin
binding to cells, but it is not known to what extent it is
also involved in later steps of retrograde toxin trans-
port. To address this question, we treated HeLa cells
with the glucosylceramide synthase inhibitor 1-phenyl-2-
hexadecanoyl-amino-3-morpholino-1-propanol (PPMP)
to reduce cellular Gb
3
to levels below 5% of those in
untreated control cells. Under these conditions, the
4 °C binding protocol used for control cells does not
allow detectable amounts of STxB to associate with
cells. Therefore, the cells were continuously incubated
with high concentrations of STxB to permit endocytosis
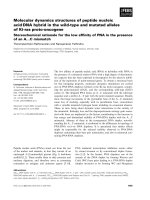
by fluid-phase uptake. Whereas in control cells, STxB
efficiently colocalized with the Golgi marker CTR433
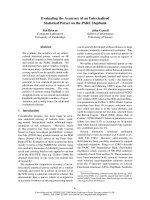
(Fig. 1A, upper panel), it failed to do so in PPMP-trea-
ted cells (Fig. 1A, lower panel), in which the protein
remained in the endocytic pathway, partly colocalized
with the transferrin receptor (TfR) (Fig. 1B, lower
panel). Using sensitive biochemical assays (sulfation
and glycosylation assays [32]), it was confirmed that
STxB did not enter the retrograde route in PPMP-trea-
ted cells (data not shown). These studies thus demon-
strate that Gb
3
is required for Shiga toxin transport
from endosomes to the TGN, and that no other cellular
component can substitute for this activity.
Shiga toxin recruits Gb
3
to DRMs
The above-described experiment shows that Gb
3
is
critical not only for Shiga toxin binding to cells, but
also for intracellular toxin trafficking. The question
then arises as to whether Shiga toxin in return influen-
ces the cellular properties of Gb
3
. In a first experiment,
we analyzed whether Shiga toxin would recruit Gb
3
to
DRMs. Conditions were established in which, at
steady state, about 10% of cellular Gb
3
was in DRM
Gb
3
dynamics in HeLa cells T. Falguie
`
res et al.
5206 FEBS Journal 273 (2006) 5205–5218 ª 2006 The Authors Journal compilation ª 2006 FEBS
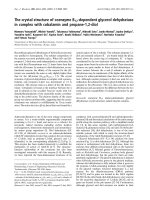
fraction 2 (Fig. 2A,B). After incubation of cells with
STxB at saturating concentrations, Gb
3
association
with DRMs was increased 2.5-fold. Gb
3
thus behaved
like protein receptors whose association with mem-
brane microdomains of the raft type often increases
upon ligand binding.
Plasma membrane dynamics of Gb
3
In the next step, we investigated how Shiga toxin
influences the plasma membrane dynamics of Gb
3
.
Ultrastructural studies on lipids are difficult because of
several limitations, such as lack of antibodies, and fix-
ation procedures that keep lipids in place during
immunostaining. We therefore chose a biochemical
approach in which the plasma membrane of HeLa cells
was enriched on density gradients following cell surface
silica coating [33]. The plasma membrane fraction was
characterized using several compartment-specific mark-
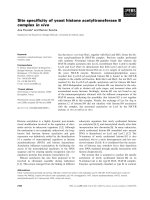
ers (Fig. 3A). On average, about 90% of the plasma
membrane marker alkaline phophodiesterase was
recovered in this fraction. The DRM markers caveolin-1
and flotillin-1 were also highly enriched in the plasma
membrane fraction (Fig. 3A). The preparation con-
tained 10% of total protein, and low amounts of other
compartment markers such as Golgi (mannosidase,
4%), lysosomes (b-hexosaminidase, 20%), ER (calnex-
in, 9%), and early endosomes (EEA1, 5%) (Fig. 3A).
The amounts of Gb
3
and cholesterol in the plasma
membrane-enriched fractions were then quantified. It
was found that about 50% of the Gb
3
and 56% of the
cholesterol were present at the plasma membrane of
HeLa cells at steady state (Fig. 3A). These values may
be overestimates, considering the contamination of the
plasma membrane fractions by other organelles (see
above).
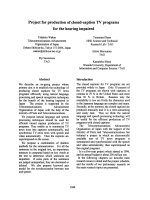
The plasma membrane dynamics of Gb
3
was then
studied using the protocol described in Fig. 3B. HeLa
cells were incubated on ice with saturating concentra-
tions of STxB, and after different periods of time at
37 °C (0–60 min), the proportion of Gb
3
in plasma
membrane fractions was determined. At the 0 min time
point, about 50% of Gb
3
was in plasma membrane
fractions (Fig. 3C), as described above (Fig. 3A). Fol-
lowing a short incubation at 37 °C, a transient
decrease of Gb
3
in these fractions to 28% was
observed. Sixty minutes after the shift to 37 °C, a time
point at which STxB is quantitatively localized in the
Golgi apparatus [17], Gb
3
levels in plasma membrane
fractions returned to 45%, which is somewhat lower
than the levels found on control cells (Fig. 3C). How-
ever, with the current sample size, this difference was
not statistically significant. This 60 min time point was
termed the ‘recovery condition’ (Fig. 4). Three days
after STxB internalization, Gb
3
levels in plasma mem-
brane fractions were close to those found in the recov-
ery condition (Fig. 3C).
These experiments led to the conclusion that Gb
3
was cointernalized with Shiga toxin, and that the
plasma membrane pool of Gb
3
was then rapidly
replenished with Gb
3
from internal stores.
Cell biological analysis of the recovery condition
As the steady-state plasma membrane Gb
3
pool was
mobilized by Shiga toxin internalization and then
recovered, we tested whether this resulted in changes
of STxB binding to cells. For this, a protocol like the
one described in Fig. 3B was used. However, instead
A
B
Fig. 1. Gb
3
-dependent retrograde transport of STxB. HeLa cells
that were pretreated for 6 days PPMP (+ PPMP) or control cells
were incubated for 45 min at 37 ° C continuously with 25 l
M
(0.25 mgÆmL
)1
) STxB for PPMP-treated cells, or after prebinding
with 1 l
M STxB for control cells. Cells were fixed and permeabi-
lized. STxB and the Golgi marker CTR433 (A) or the endosomal
marker TfR (B) were visualized by indirect immunofluorescence.
Note that in PPMP-treated cells, STxB does not colocalize with the
Golgi marker and partially overlaps with TfR labeling [arrows in (B)],
whereas the protein is efficiently accumulated in the Golgi appar-
atus in control cells. Bars: 10 lm.
T. Falguie
`
res et al. Gb
3
dynamics in HeLa cells
FEBS Journal 273 (2006) 5205–5218 ª 2006 The Authors Journal compilation ª 2006 FEBS 5207
of applying the plasma membrane enrichment proce-
dure at the end of each incubation period at 37 °C,
radiolabeled [
125
I]STxB was bound to the cells on ice.
At the 0 min time point, [
125
I]STxB binding was
strongly reduced, as expected (Fig. 5A). Upon incuba-
tion at 37 °C, binding then readily recovered, parallel-
ing the recovery of plasma membrane Gb
3
described in
Fig. 3C. The plateau level of [
125
I]STxB rebinding to
cells was reached after 60 min at 82% (Fig. 5A). These
results thus confirm the Gb
3
quantification data of
Fig. 3C.
Seventy-eight percent of the binding sites found on
control cells were still detected on recovery cells, as
shown by Scatchard analysis, and the apparent affinity
of STxB for cells was not significantly changed
(Table 1). In control cells, K
d
values and numbers of
binding sites per cell were in good agreement with our
previous studies [26]. To create a control condition that
simulates the slight loss of binding sites, as observed in
the recovery condition, Gb
3
levels were reduced using a
5 h treatment with the glucosylceramide synthase inhib-
itor PPMP (‘PPMP condition’, Fig. 4). This treatment
A
B
C
Fig. 3. Plasma membrane dynamics of Gb
3
. (A) HeLa cell plasma membrane was enriched using the silica-coating method. The total lysate
and plasma membrane-enriched fractions were characterized for total protein, DRM markers caveolin-1 and flotillin-1, cholesterol, and several
compartment-specific markers: alkaline phosphodiesterase (plasma membrane), mannosidase (Golgi apparatus), b-hexosaminidase (lyso-
somes), calnexin (ER), and EEA1 (early endosomes). The percentage of Gb
3
in the plasma membrane fraction was determined by glycolipid
extraction and TLC overlay (dashed bar). Results are presented as the plasma membrane fraction ⁄ total lysate signal ratio, and means
(± SEM) of five independent experiments are shown. (B) Schematic representation of the recovery experiments. After STxB binding to HeLa
cells for 30 min at 4 °C, the cells were shifted for the indicated times to 37 °C. The cells were then either processed for plasma membrane
enrichment and Gb
3
quantification [see (C)], or incubated at 4 °C with [
125
I]STxB in a rebinding assay (Fig. 5A). (C) Presence of Gb
3
in plasma
membrane fractions at the indicated times after the shift to 37 °C, following STxB binding on ice. See (B) for the experimental protocol. The
60 min time point was termed the ‘recovery condition’. The chi-square test showed that the observed differences in Gb
3
levels in plasma
membrane fractions are significant (P<0.001) for the 5 and 10 min time points (indicated by *), and not significant for the 60 min and 3 day
time points (indicated by #).
AB
Fig. 2. STxB recruits Gb
3
to DRMs. (A) HeLa cells were incubated (+ STxB) or not incubated (– STxB) with 1 lM STxB for 30 min at 4 °C.
After washes, cells were lysed in 1% Triton X-100, and DRMs were prepared. After extraction of neutral glycolipids, Gb
3
was quantified
in each fraction using TLC and overlay assays. DRMs are enriched in fraction 2. The percentage of Gb
3
in the DRM fraction is indicated.
(B) Means (± SEM) of three independent experiments as shown in (A).
Gb
3
dynamics in HeLa cells T. Falguie
`
res et al.
5208 FEBS Journal 273 (2006) 5205–5218 ª 2006 The Authors Journal compilation ª 2006 FEBS
led to a reduction of binding sites to about 75% of con-
trol levels without loss in affinity (Table 1). The num-
ber of binding sites for control, recovery and PPMP
conditions are reported in Fig. 4.
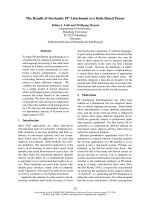
These three conditions (Fig. 4) were then used to
characterize a number of cell biological phenomena
related to retrograde transport to the ER. We found
that STxB enrichment in DRMs was significantly
reduced in the recovery condition, when compared to
the control and PPMP conditions (Fig. 5B). As we
had previously observed that DRM association corre-
lated with efficient retrograde transport [26], we tested
Shiga toxin trafficking to the Golgi apparatus and the
ER under all conditions. In the recovery condition, a
strong inhibition of sulfation on sulfation-site-carrying
STxB was observed (Fig. 5C), indicating that arrival
in the TGN was inhibited. In PPMP-treated cells,
sulfation was also reduced, reflecting at least in part
the lower number of binding sites under these condi-
tions. However, comparing the PPMP and recovery
conditions, it can be stated that sulfation was more
than three-fold more strongly inhibited in the recovery
condition, due to a direct effect on retrograde trans-
port. Glycosylation analysis was used to confirm these
observations (Fig. 5D). Indeed, this assay allows
measurement of the relative quantity of glycosylated,
ER-associated STxB over total cell-associated STxB
under given conditions, and is therefore insensitive to
differences in binding sites. Again, retrograde trans-
port of STxB was inhibited about three-fold under
recovery conditions, while 5 h of PPMP treatment
had only a minor effect (Fig. 5D). Using the same
technique, we also analyzed retrograde transport effi-
ciency several days after a first-wave internalization
(Fig. 5E). We found that even if the Gb
3
pool is lar-
gely restored at the plasma membrane within an hour
of first-wave STxB internalization (Fig. 3C), the arri-
val of second-wave STxB in the ER is still partially
impaired after up to 3 days (Fig. 5E). This surprising
persistence of the recovery phenotype could be
explained by the fact that the amount of cell-associ-
ated STxB remains the same between 60 min and
3 days of first-wave STxB internalization (Fig. 5F,
Cells), indicating that once STxB is present in the
Golgi apparatus, it remains stably associated with the
cells. This material might be capable of sequestering
neo-synthesized Gb
3
or hypothetical licensing factors
(see Discussion).
As opposed to retrograde transport to the TGN and
the ER, endocytosis of STxB was not inhibited in the
recovery condition (Fig. 6A), and neither was that of
transferrin (Tf) (Fig. 6B). These results document the
specificity of the recovery effect, and show that
whereas STxB can enter cells independently of its
association with DRMs, the efficiency of intracellular
sorting to the retrograde route strongly correlates with
its presence in DRM fractions, consistent with our pre-
vious work [26].
To test the specificity of the recovery phenotype, we
then measured retrograde transport of cholera toxin to
the TGN. Cholera toxin also binds to a glycosphingo-
lipid, the ganglioside GM1, is associated with DRMs,
and follows the retrograde route to the ER [34]. A
sulfation site-carrying peptide was chemically coupled
to cholera toxin B-subunit (CTxB). When sulfation
analysis was performed under the same conditions as
those of Fig. 5C, it became apparent that cholera toxin
transport in the retrograde route was not affected in
the recovery condition (Fig. 6C). Furthermore, CTxB
association with DRMs was, if anything, increased
(Fig. 6D), and cholesterol levels in plasma membrane
fractions were similar in the control and recovery con-
ditions (Fig. 6E). To rule out a possible toxic effect of
a contaminant in our STxB preparation, protein bio-
synthesis was measured after 1 or 72 h of internalizat-
ion of first-wave STxB. No significant difference in
protein biosynthesis could be detected in comparison
with nontreated cells, whatever the duration of STxB
internalization (Fig. 6F). No effect on cell division was
detected (data not shown). These data show that the
Fig. 4. Schematic representation of control,
recovery and PPMP conditions. STxB bind-
ing to Gb
3
leads to clustering of the lipid, as
suggested from the DRM association data
of Fig. 2. The number of STxB-binding sites
is indicated as a percentage of control for
each condition. See text for further details.
T. Falguie
`
res et al. Gb
3
dynamics in HeLa cells
FEBS Journal 273 (2006) 5205–5218 ª 2006 The Authors Journal compilation ª 2006 FEBS 5209
recovery phenotype is restricted to the STxB–Gb
3
sys-
tem, and presents a highly selective way of interfering
with its dynamics while leaving many other membrane
parameters intact.
Analysis of the molecular species compositions
of Gb
3
pools
Several studies have suggested that specific molecular
species of Gb
3
are correlated with efficient retrograde
transport [28,29]. Therefore, we analyzed the molecular
species composition of the plasma membrane and
internal pools of Gb
3
, under both control and recovery
conditions (Fig. 7). After plasma membrane or DRM
enrichment, glycolipids were extracted, and Gb
3
was
isolated from TLC plates and analyzed by nanospray
tandem MS. The proportion of each molecular species
in the analyzed fractions was determined. Owing to
technical limitations, only the most abundant lipids
could be detected.
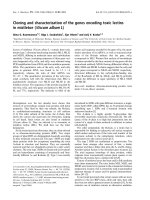
In adherent HeLa cells, the most abundant mole-
cular species were C16:0, C22:0, C24:0, and C24:1
(Fig. 7). This composition was similar to the one previ-
ously described for human astrocytoma cells [29], with
A B
D
F E
C
Fig. 5. Shiga toxin trafficking in the recovery condition. (A) Rebinding assay following a protocol as described in Fig. 3B. In the recovery con-
dition (60 min shift to 37 °C), the plateau of rebinding was reached. (B) DRM preparations under control (black bars), PPMP (white bars) and
recovery (dashed bars) conditions. Results are represented as the percentage of STxB present in each fraction of the gradients, including
DRM fraction 2. Note that in the recovery condition, STxB association with DRM was reduced. (C) Sulfation assay. After prebinding of
STxB–Sulf
2
, cells were incubated for 20 min at 37 °C in the presence of radioactive sulfate. Sulfation of STxB–Sulf
2
was reduced in PPMP
conditions (reduced Gb
3
expression in cells), and strongly reduced under recovery conditions, indicating that retrograde transport to the TGN
was inhibited. (D) Glycosylation assay. After prebinding of [
125
I]STxB–Glyc–KDEL, cells were incubated for 4 h at 37 °C. In the recovery con-
dition, retrograde transport to ER was strongly inhibited, as indicated by reduced glycosylation of [
125
I]STxB–Glyc–KDEL (arrow). (E) Progres-
sive restoration of STxB glycosylation efficiency after several days of recovery. Experiments were performed as in (D), with the following
modifications: [
125
I]STxB–Glyc–KDEL was bound to cells after 0–3 days of recovery, as indicated, and this was followed by 16 h incubations
at 37 °C. (F) First-wave internalized STxB remains stably associated with cells. Prebound iodinated STxB was incubated with HeLa cells at
37 °C for 0, 1, 24, 48 or 72 h. Using trichloroacetic acid precipitation (see Experimental procedures), cell-associated STxB (Cells), STxB in
the culture medium (Culture Med.) and degraded STxB were determined for each time point. For each assay, means of three independent
experiments (± SEM) are shown.
Gb
3
dynamics in HeLa cells T. Falguie
`
res et al.
5210 FEBS Journal 273 (2006) 5205–5218 ª 2006 The Authors Journal compilation ª 2006 FEBS
the exception of C24:1, which was more abundant in
our HeLa cell clone. We observed, however, that
another clone, HeLa S3, had lower levels of C24:1
(data not shown). The Gb
3
molecular species composi-
tion was similar in plasma membrane (Fig. 7A) and
internal pools (Fig. 7B), indicating that at steady state,
Gb
3
localization is not dictated by parameters such as
membrane thickness. As a further test, we compared
the molecular species composition of Gb
3
in DRMs
before and after recruitment by STxB (Fig. 7C).
Again, the results were similar under both conditions.
When comparing the molecular species compositions
of control and recovery conditions in each preparation,
it became apparent that they were also very similar.
The only notable exceptions were the C22:1 and C23:1
species in plasma membrane fractions, which were
enriched two-fold in the recovery condition. However,
it must be noted that C22:1 and C23:1 are minor spe-
cies, and it remains to be determined directly to what
extent such subtle differences in the overall species
profile can account for the major effects that were
observed in the recovery condition on DRM associ-
ation and retrograde transport.
Discussion
Owing to technical limitations, very little is known
about the dynamics and intracellular transport of
sphingolipids. In this study, we used a plasma mem-
brane enrichment method to analyze the dynamics of
the Shiga toxin receptor Gb
3
. We found that Gb
3
was
mobilized during Shiga toxin internalization, and the
plasma membrane Gb
3
pool was then rapidly replen-
ished from internal stores. Strikingly, retrograde trans-
port in the recovery condition was significantly less
efficient than in controls. We hypothesize that the
recovery and control conditions are explained by
plasma membrane steady-state Gb
3
pool-specific deter-
minants that modify the efficacy of retrograde trans-
port.
AB
C
F
E
D
Fig. 6. In-depth characterization of the recovery phenotype. (A) STxB endocytosis assay. No effect on STxB endocytosis was observed in
the recovery condition. (B) Tf endocytosis assay. No effect on Tf endocytosis was observed in the recovery condition. (C) Retrograde trans-
port assay with CTxB. Retrograde transport of CTxB to the TGN was not affected in the recovery condition, as determined by sulfation ana-
lysis. This is in striking contrast to retrograde transport of STxB (Fig. 5C). (D) In the recovery condition, the association of CTxB DRMs was
slightly increased. This is in striking contrast to the reduced DRM association of STxB under these conditions (Fig. 5B). (E) Cholesterol meas-
urement in plasma membrane fractions. The cholesterol content was measured at the plasma membrane in control and recovery HeLa cells.
No change was observed in the recovery condition. (F) Measurement of protein biosynthesis. HeLa cells were incubated or not with 1 l
M
STxB on ice, and this was followed by shift to 37 °C for 1 or 72 h. Protein biosynthesis was then measured by incorporation of [
35
S]methion-
ine. Results are expressed as a percentage of protein synthesis measured on control cells. For all experiments in this figure, means of at
least three independent experiments (± SEM) are shown.
Table 1. Scatchard analysis of control, PPMP and STxB-treated
HeLa cells. HeLa cells were mock-treated (Control) or treated with
5 l
M PPMP for 5 h (PPMP), or with 1 lM STxB for 30 min at 4°C,
followed by a 1 h internalization at 37°C (Recovery). Then, 30 n
M to
1 l
M [
125
I]STxB–Glyc–KDEL was bound to the cells for 2 h at 4°C.
After washes and lysis of the cells, the results were expressed as
a Scatchard representation, and K
d
and number of sites per cell
were deduced for each condition. Means (± SEM) of three different
experiments are shown.
Treatment K
d
(nM)
Number of sites
(· 10
6
per cell)
Control 30.5 ± 9.3 54.7 ± 3.7 (100%)
PPMP 23.3 ± 8.1 41.4 ± 4.6 (75%)
Recovery 26.2 ± 8.1 42.8 ± 4.1 (78%)
T. Falguie
`
res et al. Gb
3
dynamics in HeLa cells
FEBS Journal 273 (2006) 5205–5218 ª 2006 The Authors Journal compilation ª 2006 FEBS 5211
Many of our attempts to identify these pool-specific
determinants were not successful, in that no differences
could be detected between control and recovery condi-
tions for the following parameters: plasma membrane
cholesterol levels (Fig. 6E), protein biosynthesis
(Fig. 6F), band patterns of plasma membrane proteins
crosslinked to STxB, and STxB-induced cytoskeletal
rearrangements (data not shown). In our search for
these pool-specific determinants, we also analyzed the
molecular species composition of Gb
3
in plasma mem-
brane fractions under control and recovery conditions.
Indeed, a role for specific molecular species in Shiga
toxin trafficking and intoxication of cells had previ-
ously been hypothesized, based on the observation that
butyric acid treatment of cells leads to a change of the
molecular species composition of Gb
3
and to a con-
comitant sensitization to Shiga toxin [28,29]. Using
tandem MS, a two-fold increase in the recovery condi-
tion was selectively observed for two minor molecular
species, C22:1 and C23:1. Building on this finding,
future work will have to address two critical questions:
does Shiga toxin indeed induce the clustering of Gb
3
in lipid patches, and does spiking these patches with
low doses of specific molecular species lead to a loss of
microdomain organization? Response elements in favor
of the first point are the apparent capacity of Shiga
toxin to bind up to 15 Gb
3
molecules at a time [12]
(but see also [35]), and the recruitment of Gb
3
to
DRMs after ligation by STxB, as shown in this study.
As for the second point, it remains to be explained
how C22:1 and C23:1 species could have a strong
effect on DRM association despite the presence of
high quantities of another unsaturated species, C24:1,
in plasma membrane preparations from both control
and recovery conditions.
Another interpretation suggests that specific factors
are associated with the plasma membrane Gb
3
pool
under steady-state conditions. Upon first-wave Gb
3
binding by STxB, the activity of such factors would
be altered, in such a way as to reduce the efficiency
of retrograde transport in the recovery condition.
The existence of these factors remains hypothetical,
and as mentioned above, we have been unable to
identify recovery condition-specific STxB crosslinking
products. It must, of course, be considered that the
licensing factors might be cytosolic. For example,
several protein kinases are activated after Shiga toxin
binding to Gb
3
[36–41], and further work will be
required to address their potential functions in retro-
grade Shiga toxin transport in control and recovery
conditions.
A surprising finding of our study is that the recovery
phenotype can be perpetuated over several generations
of cell divisions. Indeed, 3 days after first-wave STxB
internalization, Gb
3
levels at the plasma membrane are
almost fully restored (Fig. 3C), but STxB targeting to
the retrograde route is still partially impaired
(Fig. 5E). One possible explanation of these unex-
pected results is the existence of licensing factors whose
activity would be required for Gb
3
association with
DRMs and ⁄ or correct sorting to the plasma mem-
brane. Even if neo-synthesized, these hypothetical fac-
tors would remain trapped in ER ⁄ Golgi structures that
contain first-wave internalized STxB–Gb
3
complexes
for at least 3 days. Similarly, neo-synthesized Gb
3
could be sequestered by free binding sites on ER ⁄
Golgi-localized first-wave-internalized STxB–Gb
3
com-
plexes.
In the recovery condition, the association of Shiga
toxin with DRMs was selectively reduced. In parallel,
retrograde transport to the TGN and the ER was spe-
cifically inhibited, without affecting toxin endocytosis.
These observations are consistent with the possibility
A
B
C
Fig. 7. Analysis of Gb
3
molecular species under control and recov-
ery conditions at the plasma membrane, on internal membranes,
and in DRMs. Plasma membrane (A), internal membranes (B) and
DRMs (C) of HeLa cells in control (white bars) and recovery (gray
bars) conditions were purified, Gb
3
was extracted, and molecular
species were analyzed by nanospray tandem MS-MS. Results rep-
resent the percentage of each detected molecular species of Gb
3
.
Means (± SEM) of three independent experiments are shown. In
some cases, error bars are too small to be seen.
Gb
3
dynamics in HeLa cells T. Falguie
`
res et al.
5212 FEBS Journal 273 (2006) 5205–5218 ª 2006 The Authors Journal compilation ª 2006 FEBS
that Shiga toxin can enter cells via several endocytic
routes. Indeed, it has been reported that, on the one
hand, Shiga toxin can be detected in clathrin-coated
vesicles [42], and on the other hand, interfering indi-
rectly [26,43] or directly [22,23] with clathrin function
has minimal effects on Shiga toxin endocytosis, show-
ing that Shiga toxin can enter cells efficiently via clath-
rin-independent endocytic mechanisms. As opposed to
its endocytosis, retrograde sorting of Shiga toxin on
early ⁄ recycling endosomes appears to be very selective.
Our previous studies have implicated membrane micro-
compartmentalization in the early⁄ recycling endo-
somes-to-TGN transport step [26]. These studies relied
in part on harsh cholesterol extraction conditions.
Therefore, it is of importance that the selective recov-
ery protocol, as presented in the current article, pro-
vides an independent confirmation. Two recent studies
have come to the conclusion that early ⁄ recycling endo-
somes-to-TGN transport is also dependent on clathrin
coats [22,23]. Although unexpected, the possibility of
clathrin-dependent trafficking implicating membrane
microdomains of the raft type is not entirely unpre-
cedented. Activation of the B-cell receptor induces
clathrin heavy chain phosphorylation in raft-type
microdomains [44], the endocytosis of DRM-associated
anthrax toxin is clathrin-dependent [45], and the epi-
dermal growth factor receptor could be localized in
nascent coated pits that almost invariably contained
raft membranes [46]. How raft-type microdomains
could favor clathrin-coated pit formation on the early
endosome remains to be established. Different scenar-
ios can be proposed, such as local overconcentration
of lipid-modifying enzymes whose activity would be
required for membrane recruitment of clathrin adaptor
proteins such as epsinR, a critical factor for efficient
retrograde transport at the early ⁄ recycling endosomes–
TGN interface [22].
In conclusion, our study provides evidence for the
existence of functionally different Gb
3
pools in cells.
These pools are in dynamic exchange and are likely to
be associated with factors that determine the efficiency
of retrograde transport to the ER. In agreement with
our earlier studies [22,26], the current work further
establishes that the critical step for Shiga toxin
trafficking into cells is its retrograde sorting on
early ⁄ recycling endosomes, via a mechanism that
depends on clathrin coats and involves membrane mic-
rocompartmentalization. However, further studies will
be necessary to precisely identify the licensing factors
necessary for Gb
3
association with DRM and ⁄ or sort-
ing at the plasma membrane and, more generally, to
unravel the molecular mechanisms involved in the
intracellular dynamics of the Gb
3
glycosphingolipid.
Experimental procedures
Cells and reagents
HeLa cells were cultured as previously described [16].
STxB, STxB–Glyc–KDEL, STxB–Sulf
2
, and STxB–K
3
were
purified as previously described [16,17,26]. Anti-CTR433
and anti-TfR H68.4 IgG, and cationic colloidal silica, were
kind gifts from M. Bornens (UMR 144-Institut Cur-
ie ⁄ CNRS, Paris, France), I. Trowbridge (The Salk Institute,
San Diego, CA), and D. Stolz (Department of Pathology,
Pittsburg, PA), respectively. The monoclonal (13C4) and
polyclonal antibodies against STxB were obtained as previ-
ously described [16,17]. PPMP (Calbiochem, La Jolla, CA),
Texas-red coupled anti-rabbit serum, fluorescein isothiocya-
nate-coupled anti-mouse serum and alkaline phosphatase-
coupled secondary antibodies (Jackson Immunoresearch,
West Grove, PA), HPTLC plates (Merck, Darmstadt,
Germany), enhanced chemifluorescence substrate (Amer-
sham Biosciences, Little Chalfont, UK), streptavidin cou-
pled to horseradish peroxidase (streptavadin–horseradish
peroxidase) (Roche, Basel, Switzerland), polyacrylic acid
(Aldrich, St Louis, MO), anti-calnexin, anti-[early endo-
somal antigen-1 (EEA1)] and anti-(caveolin-1) IgG (BD
Biosciences, San Diego, CA), anti-(flotillin-1) IgG (Santa
Cruz Biotechnology, Santa Cruz, CA) and immobilized
streptavidin (NHS–SS–biotin) (Pierce, Rockford, IL) were
obtained from the indicated commercial sources. Optiprep,
Nycodenz, SigmaCote, thymidine-5¢-monophosphate-p-
nitrophenyl ester, 4-methylumbelliferyl-d-mannopyranoside,
4-methylumbelliferyl-N-acetyl-b-d-glucosaminide, CTxB and
o-phenylenediamine dihydrochloride peroxidase substrate
were obtained from Sigma (St Louis, MO).
Immunofluorescence analysis on PPMP-treated
cells
HeLa cells were treated or not treated with 5 lm PPMP for
6 days. Immunofluorescence was determined as previously
described [17]. Briefly, cells were incubated with: (a) 25 lm
STxB for 45 min at 37 °C to allow its fluid-phase endocyto-
sis in PPMP-treated cells; or (b) 1 l m STxB bound at 4 °C
and then chased for 45 min at 37 °C after washes in control
cells. Cells were then fixed in 3% paraformaldehyde for
15 min at room temperature, quenched with ammonium
chloride, and permeabilized with 0.05% saponin. STxB, the
Golgi marker CTR433 and TfR were labeled with poly-
clonal anti-STxB, monoclonal anti-CTR433, or monoclonal
anti-TfR, and visualized with the use of adapted fluoro-
chrome-coupled secondary antibodies. Then, coverslips
were mounted and analyzed by confocal microscopy (Leica
Microsystems, Mannheim, Germany). At the same time,
the loss of Gb
3
expression from cells treated with PPMP
was verified using the glycolipid extraction procedure (see
below).
T. Falguie
`
res et al. Gb
3
dynamics in HeLa cells
FEBS Journal 273 (2006) 5205–5218 ª 2006 The Authors Journal compilation ª 2006 FEBS 5213
Glycolipid extraction and analysis by TLC
Glycolipid extraction was performed as previously des-
cribed [26]. Briefly, HeLa cells were lysed in water and
subjected to partition against chloroform to separate the
neutral lipids from the other cellular components. After
saponification for 1 h at 56 °C in methanol ⁄ KOH, the
products were re-extracted with chloroform, dried under
nitrogen, and spotted onto HPTLC plates. After migra-
tion in chloroform ⁄ methanol ⁄ water (65 : 25 : 4), the
plates were overlaid with STxB, polyclonal anti-STxB and
alkaline phosphatase-coupled serum, and visualized by
enhanced chemifluorescence; Gb
3
expression was then
quantified.
Plasma membrane enrichment and
characterization
We used a published procedure [33] with some modifica-
tions. For each enrichment experiment, 10
8
HeLa cells were
used. The cells were trypsinized, incubated or not with
1 lm of STxB on ice, and then shifted for 1 h to 37 °C.
After this point of the procedure, all plastic and glass
materials were coated with SigmaCote. After washes in ice-
cold NaCl ⁄ P
i
and plasma membrane-coating buffer
(PMCB) [20 mm 2-(N-morpholino)ethanesulfonic acid,
150 mm NaCl, 280 mm sorbitol], cells were incubated in a
glass tube with 2% cationic colloidal silica in PMCB, and
then neutralized with 1 mgÆmL
)1
polyacrylic acid in
PMCB. After washes in PMCB, cells were mechanically
lysed in 1.3 mL of lysis buffer (2.5 mm imidazole, pH 7.0)
through needles: 24 times with G22, and 12 times with
G27. Lysates were mixed with 1 mL of 100% Nycodenz
(50% final) and overlaid on 0.5 mL of 70% Nycodenz in
an SW55 centrifuge tube. The rest of the lysate (300 lL)
was used for the characterization of the procedure. Tubes
were filled to 5 mL with lysis buffer and spun for 25 min
at 20 000 g at 4 °C in a swinging bucket rotor (SW55,
Beckman Coulter, Fullerton, CA). The supernatant was
collected, and the silica content in the pellet and the 50–
70% interface were washed in lysis buffer, mixed in 50%
Nycodenz, and submitted to another ultracentrifugation
under the same conditions. The supernatant was collected
and mixed with the first one. The pellet was washed three
times with lysis buffer and resuspended in 1 mL of the
same buffer for further analysis.
Lysates and plasma membrane fractions were character-
ized for their content of total proteins (Bradford Protein
Assay; BioRad, Hercules, CA) and several organelle mark-
ers. The plasma membrane marker alkaline phosphodiest-
erase was colorimetrically assessed in 100 mm Tris ⁄ HCl
(pH 9.0) ⁄ 40 mm CaCl
2
using 2 mgÆmL
)1
thymidine-5¢-
monophosphate-p-nitrophenyl ester as substrate; after
30 min, absorbance at 400 nm was detected. The Golgi
marker mannosidase II was assessed fluorometrically in
NaCl ⁄ P
i
containing 0.1% Triton X-100 using 5 mm 4-
methylumbelliferyl-d-mannopyranoside as substrate. The
lysosomal marker b-hexosaminidase was also assessed
fluorometrically in 10 mm citric acid ⁄ 30 mm Na
2
HPO
4
(pH 4.5) with 0.1% Triton X-100 and 2.3 mgÆmL
)1
4-meth-
ylumbelliferyl-N-acetyl-b-d-glucosaminide as substrate. For
the last two fluorometric assays, fluorescence was read after
30 min at 37 °C with excitation at 355 nm and emission at
460 nm. Free cellular cholesterol content was measured as
described [26]. The ER marker calnexin, the early endosom-
al marker EEA1 and the DRM markers caveolin-1 and flo-
tillin-1 were assessed by western blot after migration on
10% SDS ⁄ PAGE, semidry transfer (BioRad) on nitrocellu-
lose membrane, and successive incubation with primary
antibodies and alkaline phosphatase-coupled secondary
antibodies. After visualization with enhanced chemifluores-
cence and scanning of membranes with phosphorimager
(Amersham Biosciences) in the blue chemiluminescence
mode, signals were quantified with imagequant (Amer-
sham Biosciences). Results were expressed as the percentage
of marker in the plasma membrane fraction compared to
the total lysate.
Biochemical analysis of STxB retrograde
transport, association with DRMs, degradation
and recycling
These experiments were done on HeLa cells in 24-well
plates (10
5
cells per well) under the indicated control,
PPMP (5 lm for 5 h at 37 °C), or recovery conditions.
STxB–Glyc–KDEL iodination, glycosylation and Scatchard
analysis were performed as previously described [16]. Sulfa-
tion analysis was performed as previously described [17],
with similar results being obtained for 30 min or 4 h incu-
bations. Iodinated STxB–Glyc–KDEL was used to measure
the association of STxB with DRM. DRMs were isolated
as previously described, and fraction 2 of each gradient was
characterized as the DRM fraction that contains GM
1
and
no TfR [26].
Degradation and recycling of first wave-internalized
STxB were measured as follows. Prebound iodinated
STxB–Glyc–KDEL was internalized into HeLa cells at
37 °C for 0, 1, 24, 48 or 72 h. Culture supernatants and
cell lysates in 0.1 m KOH were submitted to 10%
trichloroacetic acid precipitation for 30 min at 4 °C. After
centrifugation at 13 000 g for 30 min at 4 °C in a bench-
top centrifuge (Eppendorf, Hamburg, Germany), trichloro-
acetic acid-precipitated and soluble materials were
analyzed using a gamma-counter. Culture supernatant
STxB was expressed as trichloroacetic acid-precipitated
counts in the culture supernatant, and degraded STxB as
trichloroacetic acid-soluble counts in culture supernatant
and cell lysates.
Gb
3
dynamics in HeLa cells T. Falguie
`
res et al.
5214 FEBS Journal 273 (2006) 5205–5218 ª 2006 The Authors Journal compilation ª 2006 FEBS
Biochemical analysis of CTxB transport and
association with DRMs
CTxB was chemically coupled to a biotinylated peptide car-
rying a tandem sulfation site to obtain the coupling product
termed CTxB–Sulf
2
–biotin. The details of this procedure
have been published elsewhere [47]. Experiments were per-
formed on 24-well plates with 10
5
HeLa cells per well. After
sulfate depletion, cells were incubated or not with 1 lm
STxB on ice, and shifted for 1 h to 37 °C. CTxB–Sulf
2
–bio-
tin (0.5 lm) was then bound to these cells at 4 °C, and this
was followed by incubation for 4 h at 37 °C with 300 lCi
of Na
2
[
35
S]O
4
(Amersham Biosciences) per well. After
washes, cells were lysed in 1 mL of RIPA buffer (NaCl ⁄ P
i
with 1% NP40, 0.5% deoxycholate and 0.5% SDS), and
CTxB–Sulf
2
–biotin was precipitated with immobilized
streptavidin. Lysates were loaded on Tris ⁄ Tricine gels and,
after autoradiography with a phosphorimager (Amersham
Biosciences), sulfation bands of CTxB–Sulf
2
–biotin were
quantified with the imagequant software (Amersham Bio-
sciences). As an internal control, the total sulfation in each
condition was determined by trichloroacetic acid precipita-
tion, as previously described [17].
To analyze CTxB association with DRMs, HeLa cells
were incubated or not with 1 lm STxB on ice, and shifted
for 1 h to 37 °C. CTxB (0.5 lm) was then bound to these
cells for 30 min at 4 °C. After lysis, DRMs were pre-
pared as described [26], and the percentage of CTxB associ-
ated with DRMs was determined by quantitative western
blotting.
Measurement of protein biosynthesis
HeLa cells were cultured in 96-well plates, incubated or not
with 1 lm STxB on ice, and shifted for 1 h or 3 days to
37 °C. After washes, protein biosynthesis was determined
using [
35
S]methionine incorporation, as previously described
[48]. Briefly, cells were incubated with 1 lCi of [
35
S]methi-
onine in NaCl ⁄ P
i
per well for 1 h at 37 °C. After washes
with 5% trichloroacetic acid and ice-cold NaCl ⁄ P
i
, 200 l L
of scintillant (OptiPhase ‘Supermix’) was added to each well
and the radioactivity associated with cells was counted
using a Perkin-Elmer (Wellesley, MA) 1450 MicroBeta Tri-
lux liquid scintillation counter. Background radioactivity
was deducted from each value, and the level of protein syn-
thesis under recovery conditions was calculated as a per-
centage of protein synthesis detected on mock-treated cells.
STxB and Tf internalization assays
HeLa cells were used under the same conditions as des-
cribed above. STxB–K
3
was coupled to NHS–SS–biotin fol-
lowing the manufacturer’s instructions, and the resulting
protein (STxB–SS–biotin) was used to measure STxB inter-
nalization, as previously described [22]. Briefly, 1 lm STxB–
SS–biotin was bound to cells under control, recovery and
PPMP conditions. The cells were then incubated from 0 to
40 min at 37 °C. After washes, cells were split in to two
equal fractions that were incubated or not with the non-
membrane-permeable reducing agent 2-mercaptoethanesulf-
onic acid at 4 °C for 20 min. After quenching of 2-
mercaptoethanesulfonic acid with iodoacetamide, the cells
were lysed in blocking buffer (10 mm Tris ⁄ HCl, pH 7.4,
1mm EDTA, 50 mm NaCl, 0.2% BSA, 0.1% SDS, and
1% Triton X-100), lysates were transferred into 96-well
plates precoated with mouse monoclonal anti-STxB 13C4,
and STxB–SS–biotin was visualized with streptavidin–
horseradish peroxidase and o-phenyldiamine dihydrochlo-
ride. The reaction was stopped with 3 m sulfuric acid, and
plates were read at 490 nm. The percentage of internal
STxB was determined as the ratio of signal after 2-merca-
ptoethanesulfonic acid reduction (internal STxB) and signal
without reduction (total STxB).
Tf was charged with Fe
3+
and then radiolabeled with
iodine (Amersham Biosciences) using Iodo-beads (Pierce),
according to the manufacturer’s instructions. The specific
activity of [
125
I]Tf was approximately 1200 c.p.m. per ng.
[
125
I]Tf (25 nm) was bound to cells at 4 ° C, and shifted for
0–32 min to 37 °C. After washes, cells were acid stripped,
and lysed in 0.1 m KOH, and the remaining cell-associated
radioactivity was measured using a gamma-counter (Perkin-
Elmer). Internal Tf was determined as the ratio of radio-
activity after acid wash (internal Tf) and signal without
acid wash (total cell-associated Tf).
Analysis of Gb
3
molecular species
For each analysis, 10
8
HeLa cells for plasma membrane
enrichment and 10
7
HeLa cells for DRM analysis were
incubated or not with 1 lm STxB on ice, and shifted for
1 h to 37 °C. After washes in ice-cold NaCl ⁄ P
i
and PMCB,
plasma membrane and internal fractions were separated
using the plasma membrane enrichment procedure, and the
efficiency of the assay was analyzed by fluorimetric and
colorimetric methods, as described above. Glycolipids were
extracted as described above and separated on TLC. After
migration, silica was recovered from the TLC plate at the
level of standard Gb
3
(Matreya, Pleasant Gap, PA) and
placed in new glass tubes. Gb
3
was re-extracted from silica
by two cycles of butanol ⁄ water partition (1 mL of each),
and the Gb
3
-containing butanol phase was evaporated
under nitrogen.
Analysis of the Gb
3
molecular species composition was per-
formed using an ion trap instrument coupled with a nanoelec-
trospray ion source (Esquire 3000; Bruker Daltonics,
Bremen, Germany), operated using the negative mode. Ion
accumulation time was controlled by the ion charge control
system of the instrument (target 20 000). A potential of
) 650 V was applied on the counter electrode. Samples were
dissolved in 35 lL of chloroform ⁄ methanol ⁄ water (5 : 7 : 2).
T. Falguie
`
res et al. Gb
3
dynamics in HeLa cells
FEBS Journal 273 (2006) 5205–5218 ª 2006 The Authors Journal compilation ª 2006 FEBS 5215
Two microliters of this solution was loaded into Proxeon
(Odense, Denmark) nano-electrospray tips. MS
n
experiments
were performed with selected ions (m ⁄ z 3 width) submitted to
resonant excitation amplitude from 0.5 to 1.5 V
P-P
(volts
peak to peak). The recorded spectra are the average of 50–
200 microscans, in order to obtain a good signal-to-noise
ratio.
Acknowledgements
We thank Michel Bornens for the gift of antibody
anti-CTR433, Donna Stolz for providing the colloidal
cationic silica, and Jean Gruenberg for critical reading
of the manuscript. This work was supported by grants
from the Ligue Nationale contre le Cancer, Associ-
ation de Recherche contre le Cancer (nos. 5177 and
3105), Fondation de France, and Action Concerte
´
e
Incitative ) Jeunes chercheurs (no. 5233) to CL and
LJ, and by fellowships from Ligue Nationale contre le
Cancer and Fondation pour la Recherche Me
´
dicale for
TF, and Fondation de France for MA.
References
1 Marcus DM, Kundu SK & Suzuki A (1981) The P
blood group system: recent progress in immunochemis-
try and genetics. Semin Hematol 18, 63–71.
2 Mangeney M, Richard Y, Coulaud D, Tursz T & Wiels
J (1991) CD77: an antigen of germinal center B cells
entering apoptosis. Eur J Immunol 21, 1131–1140.
3 Wiels J, Fellous M & Tursz T (1981) Monoclonal anti-
body against a Burkitt lymphoma-associated antigen.
Proc Natl Acad Sci USA 78, 6485–6488.
4 Gariepy J (2001) The use of Shiga-like toxin 1 in cancer
therapy. Crit Rev Oncol Hematol 39, 99–106.
5 Johannes L & Decaudin D (2005) Protein toxins: intra-
cellular trafficking for targeted therapy. Gene Ther 12,
1360–1368.
6 Maloney MD, Binnington-Boyd B & Lingwood CA
(1999) Globotriaosyl ceramide modulates interferon-
alpha-induced growth inhibition and CD19 expression
in Burkitt’s lymphoma cells. Glycocon J J16, 821–
828.
7Te
´
taud C, Falguie
`
res T, Carlier K, Lecluse Y, Garibal
J, Coulaud D, Busson P, Steffensen R, Clausen H,
Johannes L et al. (2003) Two distinct Gb3 ⁄ CD77 signa-
ling pathways leading to apoptosis are triggered by anti-
Gb3 ⁄ CD77 mAb and verotoxin-1. J Biol Chem 278,
45200–45208.
8 van Setten PA, Monnens LA, Verstraten RG, van den
Heuvel LP & van Hinsbergh VW (1996) Effects of vero-
cytotoxin-1 on nonadherent human monocytes: binding
characteristics, protein synthesis, and induction of cyto-
kine release. Blood 88, 174–183.
9 Yuhas Y, Kaminsky E, Mor M & Ashkenazi S (1996)
Induction of nitric oxide production in mouse macro-
phages by Shiga toxin. J Med Microbiol 45, 97–102.
10 Puri A, Hug P, Jernigan K, Barchi J, Kim HY, Hamil-
ton J, Wiels J, Murray GJ, Brady RO & Blumenthal R
(1998) The neutral glycosphingolipid globotriaosylcera-
mide promotes fusion mediated by a CD4-dependent
CXCR4-utilizing HIV type 1 envelope glycoprotein.
Proc Natl Acad Sci USA 95, 14435–14440.
11 O’Brien AD, Tesh VL, Donohue-Rolfe A, Jackson MP,
Olsnes S, Sandvig K, Lindberg AA & Keusch GT
(1992) Shiga toxin: biochemistry, genetics, mode of
action, and role in pathogenesis. Curr Top Microbiol
Immunol 180, 65–94.
12 Ling H, Boodhoo A, Hazes B, Cummings MD, Arm-
strong GD, Brunton JL & Read RJ (1998) Structure of
Shiga-like toxin I B-pentamer complexed with an analo-
gue of its receptor Gb3. Biochemistry 37, 1777–1788.
13 Falnes PO & Sandvig K (2000) Penetration of protein
toxins into cells. Curr Opin Cell Biol 12, 407–413.
14 Lord JM, Deeks E, Marsden CJ, Moore K, Pateman C,
Smith DC, Spooner RA, Watson P & Roberts LM
(2003) Retrograde transport of toxins across the endo-
plasmic reticulum membrane. Biochem Soc Trans 31,
1260–1262.
15 Johannes L (2002) I. Shiga toxin B-subunit system: ret-
rograde transport, intracellular vectorization, and more.
Am J Physiol Gastrointest Liver Physiol 283, G1–G7.
16 Johannes L, Tenza D, Antony C & Goud B (1997) Ret-
rograde transport of KDEL-bearing B-fragment of
Shiga toxin. J Biol Chem 272, 19554–19561.
17 Mallard F, Tenza D, Antony C, Salamero J, Goud B &
Johannes L (1998) Direct pathway from early ⁄
recycling
endosomes to the Golgi apparatus revealed through the
study of Shiga toxin B-fragment transport. J Cell Biol
143, 973–990.
18 Sandvig K, Garred O, Prydz K, Kozlov JV, Hansen SH
& van Deurs B (1992) Retrograde transport of endocy-
tosed Shiga toxin to the endoplasmic reticulum. Nature
358, 510–512.
19 Mallard F, Tang BL, Galli T, Tenza D, Saint-Pol A,
Yue X, Antony C, Hong W, Goud B & Johannes L
(2002) Early ⁄ recycling endosomes-to-TGN transport
involves two SNARE complexes and a Rab6 isoform.
J Cell Biol 156, 653–664.
20 Kreykenbohm V, Wenzel D, Antonin W, Atlachkine V
& von Mollard GF (2002) The SNAREs vti1a and vti1b
have distinct localization and SNARE complex part-
ners. Eur J Cell Biol 81, 273–280.
21 Tai G, Lu L, Wang TL, Tang BL, Goud B, Johannes L
& Hong W (2004) Participation of the syntaxin
5 ⁄ Ykt6 ⁄ GS28 ⁄ GS15 SNARE complex in transport from
the early ⁄ recycling endosome to the TGN. Mol Biol Cell
15, 4011–4022.
Gb
3
dynamics in HeLa cells T. Falguie
`
res et al.
5216 FEBS Journal 273 (2006) 5205–5218 ª 2006 The Authors Journal compilation ª 2006 FEBS
22 Saint-Pol A, Yelamos B, Amessou M, Mills IG, Dugast
M, Tenza D, Schu P, Antony C, McMahon HT,
Lamaze C et al. (2004) Clathrin adaptor epsinR is
required for retrograde sorting on early endosomal
membranes. Dev Cell 6, 525–538.
23 Lauvrak SU, Torgersen ML & Sandvig K (2004)
Efficient endosome-to-Golgi transport of Shiga toxin is
dependent on dynamin and clathrin. J Cell Sci 117,
2321–2331.
24 Lu L, Tai G & Hong W (2004) Autoantigen Golgin-97,
an effector of Arl1 GTPase, participates in traffic from
the endosome to the trans-golgi network. Mol Biol Cell
15, 4426–4443.
25 Natarajan R & Linstedt AD (2004) A cycling cis Golgi
protein mediates endosome-to-Golgi traffic. Mol Biol
Cell 15, 4798–4806.
26 Falguie
`
res T, Mallard F, Baron C, Hanau D, Lingwood
C, Goud B, Salamero J & Johannes L (2001) Targeting
of shiga toxin b-subunit to retrograde transport route in
association with detergent-resistant membranes. Mol
Biol Cell 12, 2453–2468.
27 Kovbasnjuk O, Edidin M & Donowitz M (2001) Role
of lipid rafts in Shiga toxin 1 interaction with the apical
surface of Caco-2 cells. J Cell Sci 114, 4025–4031.
28 Sandvig K, Ryd M, Garred O, Schweda E, Holm PK &
van Deurs B (1994) Retrograde transport from the
Golgi complex to the ER of both Shiga toxin and the
nontoxic Shiga B-fragment is regulated by butyric acid
and cAMP. J Cell Biol 126, 53–64.
29 Arab S & Lingwood CA (1998) Intracellular targeting
of the endoplasmic reticulum ⁄ nuclear envelope by retro-
grade transport may determine cell hypersensitivity to
verotoxin via globotriaosyl ceramide fatty acid isoform
traffic. J Cell Physiol 177, 646–660.
30 Arab S & Lingwood CA (1996) Influence of phospholipid
chain length on verotoxin ⁄ globotriaosyl ceramide binding
in model membranes: comparison of a supported bilayer
film and liposomes. Glycocon J J13, 159–166.
31 Binnington B, Lingwood D, Nutikka A & Lingwood
CA (2002) Effect of globotriaosyl ceramide fatty acid
alpha-hydroxylation on the binding by verotoxin 1 and
verotoxin 2. Neurochem Res 27, 807–813.
32 Mallard F & Johannes L (2002) Shiga toxin B-subunit
as a tool to study retrograde transport. In Methods in
Molecular Medicine. Shiga Toxin Methods and Protocols
(Philpott D & Ebel F, eds), Vol. 73, pp. 209–220.
Humana Press, Totowa, NJ.
33 Stolz DB, Ross MA, Salem HM, Mars WM, Michalo-
poulos GK & Enomoto K (1999) Cationic colloidal
silica membrane perturbation as a means of examining
changes at the sinusoidal surface during liver regenera-
tion. Am J Pathol 155, 1487–1498.
34 Lencer WI & Tsai B (2003) The intracellular voyage of
cholera toxin: going retro. Trends Biochem Sci 28, 639–
645.
35 Shimizu H, Field RA, Homans SW & Donohue-Rolfe
A (1998) Solution structure of the complex between the
B-subunit homopentamer of verotoxin VT-1 from
Escherichia coli and the trisaccharide moiety of globo-
triaosylceramide. Biochemistry 37, 11078–11082.
36 Foster GH, Armstrong CS, Sakiri R & Tesh VL (2000)
Shiga toxin-induced tumor necrosis factor alpha expres-
sion: requirement for toxin enzymatic activity and
monocyte protein kinase C and protein tyrosine kinases.
Infect Immun 68, 5183–5189.
37 Foster GH & Tesh VL (2002) Shiga toxin 1-induced
activation of c-Jun NH(2)-terminal kinase and p38 in
the human monocytic cell line THP-1: possible involve-
ment in the production of TNF-alpha. J Leukoc Biol
71, 107–114.
38 Mori T, Kiyokawa N, Katagiri YU, Taguchi T, Suzuki
T, Sekino T, Sato N, Ohmi K, Nakajima H, Takeda T
et al. (2000) Globotriaosyl ceramide (CD77 ⁄ Gb3) in the
glycolipid-enriched membrane domain participates in
B-cell receptor-mediated apoptosis by regulating lyn
kinase activity in human B cells. Exp Hematol 28, 1260–
1268.
39 Takenouchi H, Kiyokawa N, Taguchi T, Matsui J, Kat-
agiri YU, Okita H, Okuda K & Fujimoto J (2004)
Shiga toxin binding to globotriaosyl ceramide induces
intracellular signals that mediate cytoskeleton remodel-
ing in human renal carcinoma-derived cells. J Cell Sci
117, 3911–3922.
40 Katagiri YU, Mori T, Nakajima H, Katagiri C, Taguchi
T, Takeda T, Kiyokawa N & Fujimoto J (1999) Activa-
tion of src family kinase yes induced by shiga toxin
binding to globotriaosyl ceramide (Gb3 ⁄ CD77) in low
density, detergent-insoluble microdomains. J Biol Chem
274, 35278–35282.
41 Lauvrak SU, Walchli S, Iversen TG, Slagsvold HH,
Torgersen ML, Spilsberg B & Sandvig K (2006) Shiga
toxin regulates its entry in a Syk-dependent manner.
Mol Biol Cell 17, 1096–1109.
42 Sandvig K, Olsnes S, Brown JE, Petersen OW & van
Deurs B (1989) Endocytosis from coated pits of Shiga
toxin: a glycolipid-binding protein from Shigella dysen-
teriae 1. J Cell Biol 108, 1331–1343.
43 Nichols BJ, Kenworthy AK, Polishchuk RS, Lodge R,
Roberts TH, Hirschberg K, Phair RD & Lippincott-
Schwartz J (2001) Rapid cycling of lipid raft markers
between the cell surface and Golgi complex. J Cell Biol
153, 529–542.
44 Stoddart A, Dykstra ML, Brown BK, Song W, Pierce
SK & Brodsky FM (2002) Lipid rafts unite signaling
cascades with clathrin to regulate BCR internalization.
Immunity 17, 451–462.
45 Abrami L, Liu S, Cosson P, Leppla SH & van der Goot
FG (2003) Anthrax toxin triggers endocytosis of its
receptor via a lipid raft-mediated clathrin-dependent
process. J Cell Biol 160, 321–328.
T. Falguie
`
res et al. Gb
3
dynamics in HeLa cells
FEBS Journal 273 (2006) 5205–5218 ª 2006 The Authors Journal compilation ª 2006 FEBS 5217
46 Puri C, Tosoni D, Comai R, Rabellino A, Segat D,
Caneva F, Luzzi P, Di Fiore PP & Tacchetti C (2005)
Relationships between EGFR signaling-competent and
endocytosis-competent membrane microdomains. Mol
Biol Cell 16, 2704–2718.
47 Amessou M, Popoff V, Yelamos B, Saint-Pol A &
Johannes L (2006) Recent methods for studying retro-
grade transport. Curr Protocols Cell Biol (in press).
48 Smith DC, Marsden CJ, Lord JM & Roberts LM
(2003) Expression, purification and characterization of
ricin vectors used for exogenous antigen delivery into
the MHC Class I presentation pathway. Biol Proced
Online 5, 13–19.
Gb
3
dynamics in HeLa cells T. Falguie
`
res et al.
5218 FEBS Journal 273 (2006) 5205–5218 ª 2006 The Authors Journal compilation ª 2006 FEBS