Báo cáo khoa học: Specific TSC22 domain transcripts are hypertonically induced and alternatively spliced to protect mouse kidney cells during osmotic stress pptx
Bạn đang xem bản rút gọn của tài liệu. Xem và tải ngay bản đầy đủ của tài liệu tại đây (964.45 KB, 16 trang )
Specific TSC22 domain transcripts are hypertonically
induced and alternatively spliced to protect mouse kidney
cells during osmotic stress
Diego F. Fiol, Sally K. Mak* and Dietmar Ku
¨
ltz
Physiological Genomics Group, Department of Animal Science, University of California, Davis, CA, USA
In the mammalian kidney, the papilla is routinely
exposed to severe hyperosmolality and to large changes
in interstitial osmolality. These stressful conditions are
a prerequisite for operation of the urinary concentra-
ting mechanism and maintenance of systemic salt
and water balance. Thus, renal papillary (and outer
medullary) cells have special mechanisms to adapt to
variable and severe hyperosmolality. Cellular adapta-
tion to hyperosmotic stress is controlled via a complex
array of cellular signaling mechanisms that modify
gene and protein expression and protein function
to promote osmoprotection [1]. Such signaling
Keywords
aldosterone; hyperosmotic stress;
hypertonicity; kidney; mIMCD3 cells
Correspondence
D. Ku
¨
ltz, Physiological Genomics Group,
Department of Animal Science, University of
California, Davis, One Shields Avenue,
Davis, CA 95616, USA
Fax: +1 530 752 0175
Tel: +1 530 752 2991
E-mail:
*Present address
The Parkinson’s Institute, Sunnyvale, CA,
USA
(Received 28 July 2006, revised 23 October
2006, accepted 3 November 2006)
doi:10.1111/j.1742-4658.2006.05569.x
We recently cloned a novel osmotic stress transcription factor 1 (OSTF1)
from gills of euryhaline tilapia (Oreochromis mossambicus) and demonstra-
ted that acute hyperosmotic stress transiently increases OSTF1 mRNA
and protein abundance [Fiol DF, Ku
¨
ltz D (2005) Proc Natl Acad Sci USA
102, 927–932]. In this study, a genome-wide search was conducted to iden-
tify nine distinct mouse transforming growth factor (TGF)-b-stimulated
clone 22 domain (TSC22D) transcripts, including glucocorticoid-induced
leucine zipper (GILZ), that are orthologs of OSTF1. These nine TSC22D
transcripts are encoded at four loci on chromosomes 14 (TSC22D1, two
splice variants), 3 (TSC22D2, four splice variants), X (TSC22D3, two
splice variants), and 5 (TSC22D4). All nine mouse TSC22D transcripts are
expressed in renal cortex, medulla and papilla, and in the mIMCD3 cell
line. The two TSC22D3 transcripts (including GILZ) are upregulated by
aldosterone but not by hyperosmolality in mIMCD3 cells. In contrast,
TSC22D4 is stably upregulated by hyperosmolality in mIMCD3 cells and
increased in renal papilla compared with cortex. Moreover, all four
TSC22D2 transcripts are transiently upregulated by hyperosmolality and
resemble tilapia OSTF1 in this regard. All TSC22D2 transcripts depend
on hypertonicity as the signal for their upregulation and are unresponsive
to increases in cell-permeable osmolytes. mRNA stabilization is the mech-
anism for TSC22D2 upregulation by hyperosmolality. Overexpression of
TSC22D2–4 in mIMCD3 cells confers protection towards osmotic stress,
as evidenced by a 2.7-fold increase in cell survival after 3 days at
600 mOsmolÆkg
)1
. Based on variable responsiveness to aldosterone and
hyperosmolality in kidney cells we conclude that mouse TSC22D genes
have diverse physiological functions. TSC22D2 and TSC22D4 are involved
in adaptation of renal cells to hypertonicity suggesting that they represent
important elements of osmosensory signal transduction in mouse kidney
cells.
Abbreviations
GILZ, glucocorticoid-induced leucine zipper; OSTF1, osmotic stress transcription factor 1; TGF, transforming growth factor; TonEBP, tonicity-
response element binding protein.
FEBS Journal 274 (2007) 109–124 ª 2006 University of California Journal compilation ª 2006 FEBS 109
mechanisms stimulate accumulation of the compatible
organic osmolytes glycine-betaine, myo-inositol, tau-
rine, sorbitol, and glycerophosphorylcholine [2–4].
Accumulation of glycine-betaine, inositol, and sorbitol
is transcriptionally regulated and depends, at least in
part, on the transcription factor tonicity-response ele-
ment binding protein (TonEBP) [5]. TonEBP also acti-
vates additional genes that are important for osmotic
stress adaptation, including HSP70 and UT-A urea
transporter [6,7]. In addition to the TonEBP pathway,
hyperosmolality activates a very complex network of
intracellular signaling pathways in renal medullary
cells, including MAP kinase pathways [8], the p53
pathway [9], DNA-dependent protein kinases [10], and
protein kinase A-dependent pathways [11]. Thus, the
response of mammalian kidney cells to hyperosmotic
stress is highly complex and involves many different
pathways and elements. Proper understanding of the
cellular hyperosmotic stress response enabling compu-
tational modeling of this response is highly desirable
because it would open avenues for manipulating stress-
resistance networks of cells in states of renal disease
and disorders of water and electrolyte balance. How-
ever, better knowledge about key elements of osmo-
sensory signal transduction pathways and their
interactions within osmotic stress signaling networks is
required before in silico models that correctly reflect
and predict cellular responses to osmotic stress can be
devised.
We recently cloned a novel immediate early gene
osmotic stress transcription factor 1 (OSTF1) that is
involved in the cellular osmotic stress response of gill
cells of euryhaline tilapia [12]. In this fish, OSTF1
mRNA and protein levels rapidly and transiently
increase in response to hyperosmotic stress, peaking at
2 and 4 h, respectively. The rapid and transient activa-
tion kinetics is characteristic of immediate early genes.
OSTF1 belongs to the TSC22D family of leucine zip-
per proteins that are thought to be transcription fac-
tors in mammalian cells. In mouse tissues, TSC22D
genes are regulated by glucocorticoids and transform-
ing growth factor b (TGF-b) [13,14]. However, nothing
is known about the osmotic regulation of any mouse
TSC22D isoform. In addition, a systematic genome-
wide analysis of mouse TSC22D gene products, identi-
fying all family members, is lacking.
In this study, we identified nine murine TSC22D
transcripts and investigated their regulation by hyper-
osmolality and aldosterone, which is a mineralocorti-
coid hormone important for modulation of the urinary
concentrating mechanism. Moreover, TSC22D2 was
identified as the closest functional mouse ortholog of
tilapia OSTF1 and the mechanism and physiological
significance of hyperosmotic upregulation of this gene
was analyzed.
Results
Identification of TSC22D family members in the
mouse genome
We recently cloned tilapia OSTF1 and showed that it
is a rapidly induced osmotic stress transcription factor
[12]. To identify possible functional homologs of tila-
pia OSTF1 in mammals, we carried out an exhaustive
search of the complete annotated mouse genome using
the ENSEMBL database ()
[15]. This search yielded six gene products with expec-
tation values ranging from 6.1e-69 to 3.2e-21. These
proteins are the products of transcripts encoded at
four different loci (Table 1). In order to avoid ambi-
guity, we follow the recently updated and unified
MGD nomenclature guidelines for TSC22D proteins
in this study (Mouse Genome Informatics) [16].
TSC22D1-1 and TSC22D1-2 are splice variants that
are located on chromosome 14, TSC22D2 is located
on chromosome 3, TSC22D3-1 and TSC22D3-2 are
splice variants that are located on chromosome X, and
TSC22D4 is located on chromosome 5 (Table 1).
Although two of these proteins have been previously
described as TSC-22 (TSC22D1-2) and glucocorticoid-
induced leucine zipper (GILZ) (TSC22D3-2), the other
four have not been characterized or only referred to as
TSC22-like or GILZ-like proteins. Multiple sequence
Table 1. Mouse OSTF1-like predicted transcripts. aa, amino acid; nt, nucleotide.
Transcript Name
Chromosome
location Accession EMBL ENSEMBL
Length
(aa) (nt)
OSTF1 homology
Score E-value
TSC22D1-1 14 band D3 AF201285 ENSMUST00000048371 1057 4581 298 2.5e-26
TSC22D1-2 TSC-22 14 band D3 L25785 ENSMUST00000022587 143 1670 299 1.0e-27
TSC22D2 3 band D BC058221 ENSMUST00000029383 167 2002 256 3.7e-23
TSC22D3-1 X band F1 AF201289 ENSMUST00000033807 201 1377 688 6.1e-69
TSC22D3-2 GILZ X band F1 AF024519 ENSMUST00000055738 137 1972 324 2.3e-30
TSC22D4 THG1 5 band G1 AF315352 ENSMUST00000049554 387 2672 240 3.2e-21
Osmotic regulation of TSC22D in kidney cells D. F. Fiol et al.
110 FEBS Journal 274 (2007) 109–124 ª 2006 University of California Journal compilation ª 2006 FEBS
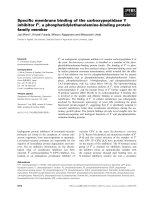
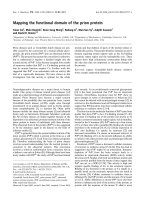
alignment shows that the six mouse proteins and
tilapia OSTF1 share a conserved region of 70 amino
acids, which comprises the TSC22D family signature
motif and a leucine-zipper domain. The N- and C-ter-
mini are least conserved in all proteins. In particular,
N-termini are highly heterogeneous, accounting for
variability in total protein lengths ranging from 124 to
1057 amino acids (Table 1, Fig. 1). The protein with
the highest overall sequence similarity to tilapia
OSTF1 is TSC22D3-1, based on highest degree of con-
servation of the N-terminus (Fig. 1).
Expression of TSC22D family members in kidney
mouse and mIMCD3 cells
We analyzed the expression of the six mouse TSC22D
transcripts in kidney to learn whether any of them
functionally resembles tilapia OSTF1. Levels of expres-
sion of the six transcripts were determined by quantita-
tive PCR in three regions of the kidney that are
characterized by increasing interstitial osmolality in the
order from cortex (lowest) to medulla (intermediate) to
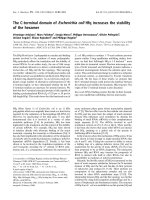
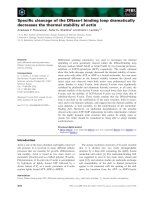
papilla (highest). All six transcripts are expressed in all
three regions of the kidney. Renal TSC22D2 is most
abundant being expressed at levels that are between
one and two orders of magnitude lower than that of
the highly abundant ribosomal protein L32 (Fig. 2).
The level of expression of TSC22D1-2 and TSC22D2
is similar in cortex, medulla, and papilla (Fig. 2).
However, TSC22D3-1, TSC22D3-2, and TSC22D4 are
significantly more abundant in papilla, whereas
TSC22D1-1 is more abundant in cortex. The data
suggest that hyperosmolality could potentially be
responsible for altering the expression of four TSC22D
transcripts. The level of expression of all six transcripts
was also determined in mIMCD3 cells. All six tran-
scripts are expressed in mIMCD3 cells and expression
levels are similar to those in mouse kidney medulla
in vivo (data not shown). Therefore, mIMCD3 cells are
a good model for evaluating mechanisms of regulation
of the mouse TSC22D transcripts.
B
A
Fig. 1. Schematic structure (A) and multiple sequence alignment of the TSC22D motif (B) of tilapia OSTF1 and mouse TSC22D family mem-
bers identified by a genome-wide search. Large gray cylinders correspond to the conserved TSC22 ⁄ leucine zipper motif. Smaller white cylin-
ders represent local regions of high homology. Residues shaded in darker tones correspond to higher level of homology in the alignment.
Fig. 2. Relative expression levels of mouse TSC22D transcripts in
kidney papilla, medulla and cortex. Expression levels of TSC22D
transcripts were determined by quantitative PCR. C, cortex; M,
medulla; P, papilla. Results are depicted as means ± SEM of three
independent experiments. Significant differences between kidney
regions are indicated by asterisks (P<0.05).
D. F. Fiol et al. Osmotic regulation of TSC22D in kidney cells
FEBS Journal 274 (2007) 109–124 ª 2006 University of California Journal compilation ª 2006 FEBS 111
Regulation of TSC22D transcripts in mIMCD3
cells by hyperosmotic stress and aldosterone
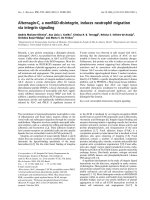
The responsiveness of TSC22D transcripts to hyper-
osmotic stress and ⁄ or aldosterone treatment was
determined in mIMCD3 cells in 24-h time course
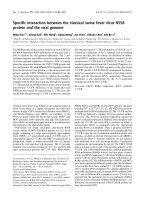
experiments. Acute hypertonicity increases the expres-
sion of TSC22D2, TSC22D4 and TSC22D3-2. Of
interest, TSC22D2 is elevated early and transiently,
showing increases of 2.6- and 3.1-fold at 4 and 6 h of
treatment, respectively, and returning to baseline levels
within 12 h. In contrast, TSC22D3-2 and TSC22D4
show a slower but more stable upregulation, increasing
three- and sixfold, respectively, after 24 h of treatment
(Fig. 3). These results are in agreement with higher
levels of TSC22D3-2 and TSC22D4 in renal papilla
in vivo (see previous paragraph, Fig. 2). Aldosterone
induces a rapid increase in TSC22D3-2 (4-fold at 1 h,
AB
CD
EF
Fig. 3. Response of TSC22D transcripts to hyperosmotic stress and aldosterone in mIMCD3 cells. Cells were exposed to hyperosmolality by
increasing medium osmolality from 300 to 550 mOsm by addition of NaCl (filled circles), to 1 l
M aldosterone (triangles), or to both hyper-
osmolality and aldosterone simultaneously (open circles). Each panel shows the time course response for a particular transcript determined
by quantitative PCR. Results are depicted as means ± SEM for three independent experiments. Asterisks indicate significantly differences
with respect to the value at time zero (P<0.05).
Osmotic regulation of TSC22D in kidney cells D. F. Fiol et al.
112 FEBS Journal 274 (2007) 109–124 ª 2006 University of California Journal compilation ª 2006 FEBS
33-fold at 12 h, 10-fold at 24 h) and TSC22D3-1 (five-
fold at 4–6 h hours) (Fig. 3). Of interest, a combina-
tion of hyperosmotic stress and aldosterone does
not potentiate the transient increase in TSC22D3-2
(Fig. 3). By contrast, hyperosmotic stress and aldoster-
one in combination prevent transient short-term effects
and offset each other. Taken together, the data on
osmotic regulation of TSC22D transcripts implicate
TSC22D2 as the closest functional homolog of tilapia
OSTF1.
Identification of alternative TSC22D2 transcripts
Because of its similar osmotic regulation compared
with tilapia OSTF1 we investigated mouse TSC22D2
in more depth. Two additional alternative transcripts
encoding splice variants of TSC22D2 protein were
identified that differed from the original cDNA
ENSMUST00000029383 (TSC22D2-1; Fig. 1, Table 1).
These two additional cDNAs (GENSCAN000000732
55 ¼ TSC22D2-2 and ENSMUSESTG00000010047 ¼
TSC22D2-3) were predicted using the Ensembl data-
base and gene prediction software genscan and
genomewise ⁄ genewise. genscan is a bioinformatic
tool that predicts gene loci and their exon ⁄ intron
composition based on the genomic DNA sequence
[17]. genomewise ⁄ genewise gene-prediction software
assembles cDNA sequences based on the analysis and
integration of EST data [18]. Taking advantage of
information provided by these two complementary
approaches we thoroughly examined the TSC22D2
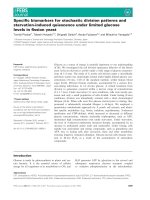
gene for alternative splicing events. Alignment of the
three identified TSC22D2 splice variants against the
genomic TSC22D2 sequence revealed differences in
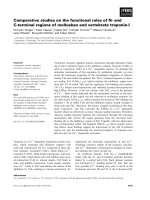
exon composition. Two splice variants (TSC22D2-1 ⁄ 2)
consist of three exons, whereas the third splice variant
(TSC22D2-3) has four exons as a result of inclusion of
an extra 72 bp exon in the second position (Fig. 4A).
The length of the first and last exons is also variable in
the three splice variants of TSC22D2 (Fig. 4A).
We then tested for expression of the newly predicted
TSC22D2 transcripts (TSC22D2-2 ⁄ 3) in mouse kidney
cells. Specific PCR primer pairs were designed to
amplify TSC22D2-2 (primer pair E–F), TSC22D2-3
(primer pair A–C), and all splice variants (primer pairs
A–B and A–D). We had already used primer pair A–B
for previous quantification of overall TSC22D2 tran-
script abundance as it amplifies all possible splice vari-
ants (Fig. 4A, Table S1). Expression of TSC22D2-2
and TSC22D2-3 was confirmed based on the presence
of RT-PCR products having the expected sizes
(Fig. 4B, lanes A–C and E–F, respectively). In addi-
tion, using the primer pair A–D we detected three
different PCR products of 493, 406 and 334 bp instead
of the two products that we expected based on the pri-
mer design shown in Fig. 4A (amplicon ± exon 2).
Therefore, the three PCR products obtained with
primers A–D were purified, sequenced, and aligned to
each other (Fig. 4C). The sequence of two of these
PCR products matched the predicted sequence for
TSC22D2-1 ⁄ 2 and TSC22D2-3 (Fig. 4C). These
sequences differed by the presence of the 72-bp exon 2
in TSC22D2-3 as predicted.
Surprisingly, however, an additional unpredicted
fragment was discovered by PCR analysis (TSC22D2-
4, Fig. 4). Sequencing of the corresponding PCR prod-
uct confirmed that TSC22D2-4 represents an entirely
novel splice variant that was not predicted by any of
the bioinformatics methods used in our study nor
reported to exist previously. TSC22D2-4 included an
alternative second exon of 159 bp but lacked the 72 bp
exon 2. Schematic exon ⁄ intron structures of all four
TSC22D2 splice variants are compared in Fig. 4D with
emphasis on the two alternative exons 2A (72 bp) and
2B (159 bp), which are not present simultaneously in
any TSC22D2 transcript in mIMCD3 cells (Fig. 4B).
Next, we analyzed the exon ⁄ intron regions flanking
TSC22D2 exons 2A and 2B. All of these sequences
match splice donor and acceptor consensus sites very
well (5¢-AG ⁄ GT AG ⁄ G-3¢) (Table 2). In addition, the
homologous intron⁄ exon regions that flank exons 2A
and 2B in human TSC22D2 are 95% identical to
mouse sequences indicating a high degree of conserva-
tion of these critical areas compared with the overall
much lower homology of TSC22D2 genomic sequence
(< 50%; data not shown). Taken together, these
observations strongly support alternative splicing
events that give rise to TSC22D2 transcripts with dif-
ferent exon 2 sequences.
Protein products for TSC22D2-1 and TSC22D2-2
differ only by variable length of the first and last exons
from each other (Fig. 4A). In contrast, TSC22D2-3
and TSC22D2-4 differ more substantially from the
other TSC22D2 variants because of the presence of an
additional exon (exon 2A ⁄ 2B) (Fig. 4E). In particular,
TSC22D2-4 differs greatly from the other variants
because it lacks a large portion of the N-terminus due
to the presence of four in-frame stop codons in
exon 2B (Fig. 4C,E). An ATG codon following imme-
diately after the last of these four stop codons may
represent the transcription initiation site for a protein
with a much shorter N-terminus (Fig. 4E). Each of the
four possible TSC22D2 protein products also differs
with respect to the presence of consensus phosphoryla-
tion sites for a number of stress-responsive protein
kinases (Fig. 4E).
D. F. Fiol et al. Osmotic regulation of TSC22D in kidney cells
FEBS Journal 274 (2007) 109–124 ª 2006 University of California Journal compilation ª 2006 FEBS 113
Response of the four TSC22D2 variants to
hyperosmolality and aldosterone
We quantified abundances of individual TSC22D2
transcripts by quantitative PCR using the PCR primers
depicted in Fig. 4A and Table 1. All four TSC22D2
variants are expressed at comparable levels in mouse
kidney papilla, medulla, and cortex (data not shown).
To analyze the regulation of the four TSC22D2 vari-
ants in response to hyperosmolality and aldosterone
C
D
E
A
B
Fig. 4. Detection and characterization of
alternative TSC22D2 transcripts. (A) Align-
ment of TSC22D2 (ENSMUST00000029383)
with TSC22D2 transcripts predicted by
GENSCAN and GENOMEWISE ⁄ GENEWISE and
genomic DNA (chromosome 3). Positions of
PCR primers designed to differentiate
between splice variants are indicated by
arrows below the schematic representation
of genomic DNA. (B) Products of PCR
amplification using splice variant-specific
TSC22D2 PCR primers. (C) Nucleotide
sequence of the PCR products amplified by
the A–D primer pair. In-frame stop and start
codons are over-lined in gray and black,
respectively. (D) Schematic representation
of the exon–intron structure of all identified
TSC22D2 transcripts. Positions of PCR prim-
ers designed to amplify individual splice vari-
ants are indicated by arrowheads. (E) Partial
deduced amino acid sequence of the exon 2
region of all identified TSC22D2 transcripts.
The TSC22D domain is boxed. Regions
encoded by exon 2A and exon 2B are prin-
ted in bold. Splice variant-specific potential
phosphorylation sites are underlined. Aster-
isk indicates the presence of an in-frame
stop codon in the corresponding mRNA.
Osmotic regulation of TSC22D in kidney cells D. F. Fiol et al.
114 FEBS Journal 274 (2007) 109–124 ª 2006 University of California Journal compilation ª 2006 FEBS
we exposed mIMCD3 cells to either of those stimuli
alone and to a combination of both. All four
TSC22D2 variants are transiently upregulated by
hyperosmotic stress (Fig. 5). The highest degree
of hyperosmotic upregulation was observed for
TSC22D2-4. Aldosterone with or without hyperosmol-
ality did not significantly affect the abundance of any
individual TSC22D2 variant, consistent with the results
obtained when all TSC22D2 variants were quantified
together (Figs 3, 5).
Regulation of TSC22D2 variants by
hyperosmolality
To identify the signal responsible for hyperosmotic
upregulation of TSC22D2 we exposed mIMCD3 cells
for 5 h to hyperosmotic media (550 mOsmolÆkg
)1
) pre-
pared by addition of NaCl, choline chloride, sodium
gluconate, mannitol, urea or glycerol. TSC22D2-4 was
always upregulated by hypertonic media (choline chlor-
ide, sodium gluconate, mannitol, NaCl) independent of
the presence of Na
+
or Cl
–
in such media (Fig. 6). In
contrast, hyperosmolality due to nonhypertonic gly-
cerol or urea did not alter TSC22D2-4 levels (Fig. 6).
Similar results were obtained for the other three
TSC22D2 variants (data not shown). These data dem-
onstrate that neither Na
+
nor Cl
–
nor hyperosmolality
per se represent the signal for upregulation of
Table 2. Sequences corresponding to 3¢ acceptor and 5¢ donor
exon ⁄ intron boundaries in TSC22D2 transcripts.
5¢-Donor
EXON ⁄ intron
3¢-Acceptor
intron ⁄ EXON
Exon 1 AGACAG ⁄ gtatgtaca gtctcacag ⁄ GAATCC . Exon 2 A
Exon 1 .AGACAG ⁄ gtatgtaca . . ctttgctag ⁄ AATTTT . Exon 2B
Exon 1 .AGACAG ⁄ gtatgtaca . . tttttccag ⁄ TGCATC . Exon 3
Exon 2 A . GGATAG ⁄ gtatgatta . . tttttccag ⁄ TGCATC . Exon 3
Exon 2B .AAATTG ⁄ gtaagactt . tttttccag ⁄ TGCATC. Exon 3
Exon 3 .GCAATG ⁄ gtaagtagg . .tcttcacag ⁄ GATCTG. Exon 4
AB
CD
Fig. 5. Response of TSC22D2 alternative transcripts to hyperosmotic stress in mIMCD3 cells. Cells were exposed to hyperosmolality by
increasing medium osmolality from 300 to 550 mOsm by addition of NaCl (filled circles), to 1 l
M aldosterone (triangles), or to both hyper-
osmolality and aldosterone simultaneously (open circles). Each panel shows the time course response for a particular TSC22D2 alternative
transcript as determined by quantitative PCR. Results are depicted as means ± SEM for three independent experiments. Asterisks indicate
significantly differences with respect to the value at time zero (P<0.05).
D. F. Fiol et al. Osmotic regulation of TSC22D in kidney cells
FEBS Journal 274 (2007) 109–124 ª 2006 University of California Journal compilation ª 2006 FEBS 115
TSC22D2. Instead, hypertonicity is the stimulus that
triggers TSC22D2 upregulation.
mRNA stabilization of TSC22D2 during
hyperosmotic stress
Next, we analyzed the mechanism of TSC22D2 upreg-
ulation in response to hyperosmotic stress. Transcrip-
tion in mIMCD3 cells was completely blocked by a
1 h preincubation in 10 lm actinomycin D. Even 5 lm
actinomycin was sufficient to effectively block tran-
scription in mIMCD3 cells (Fig. S2). Cells were then
exposed to hyperosmotic stress, aldosterone, and
control conditions (isosmotic medium). The half-life
of TSC22D2-4 was 2.8 ± 0.2 h for controls and
aldosterone treatment but increased to > 20 h as a
consequence of hyperosmolality (Fig. 7). TSC22D2-1 ⁄ 2
and TSC22D2-3 responded similarly, with half-lives
increasing from 2.8 ± 0.3 to > 10 h and 2.3 ± 0.3 to
> 15 h, respectively, in response to hyperosmolality
(data not shown). These results indicate that mRNA
stabilization is the mechanism responsible for hyper-
osmotic upregulation of TSC22D2 transcripts.
Osmoprotection of mIMCD3 cells by
overexpression of TSC22D2-4
To evaluate whether TSC22D2 upregulation protects
cells from hyperosmotic stress we generated stably
transfected mIMCD3 cells that overexpress TSC22D2-
4. We first generated a mIMCD3 cell line with a Flp
recombinase target site stably integrated into the
genome (mIMCD3FRT cells; Fig. S1) to generate a
good control for future experiments with stably selec-
ted cells. We then cotransfected V5-epitope-tagged
TSC22D2-4 in pcDNA5FRT vector together with a
Flp recombinase expression vector to insert TSC22D2-
4 into the FRT site in exchange for the LacZ gene.
The transgenic TSC22D2-4 cell line expressed 100-
fold higher levels of TSC22D2-4 compared with
mIMCD3FRT control cells (Fig. 8A). A single protein
with the expected molecular mass (17 kDa) was detec-
ted in TSC22D2-4 cells using V5 antibody (Fig. 8B).
The transgenic TSC22D2-4 cells showed signifi-
cantly greater hyperosmotic stress tolerance than
mIMCD3FRT control cells. We incubated these two
cell lines for 24 h under hyperosmotic stress conditions
that lead to a high frequency of apoptosis in wild-type
mIMC3 cells (600–650 mOsmÆkg
)1
) [19]. Under these
conditions, TSC22D2-4 cells had a significantly
improved phenotype (Fig. 9A) and cell numbers were
significantly higher compared with mIMCD3FRT con-
trol cells (Fig. 9B), indicating that high levels of
TSC22D2-4 protect cells during hyperosmotic stress.
Discussion
Mammals have four loci encoding at least nine
TSC22D transcripts
We have identified four loci in the mouse genome that
encode nine homalogs of the tilapia osmotic stress
Fig. 6. Response of TSC22D2-4 to different hyperosmotic media in
mIMCD3 cells. Osmolarity was increased from 300 to 550 mOsm
with the addition of the indicated compounds. After 5 h, cells were
collected and TSC22D2-4 mRNA levels were determined by quanti-
tative PCR. Results represent means ± SEM for three independent
experiments. Asterisks indicate significant differences with respect
to isosmotic controls (P<0.05).
Fig. 7. Stability of TSC22D2-4 transcript. mIMCD3 cells were prein-
cubated for 1 h with 10 lgÆmL
)1
actinomycin D in isosmotic med-
ium (300 mOsmolÆkg
)1
). Treatments were initiated at time zero
when cells were exposed to hyperosmolality by increasing medium
osmolality to 550 mOsmÆkg
)1
by addition of NaCl (black circles), to
1 l
M aldosterone (black triangles), or isosmotic control conditions
(open circles). mRNA levels were determined by quantitative real-
time PCR and normalized to L32 mRNA. Results are depicted as
means ± SEM for three independent experiments. Asterisks indi-
cate significantly different values with respect to the value at time
zero (P<0.05).
Osmotic regulation of TSC22D in kidney cells D. F. Fiol et al.
116 FEBS Journal 274 (2007) 109–124 ª 2006 University of California Journal compilation ª 2006 FEBS
transcription factor OSTF1. All four genes belong to
the TSC22D family of leucine zipper proteins that
form homo- and heterodimers with other family mem-
bers. Four TSC22D isoforms have previously been des-
cribed: TSC22D1-2 (TSC-22), TSC22D3-2 (GILZ),
TSC22D3-1 and TSC22D4.
TSC22D1-2 was first isolated based on rapid and
transient transcriptional induction by TGF-b1 [13]. It
also increases in response to anticancer drugs, prog-
esterone, and growth inhibitors [20] and has been
implied in mechanisms of tumorigensis.
TSC22D3-2 was identified as a protein that is
induced following the treatment of thymocytes with
dexamethasone [14]. Its mRNA increases threefold as
early as 30 min and by more than 10-fold within 4 h
of aldosterone exposure in principal cells of the renal
cortical collecting duct [21]. In contrast, it is downreg-
ulated by estrogen in MCF-7 human breast cancer
cells [22] GILZ interacts with NF-jB and Raf and
inhibits AP-1, FoxO3, and Raf-mediated apoptotic
pathways [23–25]. This protein mediates aldosterone
actions by stimulation of trans-epithelial sodium trans-
port in kidney [26].
TSC22D3-1 was identified in porcine brain as a
77 kDa protein that shares immunoreactivity with the
sequence-unrelated nonamer neuropeptide DSIP [27].
It was later found to be the most highly glucocorti-
coid-induced cDNA among over 9000 tested in a
cDNA gene chip array in human peripheral blood
mononuclear cells [28].
TSC22D4 was identified in humans as a protein cap-
able of forming heterodimers with TSC-22 [20]. Its
mouse homolog is involved in pituitary organogenesis
[29].
In this study we identified five additional TSC22D
transcripts that are encoded by genes located on chro-
mosomes 3 (TSC22D2-1, TSC22D2-2, TSC22D2-3,
TSC22D2-4) and 14 (TSC22D1-1). Although some of
these novel transcripts have been previously described
in the context of high-throughput cDNA sequencing
projects [30,31] their functions are unknown. However,
based on their sequence similarity to known TSC22D
proteins they may be transcription factors that are
involved in the regulation of cell proliferation, apop-
tosis, and stress response pathways.
A
B
Fig. 9. TSC22D2-4 confers increased tolerance to hyperosmotic
stress in mIMCD3 cells. (A) Representative images of transfected
and control (FRT) cells after exposure to 600 and 650 mOsm for
24 h (B) Count of viable transfected and control (FRT) cells after
exposure to isoosmotic (300 mOsm) or hyperosmotic (600 mOsm)
media for 72 h. Asterisks indicate significant differences
(P<0.05). Results represent means ± SEM for three independent
experiments.
A
B
Fig. 8. Overexpression of TSC22D2-4 in mIMCD3 cells. (A) Deter-
mination of expression levels of endogenous and transfected
TSC22D2-4 by quantitative real-time PCR. Abundance is expressed
relative to L32 content. Error bars are too small to be visible on the
logarithmic scale that is depicted. Asterisks indicate significant dif-
ferences (P<0.05). Results represent means ± SEM for three
independent experiments. (B) Identification of transfected
TSC22D2-4 ⁄ V5-His-tagged fusion protein expression by western
blot using V5 antibody.
D. F. Fiol et al. Osmotic regulation of TSC22D in kidney cells
FEBS Journal 274 (2007) 109–124 ª 2006 University of California Journal compilation ª 2006 FEBS 117
All nine TSC22D transcripts are expressed in
mouse kidney cells
Expression of all nine TSC22D transcripts was con-
firmed in mouse kidney and in the mIMCD3 cell line.
The levels of expression of all nine TSC22D transcripts
in mIMCD3 cells in vitro were comparable with renal
tissue in vivo suggesting that mIMCD3 cells are a useful
model for studying mechanisms of regulation and func-
tions of TSC22D isoforms in mammalian kidney cells.
The lack of previous evidence for expression of sev-
eral TSC22D transcripts identified in this study sug-
gests that they may be particularly important for
specific biological functions that are prevalent in renal
cells. The multitude of alternatively spliced TSC22D2
gene products could be important for generating func-
tional variability in response to different environmental
cues. However, in the case of hyperosmolality all four
splice variants of TSC22D2 are significantly upregulat-
ed even though the magnitude and kinetics of this up-
regulation was somewhat splice variant specific (see
Discussion below) and the structures of the respective
protein products are also different. Variable exon 2
usage produces proteins with different N-termini adja-
cent to the conserved TSC22D motif. This region is
responsible for transactivation suggesting that TSC22D
variants with truncated N-termini (in particular the
novel TSC22D2-4 variant) may be transcriptional
repressors that sequester other TSC22D family
members [20].
TSC22D2 and TSC22D4 are regulated by
hyperosmolality in kidney cells
In mIMCD3 cells exposed to hyperosmolality
TSC22D2 and TSC22D4 transcripts increase signifi-
cantly but with different kinetics. The increase in
TSC22D2 transcripts is transient and closely resembles
that observed previously for tilapia OSTF1 [12]. Thus,
despite the higher degree of structural homology of
tilapia OSTF1 with murine TSC22D3-1, the novel
murine TSC22D2 transcripts represent the closest
functional homologs of tilapia OSTF1. The magnitude
and kinetics of hyperosmotic upregulation of TSC22D2
splice variants shows some differences. TSC22D2-1 and
TSC22D2-4 responded earlier and more robustly than
TSC22D2-2 and TSC22D2-3.
Splice variants of other genes that respond differen-
tially to osmotic stress have been reported before, e.g.
for cyclooxygenase 1 in human intestinal epithelial
cells [32]. In addition such regulation has been
observed for other types of stress. For instance, Dro-
sophila heat shock transcription factor is regulated by
alternative splicing in response to heat ⁄ cold stress [33].
The splicing factor hSlu7 was reported to alter its sub-
cellular distribution and thus modulate alternative spli-
cing after UV stress [34]. In fact, alternative splicing of
pre-mRNA encoding transcription factors represents a
common mechanism for generating the complexity and
diversity of gene regulation patterns [35–38]. This
mechanism produces a variety of functionally distinct
isoforms from a single gene by use of different combi-
nations of splice junctions. For example, alternative
splicing within the DNA-binding domain of Pax-6
alters DNA-binding specificity of the resulting proteins
[39]. Alternative splicing of the transactivation
domains in Pax-8 [40], the POU homeodomain family
protein Pit-1 [41] and the zinc finger transcription fac-
tor GATA-5 [42] also results in protein isoforms with
different transactivation properties. Deletion by spli-
cing of the transactivation domain in AML1a [43] and
CREB [44] produces proteins with dominant negative
activity. This may also be the case for TSC22D2 splice
variants with a truncated transactivation domain, in
particular TSC22D2-4. Thus, alternative splicing of
TSC22D2 may confer increased complexity of gene
regulation in response to hyperosmotic stress. Our data
indicate that TSC22D2-4 represents a survival factor
for renal cells exposed to hyperosmolality suggesting
that it promotes osmotic adaptation programs, poss-
ibly by acting as a transcriptional repressor of pro-
apoptotic genes.
The time course of hyperosmotic induction of the
murine TSC22D4 transcript is slower than TSC22D2,
more stable, and more closely resembles that
observed previously for TonEBP [45], although more
transient hyperosmotic activation of TonEBP similar
to that of TSC22D2 has also been reported recently
[46]. Moreover, significantly higher levels of TSC22D4
in renal papilla vs. cortex raise the possibility that
this gene is stably upregulated by hyperosmolality not
only in vitro but also in vivo. Of interest, AP1 (jun,
fos) and NF-jB are transcription factors that are
regulated by osmotic stress [47–52] and, intriguingly,
they are known to interact with TSC22D3-2 (GILZ)
[23–25].
TSC22D3 is regulated by aldosterone
in kidney cells
Aldosterone is the major corticosteroid hormone regu-
lating electrolyte and fluid homeostasis in all verte-
brates [53,54]. The major action of the hormone on
renal Na
+
transport is localized to the collecting duct.
Our results show that both TSC22D3 transcripts
increase transiently in response to aldosterone treat-
Osmotic regulation of TSC22D in kidney cells D. F. Fiol et al.
118 FEBS Journal 274 (2007) 109–124 ª 2006 University of California Journal compilation ª 2006 FEBS
ment. Upregulation of TSC22D3-2 (GILZ) by a corti-
costeroid hormone has been observed previously in
human lymphocytes [14], rat kidney [55], human per-
ipheral blood mononuclear cells [56] and in a mouse
kidney cortical collecting duct cell line [21]. Upregula-
tion of TSC22D3-1 by a corticosteroid hormone was
observed in human peripheral blood mononuclear cells
[28]. Thus, TSC22D3 is a gene that is robustly upregu-
lated by corticosteroid hormones in a wide variety of
tissues, including kidney.
Our results indicate an antagonistic effect of aldo-
sterone and hyperosmotic stress on the early responses
of TSC22D2 and TSC22D3 transcripts. Aldosterone
failed to induce TSC22D3 transcripts in the presence
of hyperosmotic stress, and reciprocally, hyperosmotic
stress failed to induce TSC22D2 transcripts in the pres-
ence of 1 lm aldosterone. This phenomenon seems
restricted to the early responses (1–12 h) as long-term
hyperosmotic effects on TSC22D3-2 and TSC22D4
transcripts were not altered by aldosterone. Consistent
with these data, a hypertonic reduction of aldosterone-
stimulated Na
+
transport was reported in rat IMCD
[57]. The molecular mechanism of interaction between
corticosteroid hormone-induced and hypertonic stress-
induced pathways controlling expression of TSC22D
isoforms remains unknown, but our results suggests
that they involve common elements that are affected
antagonistically by these two agents.
The TSC22D1 gene was unresponsive to either
hyperosmolality or aldosterone treatment. Overall, our
data suggest that the four TSC22D genes are not func-
tionally redundant but involved in different aspects of
cellular regulation that are triggered by distinct extra-
cellular signals.
Hyperosmotic upregulation of TSC22D2 is
triggered by hypertonicity and results from
mRNA stabilization
We tested the effect of different hyperosmotic media to
investigate the signal for TSC22D2 upregulation. Our
results show that TSC22D2 is only elevated when
hyperosmotic media are prepared with nonpermeable
solutes. Hyperosmolality per se (resulting from eleva-
tion of cell-permeable solutes) was insufficient to elicit a
response. Thus, we conclude that hypertonicity is the
signal for TSC22D2 upregulation. We recently reported
that tilapia OSTF1 hyperosmotic induction is also
dependant on hypertonicity [58] and in mIMCD3 cells
hypertonicity represents the signal for induction of
mRNAs encoding the TonEBP transcription factor and
multiple genes involved in compatible osmolyte accu-
mulation, protein-, and DNA- stabilization [45,59].
The molecular nature of the hypertonicity signal is
not yet known. Hypertonicity is known to cause many
secondary effects including cell shrinkage, macro- and
micromolecular crowding, changes in the organization
of cell membranes, altered water movements across cell
membranes (osmosis), and stress on the cytoskeleton
[60]. Such secondary effects are independent of the
particular solutes responsible for hypertonicity and our
results illustrate that there is no specific sodium or
chloride ion requirement for TSC22D2 upregulation.
Therefore, we conclude that one or more of the above-
mentioned secondary effects associated with hyper-
tonicity provide the sensory stimulus that triggers
TSC22D2 upregulation.
Of interest, TSC22D2 isoforms responded to hyper-
tonic stress even in the presence of the transcriptional
repressor actinomycin D, indicating that they are regu-
lated by mRNA stabilization. In concordance with
these results, hyperosmotic upregulation of tilapia
OSTF1 is also based on mRNA stabilization [58]. In
addition, mRNA stabilization was also observed in the
regulation of GADD45 genes [59], TonEBP transcrip-
tion factor [46] and aquaporin [61] in response to
hypertonicity. mRNA stabilization is a regulatory
mechanism involved in rapid responses to various
forms of cellular stress, including heat shock [62], UV
irradiation [63,64], hypoxia [65] and nutrient depriva-
tion [66]. This mechanism permits a rapid increase in
steady state mRNA levels by preventing its degrada-
tion. It is characteristic of inducible transcription
factors and other immediate early genes with high
rates of mRNA turnover [67]. Thus, stabilization of
TSC22D2 mRNA during hypertonicity supports a reg-
ulatory role of its protein product for osmotic stress
adaptation of renal cells.
Experimental procedures
Cell culture
Murine inner medullary collecting duct (mIMCD3) cells of
passage 18 were used for all experiments [68]. Cell culture
medium consisted of 45% Ham’s F-12, 45% DMEM, 10%
fetal bovine serum, 10 mUÆmL
)1
penicillin, and 10 lgÆmL
)1
streptomycin (all reagents were from Invitrogen, Carlsbad,
CA). Cells were grown at 37 °C and 5% CO
2
. Final
medium osmolality of isosmotic medium was 300 ± 5
mOsmolÆkg
)1
of H
2
O. Hyperosmotic media were prepared
by the addition of an appropriate amount of NaCl to isos-
motic medium to yield the indicated osmolality. When spe-
cified, choline chloride, sodium gluconate, urea, mannitol
or glycerol instead of NaCl were added for hyperosmotic
media preparation. Final osmolality of all media was
D. F. Fiol et al. Osmotic regulation of TSC22D in kidney cells
FEBS Journal 274 (2007) 109–124 ª 2006 University of California Journal compilation ª 2006 FEBS 119
verified with a microosmometer (Model 3300, Advanced
Instruments, Norwood, MA). Aldosterone (A9477; Sigma,
St Louis, MO) was added when indicated to a final con-
centration of 1 lgÆmL
)1
. Controls with vehicle (ethanol)
were always run in parallel. In all experiments, medium
was substituted 24 h before treatments with a hormone-free
medium, where 10% dextran ⁄ charcoal-treated fetal bovine
serum (Biosource, Rockville, MD, USA) replaced the 10%
fetal bovine serum.
Animals and RNA isolation
C57 ⁄ BL6 mice were obtained from the Jackson Laboratory
(Bar Harbor, ME) and a stock maintained at the ColeB
small animal colony at UC Davis. Mice were kept on a nor-
mal mouse diet with water ad libitum. After culling mice
using CO
2
, kidneys were dissected into papilla, medulla, and
cortex and these tissues immediately snap-frozen in liquid
nitrogen [69]. All procedures were approved by the UC Davis
Institutional Animal Care and Use Committee (IACUC).
Total RNA from mIMCD3 cells or renal tissues was
extracted using Trizol reagent (Invitrogen) as specified by
the manufacturer. RNA was treated with DNase (Turbo
DNA free; Ambion, Austin, TX) and purity was confirmed
and quantity determined by measuring absorbance of the
samples at 260 and 280 nm (340 nm background values were
subtracted) with a Beckman DU520 spectrophotometer.
cDNA synthesis and quantitative real-time PCR
RNA (2 lg for mIMCD3 cells and 0.5 lg for renal tissues)
was reverse-transcribed using Superscript III first-strand
synthesis reagents (Invitrogen) with a random hexamer ⁄
oligo(dT) mix (1 ng ⁄ lL:1lm) as primers. Abundance of
all transcripts was quantified with a PRISM 7500 real-time
thermal cycler (Applied Biosystems, Foster City, CA,
USA). Reactions were performed in duplicate in 20 lL
reaction volume using SYBR Green PCR Master Mix
(Applied Biosystems) and 30 pmol of each primer. PCR
conditions were 50 °C for 2 min and 95 °C for 10 min, fol-
lowed by 40 cycles of 95 °C for 15 s and 60 °C for 1 min.
Data were collected at 60 °C. Efficiencies of individual
PCR reactions were analyzed using LinRegPCR [70] and
were always > 1.9. All data were normalized to abundance
of L32 mRNA encoding a ribosomal protein, and expressed
as fold change over controls as described previously [71].
L32 mRNA was selected as a normalizer gene over 18S
rRNA, b-actin mRNA and GAP-3-DH mRNA based on
highly constant levels of expression during all conditions as
determined in preliminaries assays. Gene-specific primer
sequences were designed with primer express software
(Applied Biosystems). The following sequences were used
as templates for primer design: NM_172086.1(L32) from
GenBank and AK007760 (TSC22D2), AF315352
(TSC22D4), AF201285 (TSC22D1-1), L25785 (TSC22D1-2),
AF024519 (TSC22D3-2), AF201289 (TSC22D3-1) from
EMBL. The absence of unwanted by-products was con-
firmed by automated melting curve analysis and agarose gel
electrophoresis of PCR products.
Analysis of mRNA stability
After 24 h incubation in hormone-free medium, cells were
pretreated for 1 h by adding actinomycin D (Sigma, A9415)
to a final concentration of 5 lgÆmL
)1
. After this 1 h prein-
cubation period cells were dosed with either hyperosmotic
medium or aldosterone or both. Cells were harvested at the
times indicated for measurement of mRNA abundance by
quantitative PCR as described above to measure the stabil-
ity of transcripts in the absence of mRNA synthesis.
Overexpression of epitope-tagged TSC22D2-4
in mIMCD3 cells
TSC22D2-4 ORF was amplified with the primers:
GAAATGTTGTCCACAAGAGTGTC (forward; initiation
codon in bold-type) and TGCTGAGGAGACATTCGG
CTG (reverse) and the correct sequence of the PCR
product was confirmed by double-pass sequencing.
pcDNA5 ⁄ FRT ⁄ Tsc22D2i3 construct was created by cloning
the PCR product in the vector pcDNA5 ⁄ FRT ⁄ V5-His ⁄
Topo vector (Invitrogen). The construct was then propaga-
ted in Escherichia coli strain DH5 (Invitrogen). Endotoxin-
free plasmid Mega-preps were performed using a kit as
described by the manufacturer (Qiagen GmbH, Hilden, Ger-
many). Stable cell lines were established by transfecting
mIMCD3FRT cells (supplementary Fig. S1) with 2 lgofa
1 : 9 mix of pcDNA ⁄ FRT ⁄ Tsc22D2i3 plasmid DNA:
pOG44 plasmid DNA and 4 lL of LipofectAMINE 2000
reagent (Invitrogen). Twenty-four hours after transfection
cells were selected with medium containing 0.6 lgÆmL
)1
hygromycin (Invitrogen). After 2 weeks individual colonies
were picked, expanded, and tested for expression of V5-His
epitope-tagged TSC22D2-4 using quantitative PCR and
western blot analysis.
Protein extraction and western blot analysis
For protein extraction, cells were lyzed in a buffer con-
tained 50 mm TrisÆHCl, pH 7.4, 1% Nonidet P-40, 0.25%
sodium deoxycholate, 150 mm NaCl, 1 mm EDTA, 1 tablet
of minicomplete protease inhibitor mixture (Roche Molecu-
lar Biochemicals, Indianapolis, IN) per 10 mL, 1 mm acti-
vated Na
3
VO
4
, and 1 mm NaF. Protein concentrations
were determined by bicinchoninic acid protein assay
according to the manufacturer’s instructions (Pierce, Rock-
ford, IL). Proteins were separated by SDS ⁄ PAGE. Equal
amounts of protein (20 lg) were loaded in each lane of
12% Tris-glycine SDS ⁄ PAGE gels. Samples were electro-
Osmotic regulation of TSC22D in kidney cells D. F. Fiol et al.
120 FEBS Journal 274 (2007) 109–124 ª 2006 University of California Journal compilation ª 2006 FEBS
phoresed at 125 V, gels briefly rinsed in transfer buffer
(25 mm Tris, 200 mm glycine, 20% methanol), and proteins
blotted onto PDVF membrane (Millipore Corp., Bedford,
MA) at 1 mAÆcm
)2
for 90 min using a TransBlot SD semi-
dry transfer cell (Bio-Rad Laboratories, Hercules, CA).
Membranes were blocked for 30 min at room temperature
in a solution containing 137 mm NaCl, 20 mm Tris, pH 7.6
(HCl), and 3% (w ⁄ v) nonfat dry milk. They were then
incubated for 1 h in blocking buffer containing V5-HRP
antibody (Santa Cruz Biotechnology, Santa Cruz, CA;
1 : 5000). Blots were developed with SuperSignal Femto
(Pierce) and imaged with a chemiimager (Alpha Innotech,
San Leandro, CA, USA).
Cell-viability assay
Cells were grown in 12-well plates and harvested after being
treated as indicated in the results section. Appropriate dilu-
tions of cell suspensions were obtained in 0.2% methylene
blue, incubated for 1 min, and viable (unstained) cells and
dead (stained cells) were counted in Neubauer hemocyto-
meter chambers.
Bioinformatics and statistical analysis
Multiple sequence alignments and phylogentic trees were
constructed with alignx software (Informax, Bethesda,
MD, USA). Data analysis was carried out with sigma-
plot 9.0 (Systat, San Jose, CA, USA). Differences between
pairs of data were analyzed by unpaired t-test. Differences
in time series data sets were statistically evaluated using
ANOVA. Significance threshold was set at P < 0.05 and
data are presented as mean ± SEM.
Acknowledgements
We would like to thank Dr Devulapalli Chakravarty
for assistance with the generation of the mIMCD3FRT
cell lines. This study was supported by a grant from
the National Institute of Diabetes and Digestive and
Kidney diseases (NIH R01-DK59470). Its contents are
solely the responsibility of the authors and do not
necessarily represent the official views of the NIH.
References
1 Burg MB, Kwon ED & Ku
¨
ltz D (1996) Osmotic regu-
lation of gene expression. FASEB J 10, 1598–1606.
2 Burg MB, Kwon ED & Ku
¨
ltz D (1997) Regulation of
gene expression by hypertonicity. Annu Rev Physiol 59,
437–455.
3 Handler JS & Kwon HM (1997) Kidney cell survival
in high tonicity. Comp Biochem Physiol Physiol 117,
301–306.
4 Somero GN & Yancey P (1997) Osmolytes and cell
volume regulation: physiological and evolutionary
principles. In Handbook of Cell Physiology (Hoffmann
JF & Jamieson JD, eds), pp. 441–484. Oxford
University Press, Oxford.
5 Miyakawa H, Woo SK, Chen CP, Dahl SC, Handler
JS & Kwon HM (1998) Cis- and trans-acting factors
regulating transcription of the BGT1 gene in response
to hypertonicity. Am J Physiol 274, F753–F761.
6 Woo SK, Lee SD, Na KY, Park WK & Kwon HM
(2002) TonEBP ⁄ NFAT5 stimulates transcription of
HSP70 in response to hypertonicity. Mol Cell Biol 22,
5753–5760.
7 Nakayama Y, Peng T, Sands JM & Bagnasco SM
(2000) The TonE ⁄ TonEBP pathway mediates
tonicity-responsive regulation of UT-A urea transporter
expression. J Biol Chem 275, 38275–38280.
8Ku
¨
ltz D, Garcia-Perez A, Ferraris JD & Burg MB
(1997) Distinct regulation of osmoprotective genes
in yeast and mammals. Aldose reductase osmotic
response element is induced independent of p38
and stress-activated protein kinase ⁄ Jun N-terminal
kinase in rabbit kidney cells. J Biol Chem 272, 13165–
13170.
9 Dmitrieva N, Ku
¨
ltz D, Michea L, Ferraris J & Burg M
(2000) Protection of renal inner medullary epithelial
cells from apoptosis by hypertonic stress-induced p53
activation. J Biol Chem 275, 18243–18247.
10 Ku
¨
ltz D & Chakravarty D (2001) Maintenance of
genomic integrity in mammalian kidney cells exposed
to hyperosmotic stress. Comp Biochem Physiol Mol
Integr Physiol 130, 421–428.
11 Ferraris JD, Persaud P, Williams CK, Chen Y & Burg
MB (2002) cAMP-independent role of PKA in tonicity-
induced transactivation of tonicity-responsive
enhancer ⁄ osmotic response element-binding protein.
Proc Natl Acad Sci USA 99, 16800–16805.
12 Fiol DF & Ku
¨
ltz D (2005) Rapid hyperosmotic coin-
duction of two tilapia (Oreochromis mossambicus) tran-
scription factors in gill cells. Proc Natl Acad Sci USA
102, 927–932.
13 Shibanuma M, Kuroki T & Nose K (1992) Isolation of
a gene encoding a putative leucine zipper structure that
is induced by transforming growth factor beta 1 and
other growth factors. J Biol Chem 267, 10219–10224.
14 D’Adamio F, Zollo O, Moraca R, Ayroldi E, Bruscoli
S, Bartoli A, Cannarile L, Migliorati G & Riccardi C
(1997) A new dexamethasone-induced gene of the
leucine zipper family protects T lymphocytes from
TCR ⁄ CD3-activated cell death. Immunity 7, 803–812.
15 Hubbard T, Barker D, Birney E, Cameron G, Chen Y,
Clark L, Cox T, Cuff J, Curwen V, Down T et al.
(2002) The Ensembl genome database project. Nucleic
Acids Res 30, 38–41.
D. F. Fiol et al. Osmotic regulation of TSC22D in kidney cells
FEBS Journal 274 (2007) 109–124 ª 2006 University of California Journal compilation ª 2006 FEBS 121
16 Blake JA, Richardson JE, Bult CJ, Kadin JA & Eppig
JT (2003) MGD: the mouse genome database. Nucleic
Acids Res 31, 193–195.
17 Burge C & Karlin S (1997) Prediction of complete gene
structures in human genomic DNA. J Mol Biol 268,
78–94.
18 Birney E, Clamp M & Durbin R (2004) GeneWise and
Genomewise. Genome Res 14, 988–995.
19 Mak SK & Ku
¨
ltz D (2004) Gadd45 proteins induce
G
2
⁄ M arrest and modulate apoptosis in kidney cells
exposed to hyperosmotic stress. J Biol Chem 279,
39075–39084.
20 Kester HA, Blanchetot C, den Hertog J, van der Saag
PT & van der Burg B (1999) Transforming growth fac-
tor-beta-stimulated clone-22 is a member of a family of
leucine zipper proteins that can homo- and heterodi-
merize and has transcriptional repressor activity. J Biol
Chem 274, 27439–27447.
21 Robert-Nicoud M, Flahaut M, Elalouf JM, Nicod M,
Salinas M, Bens M, Doucet A, Wincker P, Artiguenave
F, Horisberger JD et al. (2001) Transcriptome of a
mouse kidney cortical collecting duct cell line: effects of
aldosterone and vasopressin. Proc Natl Acad Sci USA
98, 2712–2716.
22 Tynan SH, Lundeen SG & Allan GF (2004) Cell type-
specific bidirectional regulation of the glucocorticoid-
induced leucine zipper (GILZ) gene by estrogen.
J Steroid Biochem Mol Biol 91, 225–239.
23 Mittelstadt PR & Ashwell JD (2001) Inhibition of AP-1
by the glucocorticoid-inducible protein GILZ. J Biol
Chem 276, 29603–29610.
24 Ayroldi E, Zollo O, Macchiarulo A, Di Marco B,
Marchetti C & Riccardi C (2002) Glucocorticoid-
induced leucine zipper inhibits the Raf-extracellular
signal-regulated kinase pathway by binding to Raf-1.
Mol Cell Biol 22, 7929–7941.
25 Asselin-Labat ML, David M, Biola-Vidamment A,
Lecoeuche D, Zennaro MC, Bertoglio J & Pallardy M
(2004) GILZ, a new target for the transcription factor
FoxO3, protects T lymphocytes from interleukin-2
withdrawal-induced apoptosis. Blood 104, 215–223.
26 Soundararajan R, Zhang TT, Wang J, Vandewalle A &
Pearce D (2005) A novel role for glucocorticoid-
induced leucine zipper protein in epithelial sodium
channel-mediated sodium transport. J Biol Chem 280,
39970–39981.
27 Sillard R, Schulz-Knappe P, Vogel P, Raida M,
Bensch KW, Forssmann WG & Mutt V (1993) A
novel 77-residue peptide from porcine brain contains a
leucine-zipper motif and is recognized by an antiserum
to delta-sleep-inducing peptide. Eur J Biochem 216,
429–436.
28 Franchimont D, Galon J, Vacchio MS, Fan S, Visconti
R, Frucht DM, Geenen V, Chrousos GP, Ashwell JD
& O’Shea JJ (2002) Positive effects of glucocorticoids
on T cell function by up-regulation of IL-7 receptor
alpha. J Immunol 168, 2212–2218.
29 Fiorenza MT, Mukhopadhyay M & Westphal H (2001)
Expression screening for Lhx3 downstream genes iden-
tifies Thg-1pit as a novel mouse gene involved in pitui-
tary development. Gene 278, 125–130.
30 Strausberg RL, Feingold EA, Grouse LH, Derge JG,
Klausner RD, Collins FS, Wagner L, Shenmen CM,
Schuler GD, Altschul SF et al. (2002) Generation and
initial analysis of more than 15,000 full-length human
and mouse cDNA sequences. Proc Natl Acad Sci USA
99, 16899–16903.
31 Carninci P & Hayashizaki Y (1999) High-efficiency full-
length cDNA cloning. Methods Enzymol 303, 19–44.
32 Nurmi JT, Puolakkainen PA & Rautonen NE (2005)
Intron 1 retaining cyclooxygenase 1 splice variant is
induced by osmotic stress in human intestinal epithelial
cells. Prostagland Leukocyt Essent Fatty Acids 73, 343–
350.
33 Fujikake N, Nagai Y, Popiel HA, Kano H, Yamaguchi
M & Toda T (2005) Alternative splicing regulates the
transcriptional activity of Drosophila heat shock tran-
scription factor in response to heat ⁄ cold stress. FEBS
Lett
579, 3842–3848.
34 Shomron N, Alberstein M, Reznik M & Ast G (2005)
Stress alters the subcellular distribution of hSlu7 and
thus modulates alternative splicing. J Cell Sci 118,
1151–1159.
35 Hashimoto Y, Zhang C, Kawauchi J, Imoto I, Adachi
MT, Inazawa J, Amagasa T, Hai T & Kitajima S
(2002) An alternatively spliced isoform of transcrip-
tional repressor ATF3 and its induction by stress
stimuli. Nucleic Acids Res 30, 2398–2406.
36 Lopez AJ (1995) Developmental role of transcription
factor isoforms generated by alternative splicing. Dev
Biol 172, 396–411.
37 Lopez AJ (1998) Alternative splicing of pre-mRNA:
developmental consequences and mechanisms of regula-
tion. Annu Rev Genet 32, 279–305.
38 Cooper TA & Mattox W (1997) The regulation of
splice-site selection, and its role in human disease.
Am J Hum Genet 61, 259–266.
39 Chen CY & Schwartz RJ (1996) Recruitment of the tin-
man homolog Nkx-2.5 by serum response factor acti-
vates cardiac alpha-actin gene transcription. Mol Cell
Biol 16, 6372–6384.
40 Kozmik Z, Kurzbauer R, Dorfler P & Busslinger M
(1993) Alternative splicing of Pax-8 gene transcripts is
developmentally regulated and generates isoforms with
different transactivation properties. Mol Cell Biol 13,
6024–6035.
41 Morris AE, Kloss B, McChesney RE, Bancroft C &
Chasin LA (1992) An alternatively spliced Pit-1 isoform
altered in its ability to trans-activate. Nucleic Acids Res
20, 1355–1361.
Osmotic regulation of TSC22D in kidney cells D. F. Fiol et al.
122 FEBS Journal 274 (2007) 109–124 ª 2006 University of California Journal compilation ª 2006 FEBS
42 MacNeill C, Ayres B, Laverriere AC & Burch JB
(1997) Transcripts for functionally distinct isoforms
of chicken GATA-5 are differentially expressed
from alternative first exons. J Biol Chem 272, 8396–
8401.
43 Tanaka T, Tanaka K, Ogawa S, Kurokawa M, Mitani
K, Nishida J, Shibata Y, Yazaki Y & Hirai H (1995)
An acute myeloid leukemia gene, AML1, regulates
hemopoietic myeloid cell differentiation and transcrip-
tional activation antagonistically by two alternative
spliced forms. EMBO J 14, 341–350.
44 Foulkes NS & Sassone-Corsi P (1992) More is better:
activators and repressors from the same gene. Cell 68,
411–414.
45 Woo SK, Dahl SC, Handler JS & Kwon HM (2000)
Bidirectional regulation of tonicity-responsive enhancer
binding protein in response to changes in tonicity.
Am J Physiol Renal Physiol 278, F1006–F1012.
46 Cai Q, Ferraris JD & Burg MB (2005) High NaCl
increases TonEBP ⁄ OREBP mRNA and protein by
stabilizing its mRNA. Am J Physiol Renal Physiol 289,
803–807.
47 Ku
¨
ltz D (1996) Plasticity and stressor specificity of
osmotic and heat shock responses of Gillichthys mirabil-
is gill cells. Am J Physiol 271, C1181–C1193.
48 Ying Z, Reisman D & Buggy J (1996) AP-1 DNA
binding activity induced by hyperosmolality in the rat
hypothalamic supraoptic and paraventricular nuclei.
Brain Res Mol Brain Res 39, 109–116.
49 Clerk A & Sugden PH (1997) Cell stress-induced phos-
phorylation of ATF2 and c-Jun transcription factors in
rat ventricular myocytes. Biochem J 325, 801–810.
50 Nemeth ZH, Deitch EA, Szabo C & Hasko G (2002)
Hyperosmotic stress induces nuclear factor-kappaB
activation and interleukin-8 production in human
intestinal epithelial cells. Am J Pathol 161, 987–996.
51 Pingle SC, Sanchez JF, Hallam DM, Williamson AL,
Maggirwar SB & Ramkumar V (2003) Hypertonicity
inhibits lipopolysaccharide-induced nitric oxide synthase
expression in smooth muscle cells by inhibiting nuclear
factor kappaB. Mol Pharmacol 63, 1238–1247.
52 Rao R, Hao CM & Breyer MD (2004) Hypertonic
stress activates glycogen synthase kinase 3beta-
mediated apoptosis of renal medullary interstitial cells,
suppressing an NFkappaB-driven cyclooxygenase-2-
dependent survival pathway. J Biol Chem 279, 3949–
3955.
53 Horisberger JD & Rossier BC (1992) Aldosterone regu-
lation of gene transcription leading to control of ion
transport. Hypertension 19, 221–227.
54 Verrey F (1995) Transcriptional control of sodium
transport in tight epithelial by adrenal steroids.
J Membr Biol 144, 93–110.
55 Muller OG, Parnova RG, Centeno G, Rossier BC,
Firsov D & Horisberger JD (2003) Mineralocorticoid
effects in the kidney: correlation between alphaENaC,
GILZ, and Sgk-1 mRNA expression and urinary excre-
tion of Na
+
and K
+
. J Am Soc Nephrol 14, 1107–
1115.
56 Smit P, Russcher H, de Jong FH, Brinkmann AO,
Lamberts SW & Koper JW (2005) Differential regula-
tion of synthetic glucocorticoids on gene expression
levels of glucocorticoid-induced leucine zipper and
interleukin-2. J Clin Endocrinol Metab 90, 2994–3000.
57 Husted RF & Stokes JB (1996) Separate regulation of
Na
+
and anion transport by IMCD: location, aldoster-
one, hypertonicity, TGF-beta 1, and cAMP. Am J
Physiol 271, F433–F439.
58 Fiol DF, Chan SY & Ku
¨
ltz D (2006) Regulation of
osmotic stress transcription factor 1 (Ostf1) in tilapia
(Oreochromis mossambicus) gill epithelium during sali-
nity stress. J Exp Biol 209, 3257–3265.
59 Chakravarty D, Cai Q, Ferraris JD, Michea L, Burg
MB & Ku
¨
ltz D (2002) Three GADD45 isoforms contri-
bute to hypertonic stress phenotype of murine renal
inner medullary cells. Am J Physiol Renal Physiol 283,
F1020–F1029.
60 Ku
¨
ltz D & Burg MB (1998) Intracellular signaling in
response to osmotic stress. Contrib Nephrol 123, 94–
109.
61 Leitch V, Agre P & King LS (2001) Altered ubiquitina-
tion and stability of aquaporin-1 in hypertonic stress.
Proc Natl Acad Sci USA 98, 2894–2898.
62 Andrews GK, Harding MA, Calvet JP & Adamson ED
(1987) The heat shock response in HeLa cells is accom-
panied by elevated expression of the c-fos proto-onco-
gene. Mol Cell Biol 7 , 3452–3458.
63 Wang W, Furneaux H, Cheng H, Caldwell MC, Hutter
D, Liu Y, Holbrook N & Gorospe M (2000) HuR reg-
ulates p21 mRNA stabilization by UV light. Mol Cell
Biol 20, 760–769.
64 Westmark CJ, Bartleson VB & Malter JS (2005) RhoB
mRNA is stabilized by HuR after UV light. Oncogene
24, 502–511.
65 Levy NS, Chung S, Furneaux H & Levy AP (1998)
Hypoxic stabilization of vascular endothelial growth
factor mRNA by the RNA-binding protein HuR.
J Biol Chem 273, 6417–6423.
66 Yaman I, Fernandez J, Sarkar B, Schneider RJ, Snider
MD, Nagy LE & Hatzoglou M (2002) Nutritional con-
trol of mRNA stability is mediated by a conserved
AU-rich element that binds the cytoplasmic shuttling
protein HuR. J Biol Chem 277, 41539–41546.
67 Bakheet T, Frevel M, Williams BR, Greer W &
Khabar KS (2001) ARED: human AU-rich element-
containing mRNA database reveals an unexpectedly
diverse functional repertoire of encoded proteins.
Nucleic Acids Res 29, 246–254.
68 Rauchman MI, Nigam SK, Delpire E & Gullans SR
(1993) An osmotically tolerant inner medullary
D. F. Fiol et al. Osmotic regulation of TSC22D in kidney cells
FEBS Journal 274 (2007) 109–124 ª 2006 University of California Journal compilation ª 2006 FEBS 123
collecting duct cell line from an SV40 transgenic mouse.
Am J Physiol 265, F416–F424.
69 Valkova N, Yunis R, Mak SK, Kang K & Ku
¨
ltz D
(2005) Nek8 mutation causes overexpression of
galectin-1, sorcin, and vimentin and accumulation of
the major urinary protein in renal cysts of jck mice.
Mol Cell Proteomics 4, 1009–1018.
70 Ramakers C, Ruijter JM, Deprez RH & Moorman AF
(2003) Assumption-free analysis of quantitative
real-time polymerase chain reaction (PCR) data.
Neurosci Lett 339 , 62–66.
71 Pfaffl MW (2001) A new mathematical model for
relative quantification in real-time RT-PCR. Nucleic
Acids Res 29, 45.
Supplementary material
The following supplementary material is available
online:
Fig. S1. Three new isogenic cell lines of mIMCD3 cells
(mIMCD3–FRT1 mIMCD3–FRT2, mIMCD3–FRT3)
were constructed using the Flp-In system (Invitrogen).
To create the new mIMCD3-FRT cell lines, mIMCD3
cells were first stably transfected with pFRT lacZeo
)1
using lipofectamine 2000 (Invitrogen) and then selected
for 14 days in 600 lgÆmL
)1
Zeocin. (A) Three neigh-
boring cell colonies with high levels of b-galactosidase
activity were expanded and stained with X-Gal (blue
color; mIMCD3-FRT1 mIMCD3-FRT2, mIMCD3-
FRT3). (B) A Southern blot developed with a probe
that is specific for the incorporated FRT site shows
that all three new isogenic cell lines originated from
the same clone and have a single FRT site stably integ-
rated into the genome.
Fig. S2. mIMCD3 cells were preincubated for 1 h with
5 lgÆmL
)1
actinomycin D (gray bars) or left untreated
(controls, black bars). Aldosterone was added to a
final concentration of 1 lm and at the indicated times
RNA levels were determined by quantitative real-time
PCR and normalized to L32. Data represent the mean
and error bars for three independent experiments.
Table S1. Sequences for all PCR primers used in this
study, listed in 5¢-to3¢ direction.
This material is available as part of the online article
from
Please note: Blackwell Publishing is not responsible
for the content or functionality of any supplementary
materials supplied by the authors. Any queries (other
than missing material) should be directed to the corre-
sponding author for the article.
Osmotic regulation of TSC22D in kidney cells D. F. Fiol et al.
124 FEBS Journal 274 (2007) 109–124 ª 2006 University of California Journal compilation ª 2006 FEBS