Báo cáo khoa học: DG-based prediction and experimental confirmation of SYCRP1-binding sites on the Synechocystis genome pot
Bạn đang xem bản rút gọn của tài liệu. Xem và tải ngay bản đầy đủ của tài liệu tại đây (450.13 KB, 10 trang )
DG-based prediction and experimental confirmation of
SYCRP1-binding sites on the Synechocystis genome
Katsumi Omagari
1
, Hidehisa Yoshimura
2
, Takayuki Suzuki
2
, Mitunori Takano
3
, Masayuki Ohmori
2,4
and Akinori Sarai
5
1 Department of Virology, Medical School, Nagoya City University, Japan
2 Department of Life Sciences, Graduate School of Arts and Sciences, The University of Tokyo, Japan
3 Department of Physics, School of Science and Engineering, Waseda University, Tokyo, Japan
4 Department of Biological Sciences, Faculty of Science and Engineering, Chuo University, Tokyo, Japan
5 Department of Biochemical Engineering and Science, Kyushu Institute of Technology (KIT), Fukuoka, Japan
The cAMP receptor protein (CRP) that was first iden-
tified in Esherichia coli exists in many other organisms.
SYCRP1 is a cAMP receptor protein found in the cya-
nobacterium Synechocystis sp. PCC 6803 [1]. Although
E. coli CRP is a global transcription factor controlling
20–100 genes, SYCRP1 has been reported to control
only the slr1667–slr1668 operon [2,3]. However, many
other genes are expected to be regulated by SYCRP1
because the concentration of cAMP in Synechocystis
cell changes under blue-light irradiation [4,5].
A number of methods for predicting binding sites of
transcription factors in the genome have been developed
over the last three decades. The methods can be classified
into three groups according to the type of information
used in the prediction [6]: (a) the sequence-based method,
(b) the structure-based method, and (c) the DG-based
method. The sequence-based method uses the alignment
of known binding sequences for screening the database
for potential target binding sites [6,7], and relies on
sequence information obtained from known binding sites
of transcription factors [8]. The structure-based method
aligns different DNA sequences on the protein–DNA
framework and quantitatively estimates the fitness of
the complex structures with those sequences [9]. The
DG-based method utilizes the change in the binding free
energy, DDG, which is defined as the difference between
the binding free energy of a protein to a mutant DNA
sequence and that to the consensus DNA sequence, to
predict potential target binding sites of a transcription
factor [6,10]. The set of DDG values is determined by
Keywords
additivity; binding free energy change; DNA-
binding sites; prediction; regulatory protein
Correspondence
K. Omagari, Department of Virology,
Medical School, Nagoya City University,
1 Kawasumi, Mizuho, Nagoya, 467-8601,
Japan
Tel ⁄ Fax: +81 52 853 8191 ⁄ 3638
E-mail:
(Received 13 April 2008, revised 21 June
2008, accepted 30 July 2008)
doi:10.1111/j.1742-4658.2008.06618.x
DNA-binding sites for SYCRP1, which is a regulatory protein of the
cyanobacterium Synechocystis sp. PCC6803, were predicted for the whole
genome sequence by estimating changes in the binding free energy
(DDG
A
total
) for SYCRP1 for those sites. The DDG
A
total
values were calculated
by summing DDG values derived from systematic single base-pair substitu-
tion experiments (symmetrical and cooperative binding model). Of the cal-
culated binding sites, 23 sites with a DDG
A
total
value < 3.9 kcalÆmol
)1
located
upstream or between the ORFs were selected as putative binding sites for
SYCRP1. In order to confirm whether SYCRP1 actually binds to these
binding sites or not, 11 sites with the lowest DDG
A
total
values were tested
experimentally, and we confirmed that SYCRP1 binds to ten of the 11 sites
with a DDG
total
value < 3.9 kcalÆmol
)1
. The best correlation coefficient
between DDG
A
total
and the observed DDG
total
for binding of SYCRP1 to
those sites was 0.78. These results suggest that the DDG values derived
from systematic single base-pair experiments may be used to screen for
potential binding sites of a regulatory protein in the genome sequence.
Abbreviations
CRP, cAMP receptor protein; EMSA, electrophoresis mobility shift assay; ICAP, the consensus DNA sequence for E. coli CRP. Positions
within the DNA site are the same as the numbering in [15].
4786 FEBS Journal 275 (2008) 4786–4795 ª 2008 The Authors Journal compilation ª 2008 FEBS
conducting systematic single base-pair substitution
experiments, in which each single base pair of the
consensus DNA sequence of binding sites is substituted
by all other possible base pairs to determine the respec-
tive base-pair contributions to the binding free energy of
a transcription factor to DNA. To date, DDG values
have been measured for six transcription factors, Cro
and the k repressor, c-Myb, the ERF domain, E. coli
CRP and SYCRP1 [11–16]. The DDG values for c-Myb,
for example, have been successfully used not only to pre-
dict binding sites that are in agreement with many puta-
tive binding sites but also to locate sequences of several
new promoters that could be targets for c-Myb [6,10].
In this study, we searched the whole genome sequence
for potential binding sites of SYCRP1 that are upstream
of ORFs and tightly bound in vitro, using the DG-based
method. The potential binding sites were assumed to
bind to SYCRP1 only, although other co-factors related
to gene regulation might change the sequence pattern of
DNA binding sites [17]. SYCRP1 binds tightly to the
consensus palindromic DNA sequence of E. coli
CRP, T
4
G
5
T
6
G
7
A
8
T
9
C
10
T
11
|A
12
G
13
A
14
T
15
C
16
A
17
C
18
A
19
.
Three amino acids (Arg180, Glu181 and Arg185) in
E. coli CRP that interact with GC base pairs at posi-
tions 5 and 7 through hydrogen bonding are completely
conserved [2]. The DDG values for SYCRP1 for the
respective base-pair substitutions at positions 4–8 in the
consensus sequence have been derived from systematic
single base-pair substitution experiments [16]. To
increase the accuracy of the prediction, additional DDG
values for positions 9–11 in the consensus sequence were
measured using an electrophoresis mobility shift assay
(EMSA). The measurement enabled us to identify
another important base pair involved in specific binding
of SYCRP1 that had little effect on the binding of
E. coli CRP. For prediction of binding sites of SYCRP1
in the genome sequence, the total changes in binding
free energy (DDG
A
total
) for every 16 bp DNA segment
were calculated by summing DDG values for the respec-
tive base pairs within the segment. Binding of SYCRP1
to the sites with the lowest DDG
A
total
values was con-
firmed by EMSA. It was found that SYCRP1 binds to
hitherto unknown sites, and it is suggested that SYC-
RP1 regulates genes downstream of the sites.
Results
Systematic single base-pair substitution
experiments for the spacer region in the
consensus sequence
In order to include the effects of a spacer region for pre-
diction of SYCRP1 binding sites, we measured the DDG
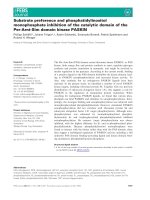
values of SYCRP1 at positions 9–11 (Fig. 1A) using
systematic single base-pair substitution experiments.
The spacer region is a segment of DNA flanked by the
positions 4–8 that strongly interact with amino acids of
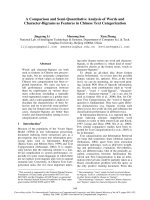
each monomer of a SYCRP1 dimer. Figure 2 shows the
DDG values for the respective base-pair substitutions at
positions 9–11 (this study) and positions 4–8 [16]. A
positive DDG value means that the binding affinity is
reduced by the base-pair substitution. Substitution of T
by A at position 9 caused a 2.0 kcalÆmol
)1
increase in
the DDG value, which is the largest among the substitu-
tions at positions 9–11. This increase is of the same
magnitude as those for substitutions at positions 6 and
8. Substitution of T by G at position 9 also showed a
non-negligible change in DDG. Substitution of T by C
at position 9 and all substitutions at positions 10 and 11
changed DDG values slightly by < 0.5 kcalÆmol
)1
,
which is smaller than the changes for substitutions at
position 4, at which there is no interaction between the
base pair and any amino acids of SYCRP1 [16].
Estimation of DDG
A
total
for the whole genome
sequence using DDG values derived from
systematic single base-pair substitution
experiments
Using the DDG values for positions 4–8 obtained previ-
ously [16] and those for positions 9–11 obtained in this
study, we searched the Synechocystis genome for SYC-
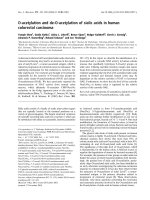
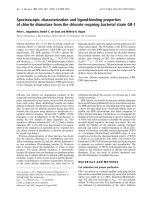
RP1 binding sites. Figure 3 shows the procedure for
the DDG-based prediction. The binding affinity of
SYCRP1 to a fragment of 16 bp is estimated as the
sum of the DDG values at each position. The window
of 16 bp was moved 1 bp at a time along the genome
sequence, and the binding affinity of SYCRP1 to each
segment was evaluated in terms of the change in bind-
ing free energy (DDG
A
total
). The calculation was based
on the assumption of cooperative binding, whereby a
symmetrical dimer of SYCRP1 binds to the two half
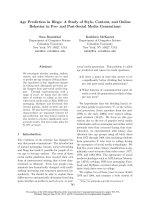
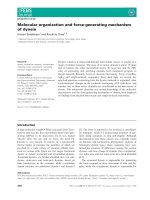
sites in a twofold-symmetrical manner. Figure 4 shows
a typical example of the distribution of DDG
A
total
values
around genes regulated by SYCRP1 (slr1667–slr1668
operon). The position with the lowest DDG
A
total
value
corresponds to the known binding site for SYCRP1.
The histogram of DDG
A
total
values for the whole genome
(Fig. 5) shows that the DDG
A
total
values ranged from -
0.02 to 33.8 kcalÆmol
)1
. The number of sites with low
DDG
A
total
values was very small. Sites with DDG
A
total
< 3.9 kcalÆmol
)1
were selected as potential binding
sites in this study because those sites could be con-
firmed to bind to SYCRP1 experimentally. There were
seven sites for which DDG
A
total
was < 1.3 kcalÆmol
)1
,
17 for which 1.3 £ DDG
A
total
< 2.6 kcalÆmol
)1
, and 114
K. Omagari et al. DG-based prediction of DNA binding sites by SYCRP1
FEBS Journal 275 (2008) 4786–4795 ª 2008 The Authors Journal compilation ª 2008 FEBS 4787
for which 2.6 £ DDG
A
total
< 3.9 kcalÆmol
)1
. Of them,
we selected sites with a lowDDG
A
total
value upstream or
between ORFs as putative binding sites. Twenty-three
putative binding sites were obtained (Table 1). The
binding site for the slr1667–slr1668 operon, which is
regulated by SYCRP1, is included among these sites.
Confirmation of SYCRP1 binding to putative
binding sites
In order to confirm whether SYCRP1 actually binds
to the putative binding sites, we performed an EMSA
to measure changes in binding free energy (observed
DDG
total
) for the 11 binding sites with the lowest
DDG
A
total
values of the 23 putative binding sites. There
were seven binding sites for which DDG
A
total
< 2.6
kcalÆmol
)1
and four for which 2.6 £ DDG
A
total
< 3.9 kcalÆ-
mol
)1
. Figure 6 shows the result of the EMSA experi-
ments. The experiments confirmed that SYCRP1
bound all the putative binding sites with
DDG
A
total
< 2.6 kcalÆmol
)1
. The intensity of the complex
band increased when the concentration of SYCRP1
was increased. The increment varied with the DNA
sequence to which the SYCRP1 bound. The intensity
of the complex band decreased with the increase in
DDG
A
total
value. In Fig. 7, we plotted DDG
A
total
versus
the observed DDG
total
and found a high correlation
coefficient (0.78). For putative binding sites with
DDG
A
total
< 0.5 kcalÆmol
)1
, the DDG
A
total
values agreed
well with the observed DDG
total
values. For those sites
with 0.5 £ DDG
A
total
< 2.6 kcalÆmol
)1
, DDG
A
total
values
were twice as large as the observed DDG
total
values.
Among those with 2.6 £ DDG
A
total
< 3.9 kcalÆmol
)1
, the
DDG
A
total
values of two putative binding sites, sll1874
A
B
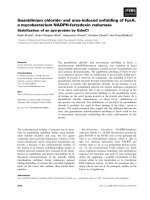
Fig. 1. (A) Systematic single base-pair sub-
stitutions of the DNA sequence. The substi-
tuted DNA sequences were used to
measure DDG values in binding experi-
ments. ICAP represents a reference
sequence for DG values in this study.
Positions 9–11 in ICAP were subjected to
systematic single base-pair substitutions. All
possible DNA sequences with single base-
pair substitutions are shown. (B) DNA
sequences used for binding-confirmation
experiments: DNA sequences used to con-
firm whether SYCRP1 binds to putative
binding sites or not are shown. Eleven puta-
tive binding sites selected in ascending
order of DDG
A
total
are shown.
5′-TGTGATCT-3′
AC
4
4
3
2
1
ΔΔG (kcal·mol
–1
)
0
567891011
G ACT ACG ACT CGT ACG ACGAGT
3′-ACACTAGA-5′
Fig. 2. DDG values obtained in systematic single base-pair substitu-
tion experiments. The changes in binding free energy were deter-
mined from dissociation constant (K
d
) values measured by using
EMSA. The sequence shown at the bottom is that of ICAP. DDG
values for positions 4–8 were measured by Omagari et al. [16].
Error bars are the standard errors calculated from three indepen-
dent experiments.
DG-based prediction of DNA binding sites by SYCRP1 K. Omagari et al.
4788 FEBS Journal 275 (2008) 4786–4795 ª 2008 The Authors Journal compilation ª 2008 FEBS
and sll1708, agreed well with the observed DDG
total
values. However, the DDG
A
total
value of the putative
binding site slr1928 was three times larger than the
observed DD G
total
value. For slr0733, the free DNA
bands and the complex bands were not separated com-
pletely because of the tailing from free DNA bands.
One possible reason is that the binding of SYCRP1 to
slr0733 was weaker than to sll1874 and sll1708, such
that the SYCRP1 and DNA complex dissociated dur-
ing electrophoresis. Thus, the observed DDG
total
value
for slr0733 may be larger than the predicted DDG
A
total
for that value.
Discussion
Systematic single base-pair substitution
experiments
Interactions of SYCRP1 with base pairs in the spacer
region, which connects two half sites containing a
consensus DNA sequence, were investigated using sys-
tematic single base-pair experiments. Those experi-
ments showed that the substitutions of T by A or G at
position 9 caused the largest significant changes in
DDG value in the spacer region. This spacer region is
important for binding of SYCRP1 to DNA and pre-
diction of potential binding sites. The predicted
DDG
A
total
values and observed DDG values exhibited
good correlation (correlation coefficient of 0.78). The
goodness of fit varied when the values for positions
4–8 were used in this search. These results showed
rather weak correlation (correlation coefficient of
0.28). Inclusion of the DDG values for positions 9–11
enhanced the correlation between the predicted
DDG
A
total
values and the observed DDG
total
values. For
E. coli CRP, the spacer region does not significantly
affect binding [18]. In the E. coli CRP–DNA complex,
there is no direct contact between bases and amino
acids at these sites [19], and show interactions between
amino acids and phosphates which are important for
Fig. 3. Procedure for calculating DDG
A
total
for the Synechocystis genome. The DD G values for each base position with respect to three
substituted bases define the mutation matrix, as shown in the table. Sequences of length 16 bp were extracted from the genome, and DDG
values corresponding to these base pairs were summed. As an example, the DDG values shown in italic in the mutation matrix are summed,
giving a DDG
A
total
value for the sample sequence of 1.64 kcalÆmol
)1
. Similar calculations were repeated for the whole genome sequence.
K. Omagari et al. DG-based prediction of DNA binding sites by SYCRP1
FEBS Journal 275 (2008) 4786–4795 ª 2008 The Authors Journal compilation ª 2008 FEBS 4789
binding [20]. According to the predicted structure of
the SYCRP1–DNA complex [2], the base pairs at posi-
tions 4–8 may form interactions with an a helix of
SYCRP1 and base pairs at positions 9–11 may show
no interaction with amino acids. We cannot determine
whether interactions between bases and amino acids or
other interactions are responsible for these changes
from this study alone. Detailed structural information
on both SYCRP1 and the SYCRP1–DNA complex
would provide clues to clarify this issue.
Examination of additivity
Binding sites were predicted based on the assumption
of additivity of changes in binding free energy in this
study. The predicted DDG
A
total
values and observed
DDG values exhibited good correlation (correlation
coefficient of 0.78). While the additivity assumption
provided a certain degree of goodness-of-fit, the pre-
dicted DDG
A
total
values were not completely equal to
observed DDG values. The predicted values were larger
than observed ones. Although the sequence of the
binding site (positions 4–19) upstream of sll1268
(No. 2 in Fig. 7) is identical with the consensus
sequence, the observed DDG
total
value was not zero
even considering the error bar. However, the observed
DDG
total
value for slr1351 (number 4 in Fig. 7), whose
sequence has only single mutation, was about the same
as that of the consensus sequence. This indicates that
sites outside the binding site have a non-negligible con-
tribution to DDG value. In addition, the additivity
model assumes that all base–amino acid interactions
contribute independently. This assumption seems to
hold well for Cro and the k repressor, which bind to
DNA through two helix-turn-helix motifs in a homo-
dimer. The predicted changes in binding free energy
agree quite well with the observed changes for various
multiple mutants and operator sequences [11,12]. In
the case of Mnt, which is a member of the ribbon-
helix-helix family and binds to DNA as a tetramer,
and EGR1, a member of the Cys
2
His
2
zinc-finger fam-
ily, this assumption does not seem to hold [21–24].
Some transcription factors form protein–protein con-
tacts to stabilize DNA binding. Cooperative interac-
tions mediated by these protein–protein contacts are
required for high levels of binding affinity and specific-
ity for many DNA-binding proteins [25]. For example,
although MATa1 and MATa2, homeodomain proteins
of Saccharomyces cerevisiae, bind to DNA with mod-
est affinity and specificity for DNA, the a1⁄ a2 hetero-
dimer binds DNA with higher affinity and specificity
[26,27]. Such cooperative binding might explain the
difference between the observed and predicted values.
In the E. coli CRP–DNA complex structure, the CRP
dimer binds to twofold-symmetrical DNA sequences
symmetrically [19]. Although little is known about the
cooperativity by which the SYCRP1 dimer binds to
DNA, two models for DNA binding may be considered
for binding of SYCRP1. The simplest model involves
symmetrical and cooperative binding of SYCRP1 dimer
to DNA. In this case, the total change in binding free
energy (DDG
A
total
) is calculated by adding the change in
binding free energy (DDG) for the two half sites.
Predicted values are larger than observed ones.
Fig. 5. Histogram of the DDG
A
total
values for binding of SYCRP1 to
the entire genome of Synechocystis based on the calculation of
changes in binding free energy for SYCRP1 for every site in the
entire Synechocystis genome. The binding is stronger when
DDG
A
total
values are lower.
Fig. 4. Example of DDG
A
total
calculation. DDG
A
total
values around the
slr1667–slr1668 operon regulated by SYCRP1 are shown. The posi-
tions of slr1667 and slr1668 are shown at the top; the arrows rep-
resent the actual binding site of the slr1667–slr1668 operon. The
binding site upstream of the operon has the lowest DDG
A
total
value
of those calculated.
DG-based prediction of DNA binding sites by SYCRP1 K. Omagari et al.
4790 FEBS Journal 275 (2008) 4786–4795 ª 2008 The Authors Journal compilation ª 2008 FEBS
The other model, in contrast with the above sym-
metrical and cooperative binding model, is the inde-
pendent binding model, whereby either half site adopts
a specific or non-specific binding mode independently
while binding to DNA. In the non-specific binding
mode, the protein binds to DNA but does not
Table 1. Putative binding sites of SYCRP1 and the downstream genes. The standard errors were calculated from standard errors of DDG.
No.
a
Locus
b
Product
b
Position
c
Sequence
d
DDG
A
total
±SE
e
1 sll1520 DNA repair protein (RecN) )568.5 TGTGATCC|AGATCACA 0.0 ± 0.0
slr0442 Unknown protein )194.5
2 sll1268 Unknown protein )153.5 TGTGATCT|AGATCACA 0.0 ± 0.0
3 sll1543 Unknown protein )268.5 TGTGATCT|GGGTCACA 0.3 ± 0.1
slr1667 Unknown protein )251.5
4 sll1247 Unknown protein )158.5 GGTGATCT|AGATCACA 0.7 ± 0.2
slr1351 UDP-N-acetylmuramoylalanyl-
D-glutamyl-
2,6-diamino-pimelate-
D-alanyl-D-alanine ligase (murF)
)92.5
5 sll1577 Phycocyanin b subunit (cpcB) )709.5 TGTGATCT|AAATCACC 1.1 ± 0.2
ssr2848 Unknown protein )93.5
6 slr0992 Hypothetical protein )75.5 TGTGATCT|CCGTCACC 1.6 ± 0.3
7 slr1732 Unknown protein )323.5 GGTGATTC|TAATCACA 2.0 ± 0.2
8 sll1874 Phytochrome-regulated gene (AT103) )394.5 TGTGATTA|TTCTCACA 2.6 ± 0.1
9 sll0702 Unknown protein )207.5 TGTGATGA|CCGTCATA 2.8 ± 0.4
slr0733 Integrase–recombinase protein (xerC) )548.5
10 slr1928 Unknown protein )47.5 TGTGTCCT|GGGTCACT 3.0 ± 0.3
11 sll1708 NarL subfamily )68.5 GGTGATTA|CTATCACG 3.1 ± 0.4
slr1805 Sensory transduction histidine kinase )100.5
12 ssl3335 Secretory protein (SecE) )282.5 GGTGTTGG|AGATCACA 3.1 ± 0.3
13 sll1608 Unknown protein )179.5 AGTGATGT|TTATCATT 3.1 ± 0.4
slr1717 Hypothetical protein )705.5
14 sll1268 Unknown protein )176.5 GGTGACCC|AGACCACT 3.2 ± 0.3
15 ssr2333 Unknown protein ) 91.5 AGTGATTA|TACTCACA 3.3 ± 0.4
16 slr1908 Hypothetical protein )322.5 AATGCTCC|GGGTCACT 3.6 ± 0.4
17 slr1334 Hypothetical protein )83.5 TGTAATTC|TGAGCACA 3.7 ± 0.4
18 slr0869 Unknown protein )201.5 TGTGACTA|CAACCACA 3.7 ± 0.3
19 sll1564 a -Isopropylmalate synthase (leuA) )215.5 TGTGATTG|AGACCATA 3.7 ± 0.3
ssr2802 ABC transporter )142.5
20 sll0533 Trigger factor (tig) )353.5 AATGCCCT|GCGTCACA 3.8 ± 0.4
slr0549 Aspartate
b-semialdehyde dehydrogenese (asd) )312.5
21 slr0964 Hypothetical protein )95.5 AGTGCTCC|GGAACACT 3.8 ± 0.5
22 ssl0438 50S ribosomal protein L12 homologue )40.5 TGTGCTAT|TGCTCACG 3.8 ± 0.3
23 slr0054 Diacylglycerol kinase (dgkA) )51.5 TGTAATCC|AGGTTACA 3.8 ± 0.4
a
The numbers of the putative binding sites correspond with the numbers shown in Fig. 7.
b
The genes downstream of putative
binding sites. Protein-coding genes of the Entrenz genome database ( />NC_000911.ptt) were used for the search.
c
Position of the center of the putative binding sites relative to the ORF start position.
d
Sequences of putative binding sites.
e
Changes in binding free energy and standard errors (DDG
A
total
Æ SE).
Fig. 6. Confirmation of SYCRP1 binding to predicted sites using EMSA. We confirmed whether SYCRP1 can bind to 11 putative binding
sites selected from 23 sites in ascending order of DDG
A
total
values. The gel images are typical examples. The DDG
A
total
values for these exam-
ples become larger from left to right. For lanes 1–4, the final SYCRP1 concentrations are 1, 10, 100 and 1000 n
M, respectively.
K. Omagari et al. DG-based prediction of DNA binding sites by SYCRP1
FEBS Journal 275 (2008) 4786–4795 ª 2008 The Authors Journal compilation ª 2008 FEBS 4791
recognize the sequence. In this case, simply adding the
DDG values for the two half sites is not appropriate,
and the following formula is used:
DDG
B
total
¼ÀkT lnðexpðÀDDG
l
=
kTÞþexpðÀDDG
r
=
kTÞÞ
ð1Þ
where DDG
l
is calculated by summing the DDG values
from the left half sites and spacer, and DDG
r
is calcu-
lated by summing the DDG values from the right half
sites and spacer. If the DDG sum for one site becomes
too large, its contribution to DDG
B
total
becomes less
important. The correlation coefficient between the cal-
culated DDG
B
total
and observed DDG
total
values is 0.87
(Fig. 8). This value is better than that for the coopera-
tive symmetrical binding. However, the predicted val-
ues for three sites with high binding free energy did
not agree with the observed DDG
total
values. In actual
binding, the situation may be somewhere between
these two extreme cases, i.e. the binding between
SYCRP1 and DNA may take place with intermediate
cooperativity between the monomers. The degree of
cooperativity may also depend on the sequence of
DNA [28] to which SYCRP1 binds. In addition, the
validity of the assumption of additivity in calculating
DDG (even in each half site) should also be examined
in the case of SYCRP1, for example by conducting
systematic double base-pair mutation analysis, to yield
a higher level of prediction accuracy. Further investi-
gations are necessary to disclose the mechanism of
cooperativity in SYCRP1–DNA binding.
Putative binding sites and target genes for
SYCRP1
Using the DDG values derived from systematic single
base-pair experiments, we predicted binding sites for
SYCRP1 in the Synechocystis genome. Of the calcu-
lated sites, those with DDG
A
total
< 3.9 kcalÆmol
)1
located
upstream of ORFs were selected as putative binding
sites. We obtained 23 putative binding sites, including
the known slr1667–slr1668 operon binding site. We
confirmed that SYCRP1 binds to ten of the 11 puta-
tive binding sites. The upstream region of slr0442,
whose expression level decreases in the sycrp1 disrup-
tant [2], was found to have a binding site for SYCRP1.
Fig. 7. Correlation between predicted and observed changes in
binding free energy. DDG
A
total
values were calculated based on the
assumption of additivity and the cooperative binding model,
whereby changes in the binding free energy due to single base-pair
substitutions are summed assuming that a symmetrical dimer of
SYCRP1 binds to two half sites in a twofold-symmetrical manner.
The broken line is a 45° straight line. The numbers correspond to
the sequences in Table 1. Values for number 9 (slr0733 and
sll0702) are not shown because its DDG value was larger than
3.9 kcalÆmol
)1
. Error bars are the standard errors calculated from
three independent experiments.
Fig. 8. Correlation between predicted and observed changes in
binding free energy using the independent binding model. DDG
B
total
values were calculated based on the independent binding model,
whereby independent binding free energies of monomers of SYC-
RP1 to each half site were calculated using Eqn (1). The energy is
offset by –kTln2 so that DDG
B
total
is zero when DDG
l
and DDG
r
are
zero. The broken line is a 45° straight line. The numbers correspond
to the sequences in Table 1. Values for number 9 (slr0733 and
sll0702) are not shown because its DDG value was larger than
3.9 kcalÆmol
)1
. Error bars are the standard errors calculated from
three independent experiments.
DG-based prediction of DNA binding sites by SYCRP1 K. Omagari et al.
4792 FEBS Journal 275 (2008) 4786–4795 ª 2008 The Authors Journal compilation ª 2008 FEBS
Based on the functional annotation, some genes down-
stream of the putative binding sites are involved in
photoresponsibility (e.g. sll1577 and sll1874). Syne-
chocysis responds to blue light and this increases the
concentration of cAMP in the cell. Therefore, SYC-
RP1 might regulate these genes in response to light.
In vivo experiments are necessary in order to confirm
whether or not those predicted binding sites are actu-
ally control regions for SYCRP1. The present results
suggest that DDG values derived from systematic single
base-pair experiments can be used to screen potential
binding sites and target genes on which regulatory
proteins act independently at the genome level.
Experimental procedures
Preparation of SYCRP1
SYCRP1 used in this study was prepared by the method estab-
lished by Yoshimura et al. [1]. The purified SYCRP1 was sus-
pended in 50 mm Tris ⁄ HCl (pH 8.0), 200 mm NaCl and 50%
glycerol, and stored at –80 °C. The concentration of SYCRP1
was measured using a Protein Assay Kit II (Bio-Rad, Hercu-
les, CA, USA), and additional confirmation was obtained
using the method described by Gill and von Hippel [29].
Systematic single base-pair substitution
experiments and confirmation of binding
In order to obtain complete DDG values for positions 4–11
for use in prediction of potential binding sites, we measured
the DDG values for positions 9–11 by conducting systematic
single base-pair substitution experiments based on EMSA.
Ten 40 bp DNA double strands with a single protruding
base G at the 5¢ ends were prepared (Fig. 1A). The wild-
type sequence used for the reference DDG value was the
ICAP sequence that contains the consensus DNA sequence
of E. coli CRP (5¢-CAACGCAATAAATGTGA
TCTA
GATCACATTTTAGGCACCC-3¢). The remaining nine
sequences were prepared by systematically substituting the
bases that are underlined in the ICAP sequence. All DNA
strands were commercially synthesized (Operon, Itabashi,
Tokyo, Japan) and purified by HPLC.
Binding reactions and electrophoresis were performed
according to the method previously reported [16]. Briefly, a
DNA double strand labeled with [c-
32
P]ATP (Amersham,
Piscataway, NJ, USA) at the 5¢ ends was incubated with a
gradient concentration of SYCRP1 in a total volume of
30 lL of binding buffer (50 mm Tris ⁄ HCl pH 7.5, 60 mm
NaCl, 1 mm EDTA, 8.3% w ⁄ v glycerol, 0.1 mgÆmL
)1
BSA)
with a final concentration of 20 lm cAMP for 30 min at
room temperature. The DNA concentration was set at a
concentration 10- to 1000-fold lower than the K
d
value.
The concentrations of SYCRP1 ranged from 10-fold lower
to 10-fold higher than the K
d
value. The final concentration
of SYCRP1 was less than approximately 1000 nm. Samples
were quickly loaded onto 10% polyacrylamide gels (acryl-
amide:N,N9-methylenebisacrylamide, 50 : 1). Electrophore-
sis was performed at a constant voltage (400 V) for
30–45 min in 0.25 · Tris-borate ⁄ EDTA (TBE) with 20 lm
cAMP. After electrophoresis, the gels were dried and auto-
radiographed using Fujix BAS2500 (Fuji Film, Minato,
Tokyo, Japan). From the intensities of the SYCRP1–DNA
complex bands and the free DNA bands, the dissociation
constant K
d
and the DDG value were calculated as
described by Omagari et al. [16].
Search for potential binding sites for SYCRP1
To search for the potential binding sites for SYCRP1 in the
genome, the total change in binding free energy (DDG
A
total
)
for a given segment of the genome sequence was calculated
using a mutation matrix as described previously [10].
Figure 3 shows the procedure for this calculation. First, a
16 bp sequence segment was extracted from the +1 posi-
tion in the genome sequence. The sequence was compared
with the 16 bp consensus sequence of the binding site, and
then the DDG values for base-pair substitutions were deter-
mined by referring to the mutation matrix for SYCRP1.
The total change in binding free energy (DDG
A
total
) was cal-
culated by summing the DDG values at positions 4–19. As
the DDG
A
total
value increases, the binding becomes weaker.
Next, the position of the 16 bp segment window was shifted
by 1 bp at a time, and the same calculations were repeated
for the whole genome sequence to investigate the distribu-
tion of potential specific binding sites for SYCRP1. Those
sites with DDG
A
total
< 3.9 kcalÆmol
)1
were selected as poten-
tial binding sites. Those sites with DDG
A
total
> 3.9 kcalÆ
mol
)1
were considered as non-specific binding sites for
SYCRP1, because complex bands could not be obtained
clearly. Finally, the potential binding sites upstream of or
between ORFs were selected as putative binding sites for
SYCRP1 in transcriptional regulation.
Confirmation of binding
SYCRP1 binding to the putative binding sites was experi-
mentally confirmed using EMSA. The confirmation was
carried out for the putative binding sites with the 11 lowest
DDG
A
total
values (Fig. 1B). Eleven DNA double strands of
40 bp with a single protruding base at the 5¢ end labeled
with [c-
32
P]ATP were prepared by annealing DNA single
strands that had been commercially synthesized (Operon)
and purified by HPLC. The double strands have the
selected 16 bp putative binding sites in the center. The dis-
sociation constant K
d
and the total change in binding free
energy (DDG
A
total
) for these double strands were measured as
previously described [12,16].
K. Omagari et al. DG-based prediction of DNA binding sites by SYCRP1
FEBS Journal 275 (2008) 4786–4795 ª 2008 The Authors Journal compilation ª 2008 FEBS 4793
Acknowledgements
We thank Professor A. Suyama for assistance and dis-
cussion. This work was supported in part by a grant-in-
aid from the 21st century Center of Excellence program
(Research Center for Integrated Science) of the
Ministry of Education, Culture, Sports, Science, and
Technology, Japan.
References
1 Yoshimura H, Hisabori T, Yanagisawa S & Ohmori M
(2000) Identification and characterization of a novel
cAMP receptor protein in the cyanobacterium
Synechocystis sp. PCC 6803. J Biol Chem 275, 6241–
6245.
2 Yoshimura H, Yanagisawa S, Kanehisa M & Ohmori
M (2002) Screening for the target gene of cyanobacteri-
al cAMP receptor protein SYCRP1. Mol Microbiol
43, 843–853.
3 Yoshimura H, Yanagisawa S, Kanehisa M & Ohmori
M (2002) A cAMP receptor protein, SYCRP1, is
responsible for the cell motility of Synechocystis sp.
PCC 6803. Plant Cell Physiol 43, 460–463.
4 Ohmori M & Okamoto S (2004) Photoresponsive
cAMP signal transduction in cyanobacteria. Photochem,
Photobiol Sci 3, 503–511.
5 Terauchi K & Ohmori M (2004) Blue light stimulates
cyanobacterial motility via a cAMP signal transduction
system. Mol Microbiol 52, 303–309.
6 Sarai A & Kono H. (2003) DNA-Protein Interactions:
Target predictions. In Handbook of Computational
Biology (Crabbe MJC & Konopka AK, eds) pp. 241–
278. Marcel Dekker Inc., New York.
7 Stormo GD & Fields DS (1998) Specificity, free energy
and information content in protein–DNA interactions.
Trends Biochem Sci 23 , 109–113.
8 Frech K, Quandt K & Werner T (1997) Finding pro-
tein-binding sites in DNA sequences: the next genera-
tion. Trends Biochem Sci 22, 103–104.
9 Kono H & Sarai A (1999) Structure-based prediction of
DNA target sites by regulatory proteins. Proteins 35,
114–131.
10 Deng QL, Ishii S & Sarai A (1996) Binding site analysis
of c-Myb: screening of potential binding sites by using
the mutation matrix derived from systematic binding
affinity measurements. Nucleic Acids Res 24, 766–774.
11 Takeda Y, Sarai A & Rivera VM (1989) Analysis of the
sequence-specific interactions between Cro repressor
and operator DNA by systematic base substitution
experiments. Proc Natl Acad Sci USA 86, 439–443.
12 Sarai A & Takeda Y (1989) Lambda repressor recog-
nizes the approximately 2-fold symmetric half-operator
sequences asymmetrically. Proc Natl Acad Sci USA 86,
6513–6517.
13 Tanikawa J, Yasukawa T, Enari M, Ogata K, Nishim-
ura Y, Ishii S & Sarai A (1993) Recognition of specific
DNA sequences by the c-myb protooncogene product:
role of three repeat units in the DNA-binding domain.
Proc Natl Acad Sci USA 90, 9320–9324.
14 Hao D, Yamasaki K, Sarai A & Ohme-Takagi M
(2002) Determinants in the sequence specific binding
of two plant transcription factors, CBF1 and NtERF2,
to the DRE and GCC motifs. Biochemistry 41, 4202–
4208.
15 Gunasekera A, Ebright YW & Ebright RH (1992)
DNA sequence determinants for binding of the Escheri-
chia coli catabolite gene activator protein. J Biol Chem
267, 14713–14720.
16 Omagari K, Yoshimura H, Takano M, Hao D, Ohmori
M, Sarai A & Suyama A (2004) Systematic single base-
pair substitution analysis of DNA binding by the cAMP
receptor protein in cyanobacterium Synechocystis sp.
PCC 6803. FEBS Lett 563, 55–58.
17 Cameron AD & Redfield RJ (2006) Non-canonical
CRP sites control competence regulons in Escherichia
coli and many other gamma-proteobacteria. Nucleic
Acids Res 34, 6001–6014.
18 Pyles EA, Chin AJ & Lee JC (1998) Escherichia coli
cAMP receptor protein–DNA complexes. 1. Energetic
contributions of half-sites and flanking sequences in
DNA recognition. Biochemistry 37, 5194–5200.
19 Parkinson G, Wilson C, Gunasekera A, Ebright YW,
Ebright RE & Berman HM (1996) Structure of the
CAP-DNA complex at 2.5 angstroms resolution: a com-
plete picture of the protein–DNA interface. J Mol Biol
260, 395–408.
20 Shanblatt SH & Revzin A (1986) The binding of catab-
olite activator protein and RNA polymerase to the Esc-
herichia coli galactose and lactose promoters probed by
alkylation interference studies. J Biol Chem 261, 10885–
10890.
21 Man TK & Stormo GD (2001) Non-independence of
Mnt repressor–operator interaction determined by a
new quantitative multiple fluorescence relative affinity
(QuMFRA) assay. Nucleic Acids Res 29, 2471–2478.
22 Bulyk ML, Johnson PL & Church GM (2002) Nucleo-
tides of transcription factor binding sites exert interde-
pendent effects on the binding affinities of transcription
factors. Nucleic Acids Res 30, 1255–1261.
23 Benos PV, Bulyk ML & Stormo GD (2002) Additivity
in protein–DNA interactions: how good an approxima-
tion is it? Nucleic Acids Res 30, 4442–4451.
24 Benos PV, Lapedes AS & Stormo GD (2002) Is there a
code for protein–DNA recognition? Probab(ilistical)ly
Bioessays 24, 466–475.
25 Berggrun A & Sauer RT (2001) Contributions of dis-
tinct quaternary contacts to cooperative operator bind-
ing by Mnt repressor. Proc Natl Acad Sci USA 98,
2301–2305.
DG-based prediction of DNA binding sites by SYCRP1 K. Omagari et al.
4794 FEBS Journal 275 (2008) 4786–4795 ª 2008 The Authors Journal compilation ª 2008 FEBS
26 Jin Y, Mead J, Li T, Wolberger C & Vershon AK
(1995) Altered DNA recognition and bending by inser-
tions in the alpha 2 tail of the yeast a1 ⁄ alpha 2 home-
odomain heterodimer. Science 270, 290–293.
27 Li T, Stark MR, Johnson AD & Wolberger C (1995)
Crystal structure of the MATa1 ⁄ MAT alpha 2 homeod-
omain heterodimer bound to DNA. Science 270, 262–
269.
28 Gromiha MM, Siebers JG, Selvaraj S, Kono H & Sarai
A (2004) Intermolecular and intramolecular readout
mechanisms in protein–DNA recognition. J Mol Biol
337, 285–294.
29 Gill SC & von Hippel PH (1989), Calculation of protein
extinction coefficients from amino acid sequence data.
Anal Biochem 182, 319–326 (erratum appears in Anal
Biochem 189, 283).
K. Omagari et al. DG-based prediction of DNA binding sites by SYCRP1
FEBS Journal 275 (2008) 4786–4795 ª 2008 The Authors Journal compilation ª 2008 FEBS 4795