Báo cáo khoa học: Distinctive activities of DNA polymerases during human DNA replication ppt
Bạn đang xem bản rút gọn của tài liệu. Xem và tải ngay bản đầy đủ của tài liệu tại đây (629.7 KB, 18 trang )
Distinctive activities of DNA polymerases during human
DNA replication
Anna K. Rytko
¨
nen
1,2
, Markku Vaara
2
, Tamar Nethanel
3
, Gabriel Kaufmann
3
, Raija Sormunen
4
,
Esa La
¨
a
¨
ra
¨
5
, Heinz-Peter Nasheuer
6
, Amal Rahmeh
7
, Marietta Y. W. T. Lee
7
, Juhani E. Syva
¨
oja
2
and Helmut Pospiech
1
1 Biocenter Oulu and Department of Biochemistry, University of Oulu, Finland
2 Department of Biology, University of Joensuu, Finland
3 Department of Biochemistry, Tel Aviv University, Israel
4 Biocenter Oulu and Department of Pathology, University of Oulu, Finland
5 Department of Mathematical Sciences, University of Oulu, Finland
6 National University of Ireland, Department of Biochemistry, Cell Cycle Control Laboratory, Galway, Ireland
7 Department of Biochemistry and Molecular Biology, New York Medical College, Valhalla, NY, USA
DNA polymerases (pols) have a central role in DNA
replication and maintenance of chromosomal DNA
[1]. At least 14 pols have been identified in the mam-
malian cell, but only three – pols a, d and e – are
needed to synthesize the bulk of DNA during nuclear
DNA replication. These pols are structurally related,
belonging to the family B DNA polymerases [2].
Nonetheless, all three perform additional roles in other
DNA transactions as well as transduce signals of cell
cycle control and DNA damage response [1].
Only pol a is capable of initiating DNA synthesis
de novo owing to its associated primase activity [3].
The major function of pol a ⁄ primase is synthesizing a
short RNA–DNA primer of 30–40 nucleotides that
serves both to initiate leading strand DNA replication
and to provide precursors of the 200 nucleotide-long
Okazaki fragments on the lagging strand [4–6]. Pol
a ⁄ primase is then replaced by the elongating pols d or
e. This switch from pol a to pol d is controlled by rep-
lication factor C, which loads the processivity factor,
Keywords
cell cycle; DNA polymerase; DNA
replication; electron microscopy; UV cross-
linking
Correspondence
H. Pospiech, Department of Biochemistry,
PO Box 3000, FIN-90014 University of Oulu,
Finland
Fax: +358 8 553 1141
Tel: +358 8 553 1155
E-mail: helmut.pospiech@oulu.fi
(Received 20 March 2006, revised 3 May
2006, accepted 5 May 2006)
doi:10.1111/j.1742-4658.2006.05310.x
The contributions of human DNA polymerases (pols) a, d and e during
S-phase progression were studied in order to elaborate how these enzymes
co-ordinate their functions during nuclear DNA replication. Pol d was
three to four times more intensely UV cross-linked to nascent DNA in late
compared with early S phase, whereas the cross-linking of pols a and e
remained nearly constant throughout the S phase. Consistently, the chro-
matin-bound fraction of pol d, unlike pols a and e, increased in the late
S phase. Moreover, pol d neutralizing antibodies inhibited replicative DNA
synthesis most efficiently in late S-phase nuclei, whereas antibodies against
pol e were most potent in early S phase. Ultrastructural localization of the
pols by immuno-electron microscopy revealed pol e to localize predomin-
antly to ring-shaped clusters at electron-dense regions of the nucleus,
whereas pol d was mainly dispersed on fibrous structures. Pol a and prolif-
erating cell nuclear antigen displayed partial colocalization with pol d and
e, despite the very limited colocalization of the latter two pols. These data
are consistent with models where pols d and e pursue their functions at
least partly independently during DNA replication.
Abbreviations
BrdU, bromodeoxyuridine; CLSM, confocal laser-scanning microscopy; EM, electron microscopy; immuno-EM, immuno electron microscopy;
MCM2, minichromosome maintenance 2; NP-40, Nonidet P-40; PCNA, proliferating cell nuclear antigen; pol, DNA polymerase.
2984 FEBS Journal 273 (2006) 2984–3001 ª 2006 The Authors Journal compilation ª 2006 FEBS
proliferating cell nuclear antigen (PCNA), onto the 3¢
end of the RNA–DNA primer [7].
Simian virus 40 (SV40) has provided the predomin-
ant mammalian model system for DNA replication in
the last three decades. In SV40 replication, the host
cell provides all the replication factors, except for the
viral large T antigen, which acts as the initiator protein
and replicative helicase [8]. Interestingly, only pols a
and d are required for the virus to replicate, whereas
pol e seems dispensable [9–11]. In contrast, studies in
yeasts and in animal systems indicate that both pols d
and e are required for nuclear DNA replication [1,12].
Although pol e is essential for viability both in the
budding yeast, Saccharomyces cerevisiae [13,14], and
the fission yeast Schizosaccharomyces pombe [15,16], it
is the C-terminal checkpoint domain [17], rather than
the N-proximal catalytic pol domain, that executes the
essential function [18–20]. Nevertheless, the catalytic
activity of pol e seems to partake in DNA replication
in a number of eukaryotic models [9,11,20–22].
Several hypotheses have been proposed to account
for the requirement of both pols d and e in nuclear
DNA replication. Most models placed the two pols on
opposite arms of the replication fork [12]. This view is
supported by genetic studies that demonstrate a strand
bias in replication fidelity of proofreading-deficient
pols d and e yeast mutants [23,24]. A bias for replica-
tion errors on the leading and lagging strands also
appears to be established by origins of replication [25].
However, pols d and e still await specific assignment to
the leading or the lagging strand by this method.
Moreover, the contributions of DNA checkpoint con-
trol and DNA repair processes on strand-specific error
bias also need to be established in more detail [26,27].
Other models have allocated a role for pol e during
specific stages of DNA replication. Mostly, they impli-
cate pol e in the initiation of replication [28–31]. On
the other hand, a role in late DNA replication has
been proposed for human pol e, based on confocal
laser-scanning microscopy (CLSM) [32].
In the present study we addressed the specific contri-
butions of pols a, d and e to nuclear replication by fol-
lowing their behaviour during S-phase progression,
using four different methods, namely (a) studying their
cross-linking to newly synthesized DNA, (b) determin-
ing their association with chromatin, (c) following the
effect of cognate inhibitory antibodies on DNA repli-
cation in isolated nuclei and (d) localizing the pols
by immuno-electron microscopy (immuno-EM). The
results suggest that pol a is continuously involved in
replication throughout the S phase, pol e is more act-
ive in early S phase and pol d is active during the later
stages. Moreover, pol e colocalized with pol a in
ring-shaped clusters within electron-dense regions of
the nucleus, whereas pol d was mainly dispersed in
fibrous structures. Taken together, these data are con-
sistent with models where pols d and e pursue their
functions independently during DNA replication.
Results
The cross-linking efficiencies of the three
replicases to nascent DNA change during
S-phase progression
To evaluate the specific contributions of pols a, d and
e to DNA replication, we studied their association with
nascent DNA as a function of S-phase progression.
HeLa cells were synchronized with mimosine, which
blocks cells at the G1 ⁄ S border prior to initiation of
replication [33,34]. Two hours after release from the
block, cells have entered S phase, and after 14 h they
were found to have entered the G2 ⁄ M phase of the cell
cycle (Fig. 1A). We utilized the DNA polymerase trap
technique to tag the pols with their DNA products
[11,35]. Nascent nuclear DNA was briefly pulse-
labelled with bromodeoxyuridine (BrdU) UTP and
[
32
P]dATP[aP] in a monolayer of nuclei isolated from
synchronized cells. Subsequent digestion with DNase
left the pols photolabelled with a residual radioactive
DNA adduct. The photolabelled proteins were then
separated from the bulk DNA and the pols were
immunoprecipitated with an excess of specific anti-
bodies. Analysis of precipitated protein and superna-
tant indicated that the immunoprecipitation efficiency
remained constant at different time points (data not
shown). After resolution on SDS ⁄ PAGE and transfer
to poly(vinylidene difluoride) membrane, the specific
photolabelled products could be related to the corres-
ponding immunoblotting signals (Fig. 1B). Although
this method did not reveal the absolute level of the
pols engaged in DNA synthesis, it allowed evaluation
of the relative changes in their level as a function of
S-phase progression.
If pols a, d and e function co-ordinately in a com-
mon replication fork, one would expect similar chan-
ges in their photolabelling intensity during S-phase
progression. However, as indicated by the results
shown in Fig. 1B,C, pols a, d and e consistently dem-
onstrated different behaviours during the S phase. The
photolabelling intensity of pol a (Fig. 1C, upper panel)
increased only slightly during the later stages of the
S phase. Statistical modelling indicated that the photo-
labelling of pol a could be fitted well into a linear
model. The increase of relative photolabelling for
pol a, expressed as a linear trend coefficient of the log
A. K. Rytko
¨
nen et al. Human DNA polymerases a, d and e in replication
FEBS Journal 273 (2006) 2984–3001 ª 2006 The Authors Journal compilation ª 2006 FEBS 2985
over the whole time range, was 0.025Æh
)1
(SE ¼ 0.018),
implying a 1.3-fold increase in relative photolabelling
over the time range.
Pol e behaved similarly to pol a, the estimated slope
being 0.046Æh
)1
(SE ¼ 0.018). However, the increase
was not monotonic; a plateau was observed at mid S
phase 8 h after release from mimosine block (Fig. 1C,
bottom panel). In contrast, pol d showed a continuous
rise in relative photolabelling throughout the S phase
(Fig. 1B,C). The estimated slope was 0.113Æ h
)1
(SE ¼
0.018). This corresponds to a three- to fourfold
increase from immediate early to late S phase and
was clearly higher than the fluctuation of 1.5-fold
observed for pols a and e (P ¼ 0.0036 for this compar-
ison, see supplementary Doc. S1 for a more detailed
description of the statistical analysis).
Chromatin association of the replicases during
S phase
The increase in relative photolabelling of pol d could
be attributed to an increase in cross-linking to nascent
A
C
B
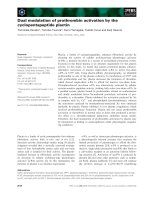
Fig. 1. Photolabelling of DNA polymerases (pols) a, d and e during the S phase. The activity of the pols during the S phase was studied by
using a UV cross-linking technique. HeLa cells were synchronized with mimosine, which blocks cells at the G1 ⁄ S border, then released from
the block for 2 h (very early S phase), 5 h (early S phase), 8 h (middle S phase) or 12 h (late S phase) and photolabelled. Pols a, d and e, and
their photolabelled derivatives, were monitored as described in the Experimental procedures. (A) Cell synchronization. Flow cytometric analy-
sis indicates the DNA content of HeLa cells throughout the time course of a typical mimosine synchronization. (B) Autoradiogram and west-
ern blot analysis of a representative experiment. (C) Photolabelling efficiency (autoradiography) and immunoreactive protein (western blot
analysis) were densitometrically quantified and the ratios of these values were normalized against the average of the respective experiment.
The results of five independent experiments on pols a, d and e, respectively, are presented with different marks. The average for each pol is
shown as a bold line.
Human DNA polymerases a, d and e in replication A. K. Rytko
¨
nen et al.
2986 FEBS Journal 273 (2006) 2984–3001 ª 2006 The Authors Journal compilation ª 2006 FEBS
DNA in late S phase or to a decrease in the protein
level associated with chromatin, because the calculated
cross-linking intensities represent the ratio of these
qualities. Inspection of our DNA polymerase trap
experiments indicated an increase of the immunoreac-
tive pol d protein level during S phase (Fig. 1B, lower
panel). We therefore determined the association of pols
a, d and e directly with chromatin. We utilized a sim-
ple high-salt extraction scheme that permitted compar-
ison with the results from the concurrent polymerase
trap experiments.
HeLa cells were synchronized with mimosine at the
G1 ⁄ S boundary. After release from the block, cells at
defined stages of the S phase were lysed in hypotonic
buffer in the presence of Nonidet P-40 (NP-40) deter-
gent to release detergent-soluble protein, including
nucleosolic proteins (soluble fraction). The second
fraction contained proteins released by high-salt
extraction from the remaining monolayer of open nuc-
lei and included the chromatin-associated proteins
(‘bound’). The remaining material was solubilized in
SDS (rest fraction). The quality of the fractionation
was monitored by western blot analysis of marker pro-
teins (Fig. 2A) from asynchronous cells. Markers for
the soluble fraction included the Golgi marker
GM130, the endoplasmic reticulum-specific marker
protein disulfide isomerase (PDI) and b-tubulin. These
proteins were found exclusively in the soluble fraction,
indicating that the high-salt and rest fractions are
largely free of soluble contaminants. The chromatin
marker, minichromosome maintenance deficient-2
(MCM2), was distributed between the soluble and the
bound fraction, as expected [36]. A similar distribution
was found for PCNA (Fig. 2A). Lamins A ⁄ C were
AB C
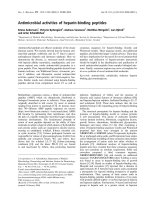
Fig. 2. Association of DNA polymerases (pols) to chromatin during the S phase. Proteins were synchronized with mimosine and fractionated
to result in a Nonidet P-40 soluble fraction, a high-salt (bound) fraction, and a remaining matrix fraction (rest), as outlined in the Experimental
procedures. (A) Western blot analysis of marker proteins in a cell fractionation from asynchronous cells. Extracts representing an equal num-
ber of cells were loaded from each fraction. The pan-histone antibody recognized multiple bands, corresponding to core and linker histones,
as indicated by dots. (B) Levels of bound pols a, d and e during the S phase, as determined by western blot analysis. SYPRO orange staining
was used to monitor and normalize loading of the gel. Lane A is an asynchronous control. (C) Densitometric quantification of the bound pro-
tein levels. The results represent the average of two independent cell fractionations. Repetitions of the western blot analysis were averaged
for each fractionation and pol.
A. K. Rytko
¨
nen et al. Human DNA polymerases a, d and e in replication
FEBS Journal 273 (2006) 2984–3001 ª 2006 The Authors Journal compilation ª 2006 FEBS 2987
detected in the high-salt and rest fractions, but not in
the soluble fractions. Histones were identified mainly
in the high-salt fraction. In asynchronous cells, pols a,
d and e were distributed, to various extents, between
the soluble and the high-salt fractions (Fig. 2A). These
results indicate that the NP-40-resistant high-salt frac-
tion represents a good approximation for the chroma-
tin-bound pols.
We then followed the NP-40-resistant high-salt frac-
tion of the pols as a function of cell cycle progression.
Results from representative western blot analyses of
their high-salt fractions are presented in Fig. 2B. All
three pols were detected in these fractions. Notably,
pol e appeared as a double band after long runs in
low-percentage gels. These bands could be accounted
for by post-translational modification, proteolysis,
alternative splicing or alternative promoter usage [37].
The relative abundance of the two forms did not vary
during the S phase.
As can be seen from the densitometric quantification
of the experiments presented in Fig. 2C and their
statistical modelling, NP-40-resistant levels of pol e
appeared to be largely constant or slightly decreasing
(slope )0.014Æh
)1
;SE¼ 0.016, corresponding to a 1.3-
fold decrease during 17 h). In contrast, NP-40-resistant
pol a seems to have an increasing trend (slope
0.024Æh
)1
,SE¼ 0.012, corresponding to a 1.5-fold
increase). The pol d levels increased even more rapidly,
approximately twofold during the S phase (slope
0.043Æh
)1
,SE¼ 0.013). The changes detected in the
levels of the pols in the high-salt fraction are only
moderate during the S phase; however, the difference
between the replicative pols becomes apparent by
pairwise comparison of the time trend of chromatin
association. The difference between the slopes of
pol d and pol a was 0.019Æh
)1
(SE ¼ 0.018, P ¼ 0.3),
between pol d and pol e was 0.057Æh
)1
(SE ¼ 0.020,
P ¼ 0.005), and for pol e vs. pol a it was )0.038Æh
)1
(SE ¼ 0.020, P ¼ 0.05). The time trend deviated
from a linear pattern for pol e, but allowing for
curvature had no effect on the contrasts of its average
slope vs. those of pol a and d, respectively. Therefore,
the change in NP-40-resistant, high-salt-extractable
pol e appears to be different from those of pols a
and d.
Inhibitory effects of antibodies against the
replicases at different S-phase stages
We further evaluated the temporal differences between
the contributions of pols d and e to DNA replication
by studying the effects of cognate neutralizing antibod-
ies on the pol activities in nuclei isolated at different
stages of the S phase [38–40]. We have previously
shown that polyclonal antibody K18 against pol e
inhibits replication in isolated nuclei from asynchro-
nous HeLa cells to a level similar to that of the
well-characterized, neutralizing antibody, SJK-132-20,
against pol a [9,41] We extended this study by inclu-
ding antibody 78F5, which neutralizes specifically the
pol d activity [42] and by following the effect of the
antibodies against the three pols as a function of
S-phase progression. For this purpose, synchronized
HeLa monolayer cells were released from the mimosine
block, and the resultant G1 ⁄ S, early, middle and late
S-phase cells were studied in the DNA replication
assay.
Antibody SJK-132-20 against pol a inhibited consis-
tently 50% of the replicative DNA synthesis, irres-
pective of the S-phase stage (Fig. 3A, estimated slope
0.3%Æh
)1
,SE¼ 0.51%). In contrast, the inhibition of
replicative DNA synthesis by antibody 78F5 against
pol d increased almost threefold, from 17 to 48%, as
cells progressed from the G
1
⁄ S boundary to the late
S phase (Fig. 3A) (slope 2.6%Æh
)1
,SE¼ 0.70%). At
the same time, inhibition of DNA replication by anti-
body K18 against pol e dropped from 45 to 24%,
reaching a minimum 8 h after release from mimosine
block (slope )2.7%Æh
)1
,SE¼ 0.81% for the first 8 h).
The difference between pols d and e was striking. The
difference between the slopes of pol d and pol e was
3.7%Æh
)1
(SE ¼ 1.0%, P ¼ 0.0003), using a model with
separate linear and quadratic terms to allow for the
nonlinear behaviour of pol e in late S phase.
Mimosine, which has been utilized for cell synchron-
ization in this study, has been found to induce DNA
damage [43]. Therefore, we considered that the detec-
ted differences between pols a, d and e could be influ-
enced by checkpoint response, or may reflect DNA
repair, rather than differences in the contribution to
DNA replication. We therefore stimulated T98G cells
to proliferate after prolonged serum deprivation and
tested the effect of neutralizing antibodies on replica-
tion in nuclei from these cells. Nuclei were from T98G
cells, 12 h (early S phase) and 20 h (late S phase) after
serum stimulation (see Fig. S1 for flow cytrometric
analysis of a typical serum stimulation). Comparable
to replication in mimosine-synchronized HeLa nuclei,
DNA synthesis was found to be reduced by 60% by
the anti-pol a Ig, both in early and late S phases
(Fig. 3B). Inhibition by pol e antibodies dropped, in
general, from 60% in early, to 18% in late, S phase.
At the same time, inhibition by antibodies against
pol d showed a general increase, from 8 to 69%. These
results are comparable to the results obtained with
mimosine-synchronized HeLa cells. The contrast
Human DNA polymerases a, d and e in replication A. K. Rytko
¨
nen et al.
2988 FEBS Journal 273 (2006) 2984–3001 ª 2006 The Authors Journal compilation ª 2006 FEBS
between pols d and e are even more pronounced in
nuclei undergoing an unperturbed S phase than in nuc-
lei synchronized by mimosine. The differences observed
between pols d and e are therefore not provoked by
possible DNA damage caused by mimosine synchron-
ization.
The results presented above indicate that the
requirement of pol a activity remains constant
throughout the S phase. As the other replicative pols
depend on primer synthesis by pol a-primase, the
effect of the anti-pol a Ig could well represent the
cumulative inhibition of pol a and the subsequent
elongating enzyme. Pol e activity contributes to DNA
replication more at the G1 ⁄ S transition, and its relative
importance diminishes as the S phase progresses. On
the other hand, the requirement of pol d activity is
lowest in the early S phase and increases as the
S phase proceeds.
Pols d and e localize differently during the
S phase
Next, we studied the nuclear localization of pols a, d
and e as a function of S-phase progression. Human
IMR-90 primary fibroblasts were synchronized with
mimosine, after splitting from confluency, to achieve a
sharp entry into S phase (Fig. S2). Cells were then col-
lected at different time points to study the localization
pattern of the three pols and PCNA during the indica-
ted cell cycle stages by immuno-EM. We chose EM,
because this technique permits studying localization at
near molecular resolution, and localizations can be
related to nuclear structures after standard contrasting.
Moreover, there is no requirement for treatment with
detergent or other manipulations that remove part of
the protein from the nucleus. Ultrathin cryo-sectioning
was performed directly from extensively fixed cells.
AB
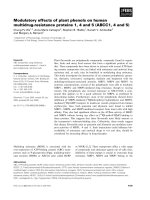
Fig. 3. Effect of inhibitory antibodies on
replicative DNA synthesis in isolated,
permeabilized nuclei during the S phase.
Replicative DNA synthesis using isolated
nuclei in the presence of excess cytoplas-
mic extract was measured as incorporation
of radioactive dCMP into newly synthesized
DNA. Levels of inhibition by specific anti-
bodies from independent replication reac-
tions are plotted for each DNA polymerase
(pol). The line represents the average for
each pol. (A) Inhibition of replication in
isolated HeLa cell nuclei synchronized with
mimosine. (B) Inhibition of replication in
serum-stimulated T98G cells. Results of ind-
ividual experiments for pols a, d and e are
plotted as triangles, filled circles and dia-
monds, respectively. Lines indicate the aver-
age inhibition by antibodies against the
cognate pols.
A. K. Rytko
¨
nen et al. Human DNA polymerases a, d and e in replication
FEBS Journal 273 (2006) 2984–3001 ª 2006 The Authors Journal compilation ª 2006 FEBS 2989
After selection of suitable antibodies and optimization
of the conditions, double staining was carried out with
two successive antibodies and protein A conjugated
with 5 and 10 nm gold particles, respectively.
As can be seen from the double stainings of pols a
and e, mouse mAb CL22-2-42B, against the catalytic
subunit of pol a, is well suited for immuno-gold label-
ling (Fig. 4, left panel) [44]. The same antibody has
been previously employed successfully for immuno-EM
of resin-embedded cells [45,46]. Similarly to the previ-
ous studies, pol a could be detected mainly at electron-
dense regions of the nucleus. Pol a labelling appears,
in part, as ring-shaped, focal structures alone, or it
colocalizes with pol e (Fig. 4, left panel, asterisks), or
as more disperse staining of discrete nuclear regions,
which is particularly visible at later stages of the S
phase (Fig. 4D,E). In earlier studies, the ring-shaped
foci of pol a were shown to coincide with sites of
DNA synthesis [45,46]. They were also shown to repre-
sent replication factories that appear as ovoid bodies
attached to the nucleoskeleton in thick sections [46–
48]. Although the foci are largest and most abundant
during G
1
⁄ S transition and early S phase, pol a
appears to be rather evenly distributed between ring-
shaped and dispersed structures. When enumerating
the gold particles from 17 pol a ⁄ e double staining ser-
ies from two independent synchronizations, we found
that 41% of pol a localized in foci (Table 1). The rel-
ative level of pol a in foci was rather constant until
late S phase⁄ G
2
transition, where the levels appeared
to decrease (data not shown). This is consistent with
the work of Lattanzi and coworkers [46], who reported
the ring-shaped pol a foci to disappear in the G
2
⁄ M
phase.
As evident from Fig. 4 (left panel), pol a colocalizes
at a near-molecular level with pol e stained with mAb
H3B [49]. mAb G1A [49], against pol e, gave a similar
localization pattern as mAb H3B, and both mAbs
colocalized in double stainings (data not shown), indi-
cating the specificity of the staining. The colocalization
of pol a and e is largely confined to the ring-shaped
foci. In fact, more than half of all detectable foci con-
tained both pol a and e (data not shown). This is not
surprising, because pol e staining is concentrated in
foci, 75% of pol e being focal in pol a ⁄ e double stai-
nings (Table 1). Similarly to pol a, pol e in foci
appears to be most pronounced from G
1
up to early
S phase (Fig. 4A–C, asterisks), but pol e levels in the
staining decreased relative to pol a as the S phase pro-
gressed (Fig. 5).
For detection of pol d, we utilized rat mAb PDK-
7B4 against p50, the B subunit of human pol d [50]
(Fig. 4, right panel, 5 nm gold particles). p50 has
previously been shown, by immunofluorescence micro-
scopy, to colocalize with the catalytic subunit [51].
From double stainings of pol d and e, it became
apparent that pol d mainly localizes outside the ring-
shaped foci, which are typical of pols a and e (Fig. 4,
right panel). In 17 pol d ⁄ e double staining series from
different S-phase stages, only 30% of pol d-directed
gold particles were found in the foci of three or more
particles, whereas 74% of pol e was focal in the
same series (Table 1). This difference persisted
throughout the cell cycle period studied from G
1
until
late S phase. Although some pol d-directed gold parti-
cles could be detected in foci, the abundance of pol d
in the foci was small compared with Pol e. Pol d stain-
ing was instead dispersed, but restricted to distinct ter-
ritories of the nucleus. It is notable that whereas some
areas of the nucleus showed strong staining, neigh-
bouring regions remained largely free of pol d
(Fig. 4I,K). Pol d directed gold particles located in the
vicinity of fibrous structures and often adopted a
‘beads-on-a-string’ structure (Fig. 4I,K, arrowheads).
The overall staining intensity of pol d relative to pol e
increased as the S phase progressed, and peaked in
mid ⁄ late S phase 8–12 h after release from mimosine
block. This was accompanied by a sharp drop, of
32%, in the fraction of the pol e-directed gold particles
from 0 to 8 h (Fig. 5), consistent with an augmented
role of pol d in later S phase.
We next repeated pol d ⁄ e double labelling in T98G
cells at different time points after cells were stimulated
to proliferate by serum addition. Major features of the
pol d and e staining appeared to be conserved between
mimosine-synchronized fibroblasts and serum-stimula-
ted T98G cells. Analysis of a series of pol d ⁄ e double-
stained cells from the G
1
⁄ S boundary until the late
S phase (22 h) revealed a similar pattern of mainly
focal staining for pol e (65%) and predominantly dis-
persed staining for pol d (30%) (Fig. 6 and Table 1).
Pol e staining was strongest in the early S phase, where
large foci prevailed. In several foci, residual pol d
staining could also be detected. As S phase proceeds,
relative pol e staining and abundance of foci
decreased, as well as the size. Foci contained, on aver-
age, nine gold particles in early S phase, but only
about five gold particles per focus in the mid and late
S phase (Fig. 6). Late S-phase samples showed more
heterogeneity, probably as a result of cells that failed
to proliferate (Fig. S1). For pol d, the dispersed stain-
ing detected in fibroblasts prevailed also in the T98G
cells throughout S phase, with a minor part of pol d
colocalizing to large pol e foci, or forming, less fre-
quently, small own foci (typically three gold particles),
that may well have arisen from a single pol d molecule
Human DNA polymerases a, d and e in replication A. K. Rytko
¨
nen et al.
2990 FEBS Journal 273 (2006) 2984–3001 ª 2006 The Authors Journal compilation ª 2006 FEBS
owing to the amplification process using secondary
antibodies and protein A.
PCNA colocalizes partly with pol d and partly
with pol e
Attempts to detect sites of ongoing DNA replication by
means of BrdU incorporation failed because various
methods of DNA denaturation, required for immunode-
tection of BrdU, destroyed the fine structure of the cryo-
sections. In order to obtain further insight into the
function of pols d and e, we determined the locations of
these proteins, relative to PCNA, by immuno-EM dou-
ble staining. PCNA is a processivity cofactor of both
pols d and e. Therefore, it is considered an important
marker for active replication [52–55]. Still, not necessar-
ily all PCNA participate in DNA replication, as PCNA
is more abundant inside the cell than DNA replication
forks at a given time, and also partakes in other DNA
transactions [54]. As can be seen from a comparison
AF
GB
CH
ID
EK
Fig. 4. Replicative DNA polymerases (pols)
show distinctive localization patterns in
human IMR-90 fibroblasts synchronized with
mimosine. The cells were synchronized to
cell cycle stages, as indicated on the left,
after release from mimosine block. Ultrathin
cryosections were then subjected to immu-
nostaining of pol a followed by staining of
pol e (images A–E), or immunostaining of
pol d followed by staining of pol e (images
F–K). Immunolabelling was visualized under
the electron microscope by linking the pri-
mary antibody to protein A coupled to 5 nm
(small: pol a and d) or 10 nm (large: pol e)
gold particles. Ring-like focal staining of at
least four particles is marked by asterisks,
and examples of beads-on-a-string like stain-
ing of pol d is shown by arrowheads. The
scale bar is 100 nm.
A. K. Rytko
¨
nen et al. Human DNA polymerases a, d and e in replication
FEBS Journal 273 (2006) 2984–3001 ª 2006 The Authors Journal compilation ª 2006 FEBS 2991
between Fig. 7 with Fig. 4, PCNA behaved similarly to
pol a, yielding a staining pattern that is partly focal
(asterisks) and partly disperse or ‘beads-on-a-string’-like
(arrowheads). Similar patterns of PCNA staining, coin-
ciding at least partly with sites of DNA synthesis, have
been reported in previous EM studies of mammalian
and plant cells [56–60]. Focal staining is most apparent
from G
1
to early S phase, and foci contain often also
pol e (Fig. 7F,G, asterisks), and less frequently pol d
(Fig. 7A–C, asterisks). It is noteworthy that although
foci containing only PCNA were rarely detected, pol e
foci free of PCNA were common, in particular in the G
1
and early S phases (Fig. 7F,G,I, open circles). This indi-
cates that pol e is present in preformed structures. As
S phase progresses, pol e staining decreases relative to
PCNA, although the decrease is weaker compared with
the pol d ⁄ e double staining (Fig. 5). In contrast, the
levels of pol d-directed gold particles remain constant,
or show a slight increase, relative to PCNA during the
S phase (Fig. 5).
In double staining of pol d and PCNA, pairs of
small and large gold particles were visualized. They
indicate intimate colocalization of the two proteins
(Fig. 7D,E, arrows). As immunolabelling is obviously
incomplete, such double-labelling probably detects
only part of potential pol d–PCNA complexes.
Taken together, the immuno-EM studies indicate
that pol e adopts mainly a ring-shaped focal staining
that dominates during the early S phase, whereas pol d
is detected mostly as disperse or beads-on-a-string-like
staining that prevails in late S phase. As for pol a and
PCNA, they show staining patterns that combine focal
and dispersed features.
Discussion
An outstanding question in eukaryotic DNA replica-
tion is how the elongating replicases pols d and e
co-operate to achieve efficient and faithful duplication
of the nuclear DNA. We addressed this question in the
present study by combining biochemical and cell biolo-
gical approaches aiming to determine the spatial and
temporal co-ordination of the two pols and additional
replication proteins throughout the S phase. The main
conclusion emerging from this study is that pols d and
e pursue their functions during DNA replication with-
out being physically connected, although they may per-
form complementary functions at the same replication
forks. We infer it from the following observations.
First, the relative contribution of pol d to replicative
DNA synthesis increases steadily with progression of
the S phase at the expense of pol e. This is judged
from the different behaviour which the two pols exhib-
ited in cross-linking nascent DNA (Fig. 1) and binding
chromatin (Fig. 2), as well as the degree of inhibition
of replicative DNA synthesis attained with cognate
inactivating antibodies (Fig. 3). Second, immuno-EM
visualization revealed that pols d and e localize to
mainly different nuclear sites and structures through-
out the S phase (Figs 4 and 6).
The more pronounced contribution of pol e in early
S phase agrees with the proposed role in replication
initiation. Namely, in the budding yeast, chromatin
immunoprecipitation has demonstrated that pols a and
e load concurrently onto origins of replication [28–30].
Subsequently, these pols transferred from origin to
nonorigin DNA concomitantly with Cdc45 and
MCM2-7, possibly reflecting their retention at the rep-
lication fork junction as the replicated ori DNA moves
away [28]. Similarly, pol e loads onto chromatin prior
to initiation in Xenopus egg extracts [31]. The inde-
pendent behaviour of pols d and e observed in this
study could further reflect distinct roles of the two
enzymes during elongation, possibly participation in
the lagging and leading strand DNA synthesis, respect-
ively [61,62].
In a recent chromosome-wide scan in the budding
yeast, Hiraga et al. [61] were able to demonstrate that
Table 1. Distribution of DNA polymerases (pols) between ring-shaped, focal structures and dispersed staining in immuno-electron microsco-
py. The number of 5- and 10-nm gold particles were quantified from pol a ⁄ e and pol d ⁄ e double stainings. Clusters of three or more gold par-
ticles were considered as foci. Four to 29 separate images, representing typically eight to nine nuclei, were counted for each of 17 series
derived from two independent synchronizations (IMR-90 cells) or seven series derived from one synchronization (T98G cells).
Staining
Particles
counted
Particles
in foci
% particles
in foci
Nuclei
counted
Images
counted
IMR-90 Pol a (5 nm) 7029 2880 41.0 129 293
Pol e (10 nm) 4242 3180 75.0
Pol d (5 nm) 6967 2097 30.1 139 304
Pol e (10 nm) 3181 2342 73.6
T98G Pol d (10 nm) 1939 581 30.0 54 131
Pol e (5 nm) 1934 1258 65.0
Human DNA polymerases a, d and e in replication A. K. Rytko
¨
nen et al.
2992 FEBS Journal 273 (2006) 2984–3001 ª 2006 The Authors Journal compilation ª 2006 FEBS
all three replicative pols a, d and e are associated with
early firing origins in cells arrested early in S phase.
These data suggest that all three replicases participate
in the synthesis at each active origin. What is more,
the authors recognized a delayed association of pol d
with origin ARS305 compared with pols a and e. This
is consistent with our data presented here.
The functional differences between pols d and e were
underscored by their ultrastructural visualization using
immuno-EM. This revealed that the level of immuno-
reactive pol e decreases more than threefold relative to
pol d during S phase and that each enzyme exhibits a
strikingly different localization pattern. Whereas pol e
stained mainly as ring-shaped foci, pol d adopted a
more dispersed staining of discrete nuclear territories
with little focal clustering.
Both pol a and PCNA show staining patterns more
similar to pol e in early S phase and to pol d in late S
phase. Where studied, pol a and PCNA partially colo-
calize with pol d as well as pol e. However, colocaliza-
tion of pols d and e was very limited in the double
staining. Hence, pol a and PCNA are present in struc-
tures that contain either pol d or e, but rarely, if at all,
both. Although pol a and PCNA are both well-estab-
lished markers for the sites of DNA synthesis using
immuno-EM and resin-embedded samples [45–47,52–
60,63], it is still uncertain if all the sites of their colo-
calization with pols d and e are actually DNA replica-
tion sites. In other words, we cannot absolutely
exclude the possibility that only a minority of the
detected protein is actively engaged in DNA replica-
tion, while most observed structures have other func-
tions (e.g. storage sites for the replication factors).
Fuss & Linn [32] studied the localization of pol e
in proliferating primary fibroblasts by CLSM. The
authors found that pol e formed foci throughout the
cell cycle. These foci colocalized with PCNA and sites
of DNA synthesis only in late S phase, but were adja-
cent to PCNA foci in early S phase, suggesting a role
of pol e in DNA replication late in S phase. It is diffi-
cult to relate these results to the data presented here.
The small foci detected by CLSM in early S phase
were 300–400 nm across with an optical plane of
600 nm [32]. This is considerably larger than the
ring-shaped foci observed in immuno-EM (Figs 4 and
6). The latter are, in most cases, between 50 and
100 nm across, using ultrathin sections of 70–80 nm
thickness. Therefore, the ring-shape foci described here
are probably below the detection limit of fluorescence
microscopical techniques. In contrast, the larger foci
described by Fuss & Linn [32] in late S phase corres-
pond well in size to the nuclear regions of dispersed
staining of PCNA and pol d that are predominant in
late S phase. These regions span several hundreds of
nm, and contain both dispersed PCNA and focal pol e
(Fig. 7I,K). Nonetheless, direct colocalization is not
Fig. 5. Quantitative analysis of DNA polymerases (pols) a , d and e,
and proliferating cell nuclear antigen (PCNA) in immuno-electron
microscopy. The number of nuclear gold particles representing
the indicated proteins were quantified from images taken from the
respective double stainings from synchronized IMR-90 cells. The
graphs represent the abundance of a given gold particle relative to
the total number of all gold particles in a given staining series. Each
curve represents an independent experiment. Typically, 17–20 ima-
ges from seven to nine nuclei were analysed per time point in each
experiment.
A. K. Rytko
¨
nen et al. Human DNA polymerases a, d and e in replication
FEBS Journal 273 (2006) 2984–3001 ª 2006 The Authors Journal compilation ª 2006 FEBS 2993
apparent at the ultrastructural level. Similar strongly
labelled territories, exceeding 1 lm, have been previ-
ously observed in late S-phase 3T3 cells after ultra-
structural immunolocalization of PCNA and newly
synthesized DNA [58,59].
How can the presented results be explained? One
could consider that the composition of the replication
fork in early S phase differs from that in late S phase to
account, for example, for an augmented role of pol e
during initiation. This model is not consistent with the
observation that pols a, d and e operate at the same ori-
gins in yeast [61] and with current concepts that place
pol d and e on opposite arms of the replication fork, the
lagging and the leading strand, respectively [61,64]. We
therefore favour the idea that physical uncoupling of the
leading strand and the lagging strand DNA synthesis
may be a common feature of the eukaryotic replication
fork, and may account for the differences between pols
d and e described here. Uncoupling from DNA unwind-
ing has been observed in Xenopus extract treated
with the polymerase inhibitor aphidicolin [65,66], and
uncoupling of leading from lagging strand synthesis
after emitine-induced histone depletion [67]. Garg &
Burgers [64] discussed the possibility that eukaryotic
lagging strand synthesis could be distributive, which
would support the model proposed here. There is also
some recent support for a distributive mode of Okazaki
fragment synthesis in Archaea [68].
Although it can be expected that the replicative
function of pols a, d and e dominates during the S
phase, it should be considered that the differences
detected between pols a, d and e could reflect DNA
repair, rather than differences in their contribution to
DNA replication. Szu
¨
ts & Krude [43] reported that
mimosine, utilized in this study for cell synchroniza-
tion, induces DNA damage, as do other agents
synchronizing cells at the S-phase boundary. Mimo-
sine-blocked cells activate a damage response, but
enter S phase with DNA double-strand breaks. The
increased contribution of pol e in early S phase could
simply present the participation of the enzyme in the
DNA damage response or repair. Conversely, the more
pronounced role of pol d in late S phase could be
attributed to DNA repair processes (e.g. the repair of
broken replication forks that prevail at this stage). We
exclude this explanation because cells synchronized by
serum stimulation show an identical inhibition pattern
of DNA replication utilizing neutralizing antibodies,
and show an essentially identical localization pattern
for pols d and e in immuno-EM. The ring-like foci
containing pol e that are most pronounced in mimo-
sine-blocked cells also prevail in G
1
(Fig. 4) and in
asynchronous cells (data not shown), demonstrating
that the observed pol e foci do not depend on DNA
damage response or repair. Furthermore, the localiza-
tion patterns of pol d and e do not apparently alter
Fig. 6. DNA polymerase (pol) d and pol e display distinctive localization patterns in human T98G cells synchronized by serum stimulation.
Quiescent human T98G glioblastoma cells were stimulated to proliferate by the addition of serum. Cells were fixed at the indicated time-
points and ultrathin cryosections were subjected to immunostaining of pol e followed by staining of pol d. Immunolabelling was visualized by
protein A-coupled gold particles of 5 and 10 nm for pol e and d, respectively. Ring-like focal staining of at least four particles is marked by
asterisks. The scale bar is 100 nm.
Human DNA polymerases a, d and e in replication A. K. Rytko
¨
nen et al.
2994 FEBS Journal 273 (2006) 2984–3001 ª 2006 The Authors Journal compilation ª 2006 FEBS
during S phase, only their prevalence and the colocali-
zation with pol a and PCNA change. This is consistent
with the structures being mainly linked to S-phase pro-
gression and DNA replication, rather than a DNA
repair or damage response function. Furthermore, the
polymerase trap and inhibition of replication in isolated
nuclei are both functions of DNA synthesis of the cog-
nate pols. It is difficult to conceive that a DNA synthe-
sis function, other than DNA replication, prevails for
the replicative pols a, d and e during a long time period
that fully overlaps with the entire S phase.
The different behaviour of the three major human
replicases during S phase, presented here, is consistent
with models where pols d and e pursue their functions
during DNA replication at the same forks but without
being physically connected. Clearly, further experi-
ments will be required to determine the actual role of
the three replicases at the eukaryotic replication fork
AF
GB
CH
ID
EK
Fig. 7. Replicative DNA polymerases (pols)
d and e partly colocalize with proliferating
cell nuclear antigen (PCNA) in immuno-elec-
tron microscopy. Human IMR-90 fibroblasts
were synchronized to cell cycle stages, as
indicated on the left. Ultrathin cryosections
of synchronized human IMR-90 fibroblasts
were subjected to immuno-staining of pol d
followed by staining of PCNA (images A–E),
or immuno-staining of PCNA followed by
staining of pol e (images F–K). Immunolabel-
ling was visualized by linking the primary
antibody to protein A coupled to 5 nm
(small) or 10 nm (large) gold particles, as
indicated. Ring-like focal staining of at least
four particles of pol e without PCNA is
marked with an open ring, other foci of at
least four particles are marked with
asterisks, and examples of beads-on-a-string
like staining are marked with arrowheads.
Couples of closely colocalizing pol d and
PCNA are marked by arrows. The scale bar
is 100 nm.
A. K. Rytko
¨
nen et al. Human DNA polymerases a, d and e in replication
FEBS Journal 273 (2006) 2984–3001 ª 2006 The Authors Journal compilation ª 2006 FEBS 2995
thought to have arisen independently of the more
familiar bacterial counterpart [69].
Experimental procedures
Antibodies
The primary antibodies used are listed in Table 2. Rabbit
polyclonal antibody K30, against the human pol d catalytic
subunit, was raised against a peptide corresponding to
amino acids 108–276 (Swissprot entry P28340), expressed as
a glutathione S-transferase (GST) fusion protein, as des-
cribed previously [9]. Rabbit polyclonal antibody K19 was
raised against amino acids 473–657 of the catalytic subunit
of pol e (Swissprot entry Q07864), as described previously
[9]. Purified mouse IgG (Pierce, Rockford, IL, USA) was
used as a control, rabbit anti-mouse IgG (Zymed, San
Francisco, CA, USA or Jackson Immunoresearch, West
Grove, PA, USA) and rabbit anti-rat IgG (Jackson Immuno-
research) were used as secondary antibodies in immuno-
EM, and horseradish peroxidase-conjugated antibodies
(Jackson Immunoresearch or Chemicon, Chandlers
Ford, UK) were used as secondary antibodies in western
blotting.
Cell culture and synchronization
HeLa CCL2 monolayer cells [American Type Culture Col-
lection (ATCC), Manassas, VA, USA] were cultured in
Dulbecco’s modified Eagle’s medium containing 10% fetal
bovine serum and antibiotics (Invitrogen, Paisley, UK) at
37 °C in a 5% CO
2
atmosphere. HeLa S3 (ATCC CCL
2.2) spinner cells were cultured in Joklik’s modification of
minimum essential medium (ICN, Aurora, OH, USA) sup-
plemented with antibiotics and 5% newborn calf serum
(Invitrogen) at 37 °C. IMR-90 human fetal lung fibroblasts
(ATCC CCL 186) and T98G human glioblastoma cells
(CRL 1690) were grown in Eagle’s minimal essential med-
ium supplemented with Earle’s salts, 10% fetal bovine
serum, nonessential amino acids, l-glutamine and antibiot-
ics, at 37 °Cina5%CO
2
atmosphere. Fibroblasts were
grown at the most for 20 passages before collection for
experiments. HeLa cells and fibroblasts were synchronized
by blocking the progress of the cell cycle to the G
1
⁄ S bor-
der with 0.5 mm mimosine for 16–18 h [33]. Cells were
released from the block by removing the mimosine-contain-
ing medium. Fibroblasts were washed with warm culture
medium prior to addition of conditioned medium. T98G
cells were starved in medium containing 0.25% serum
for > 6 days followed by serum stimulation with condi-
tioned, complete medium. The efficacy of the synchroniza-
tion was demonstrated by flow cytometry analysis (Beckton
Dickinson, Helsinki, Finland) of propidium iodide-stained
cells [70] or by the incorporation of [
3
H]thymidine in paral-
lel cell cultures.
UV cross-linking
UV cross-linking of proteins to nascent DNA in monolay-
ers of isolated nuclei was performed, as described previ-
ously [11], with minor modifications. Cells were washed
with buffer KM (10 mm Mops-NaOH, pH 7.0, 10 mm
Table 2. Primary antibodies used in this study. MCM2, minichromosome maintenance deficient-2; PCNA, proliferating cell nuclear antigen;
PDI, protein disulfide isomerase.
Protein Clone Species ⁄ type Source ⁄ purification Reference
Pol a catalytic subunit 1Ct102, 2Ct25 Mouse monoclonal Protein G [72]
Cl22–2-42B Mouse monoclonal MBL (Nagoya, Japan) [45]
SJK-132–20 Mouse monoclonal ATCC CRL-1640, protein G [43]
p140 Rabbit polyclonal Serum [73]
Pol d catalytic subunit PDG-1E8 Rat monoclonal Hybridoma supernatant This study
a
78F5 Mouse monoclonal Protein A [44]
K30 Rabbit polyclonal Protein A This study
Pol d B subunit PDK-7B4 Rat monoclonal Hybridoma supernatant This study
a
Pol e catalytic subunit G1A, H3B, E24C Mouse monoclonal Protein G [50]
K18 Rabbit polyclonal Protein A [9]
K19 Rabbit polyclonal Protein A This study
PCNA PC10 Mouse monoclonal Roche ⁄ Sigma ⁄ Zymed [74]
MCM2 N19 Rabbit polyclonal Santa Cruz Biotechnologies
Lamins A ⁄ C N18 Rabbit polyclonal Santa Cruz Biotechnologies
pan-histone H11-4 Mouse monoclonal Chemicon
b-tubulin KMX-1 Mouse monoclonal Chemicon
GM130 35 Mouse monoclonal BD Biosciences
PDI 5B5 Mouse monoclonal Dakopats
a
Details of the antibody will be published elsewhere. (Chen S, Kremmer E, Weisshart K, Hubscher U and Nasheuer H-P, unpublished data).
Human DNA polymerases a, d and e in replication A. K. Rytko
¨
nen et al.
2996 FEBS Journal 273 (2006) 2984–3001 ª 2006 The Authors Journal compilation ª 2006 FEBS
NaCl, 1 mm MgCl
2
,2mm dithiothreitol, 1 · complete
TM
protease inhibitor cocktail tablets) (Roche, Espo, Finland)
and lysed by incubation for 30 min on ice with buffer KM
containing 0.5% NP-40, resulting in a monolayer of iso-
lated nuclei. The nuclear monolayers were then washed
twice with buffer KAc (30 mm Hepes-KOH, pH 7.5, 5 mm
potassium acetate, 0.5 mm MgCl
2
,2mm dithiothreitol,
1 · complete
TM
). The replication mixture contained 30 mm
Hepes-KOH, pH 7.8, 50 mm potassium acetate, 5 mm
MgCl
2
,2mm dithiothreitol, 0.05% NP-40, 2 l m each of
dGTP and dCTP, 20 lm BrdUTP, 0.5 lm [
32
P]dATP[aP]
(specific activity 1000 CiÆmmol
)1
), 2 mm ATP and other
rNTPs at 20 lm; 400 lL of the replication mixture was
used for a 6 cm plate and reactions proceeded for 2.5 min
at 30 °C without agitation. The replication mixture was
used for a total of three successive plates. After labelling,
the nuclei were washed with buffer KAc and UV irradiated
with a standard UV illuminator for 6 min. The irradiated
nuclei were treated with DNase (40 mm Tris ⁄ HCl, pH 8.0,
6mm MgCl
2
, 1.5 mm CaCl
2
and 50 units of DNase IÆmL
)1
)
for 30 min at 37 °C to remove bulk DNA. Protein–DNA
complexes were extracted with phenol, precipitated with
acetone, collected at 0 °C and washed three times. The
dried protein–DNA pellet was resuspended by boiling in
denaturation buffer (50 mm Tris ⁄ HCl, pH 7.5, 0.5% SDS,
70 mm b-mercaptoethanol) and renatured (50 mm
Tris ⁄ HCl, pH 7.5, 150 mm NaCl, 0.5% NP-40, 1 · com-
plete
TM
protease inhibitors). Proteins were then ready for
immunoprecipitation.
For immunoprecipitations, 7 mg of protein A–Sepharose
and 3 lL of p140 serum, 4 lL of K30 serum and 8 lgof
purified K19 antibody were used to precipitate, in parallel,
pol a, d and e, respectively. Immunoprecipitates were
washed three times with washing buffer (50 mm Tris ⁄ HCl,
pH 7.5, 150 mm NaCl, 0.5% NP-40). Proteins were eluted
with SDS loading buffer and separated through 6%
SDS ⁄ PAGE, transferred to poly(vinylidene difluoride)
membrane and autoradiographed. After autoradiography,
proteins were detected using chemiluminescence reagents
(Pierce). Antibodies 1Ct102 and 2Ct25, PDG-1E8, or a
combination of G1A, H3B and E24C, were used for detec-
tion of pol a, pol d and pol e, respectively. The radioactive
signals of the cross-linked derivatives of the pols and the
immunoreactive signal from western blots were analysed
after scanning with an Image Scanner (Amersham Bio-
sciences, Helsinki, Finland) and quantified using the image-
quant (Amersham Biosciences) software. The cross-linking
intensity was normalized relative to the average of a series.
Chromatin association
Hela CCL2 cells were lysed and proteins fractionated at 4 °C
to give an NP-40 (‘detergent soluble’) fraction, a high-salt
(bound) fraction and a remaining (high salt resistant) frac-
tion as follows. Cells were washed with TBS (50 mm
Tris ⁄ HCl, pH 7.5, 150 mm NaCl) and twice with buffer ME
(10 mm Mops-NaOH, pH 7.0, 10 m m NaCl, 1 m m EDTA,
2mm dithiothreitol), and lysed for 30 min with buffer ME
containing 0.5% NP-40 and 1 · complete
TM
protease inhib-
itor. The resulting supernatant was the detergent-soluble
fraction. The permeabilized nuclei were washed twice with
buffer KAcE (30 mm Hepes-KOH, pH 7.5, 5 mm potassium
acetate, 1 mm EDTA, 2 mm dithiothreitol, 1 · complete
TM
),
and proteins were extracted for 15 min with buffer ME con-
taining 500 mm NaCl. The plates were washed twice with
buffer ME containing 500 mm NaCl, and the remaining
material was solubilized, using a cell scraper at room tem-
perature, in buffer ME containing 100 mm NaCl and 0.5%
SDS. In parallel, cells from a second plate were solubilized
directly in buffer ME containing 100 mm NaCl and 0.5%
SDS followed by sonication to give total cell extract.
Proteins were separated by 6% SDS ⁄ PAGE and equality
of loading was monitored by SYPRO Orange (Bio-Rad,
Espo, Finland) staining. Signals were quantified as des-
cribed for UV cross-linking. Western analysis was as des-
cribed for UV cross-linking except that antibody K30 was
used for recognition of pol d.
The protein levels of the bound pols were quantified by
densitometric scan of the western chemiluminescence expo-
sures to evaluate the changes in detergent-resistant pol pro-
tein during S-phase progression. Repeats of the western
analysis were conducted for each of the two independent
experiments. We applied statistical modelling, allowing for
the variations both across the replicates and the experiments.
Preparation and permeabilization of HeLa cell
nuclei and cytoplasmic extracts, and the DNA
replication assay in isolated nuclei
Preparation of HeLa CCL2 and T98G monolayer cell nuc-
lei, and HeLa CCL2 monolayer or S3 spinner cell cytoplas-
mic extract, as well as subsequent permeabilization of the
nuclei with lysolecithin, were performed as described previ-
ously [38,39]. Nuclei were permeabilized immediately before
use, washed and suspended in a Dounce homogeniser by 10
strokes with a loose fitting pestle. DNA replication reac-
tions in isolated nuclei were performed at least in triplicate
per experiment, as described previously [9]. Antibodies SJK
132-20, 78F5 and K18 were used to inhibit pol a, d and e,
respectively. Nuclei, cytoplasmic extract and neutralizing
antibodies against the indicated pols were incubated for
90 min on ice in the reaction mixture prior to the reaction.
Reactions were incubated at 37 °C for 60 min, based on
initial time course experiments (data not shown).
Immunoelectron microscopy
Synchronized IMR-90 and T98G cells were fixed with 4%
paraformaldehyde in 0.1 m phosphate buffer, pH 7.5,
A. K. Rytko
¨
nen et al. Human DNA polymerases a, d and e in replication
FEBS Journal 273 (2006) 2984–3001 ª 2006 The Authors Journal compilation ª 2006 FEBS 2997
containing 2.5% sucrose, for 30 min, detached and centri-
fuged to a tight pellet (2000 g for 3 min). The pellet was
mixed to a small volume of 4% gelatine or 2% NuSieve
agarose (FMC BioProducts, Philadelphia, PA, USA) in
phosphate-buffered saline (NaCl ⁄ P
i
)at37°C, cooled and
immersed into 2.3 m sucrose in NaCl ⁄ P
i
. The specimens
were frozen in liquid nitrogen and thin cryosections were
cut with Leica Ultracut UCT microtome (Leica Microsys-
tems, Wetzlar, Germany). The sections were first incubated
in 5% BSA, 0.1% gelatine in NaCl ⁄ P
i
. Antibodies and gold
conjugates were diluted in 0.1% BSA-C (Aurion, Wagenin-
gen, The Netherlands) in NaCl ⁄ P
i
. All washing steps were
performed in 0.1% BSA-C in NaCl ⁄ P
i
. For the double-
labelling experiments, after blocking as described above,
sections were exposed to the first primary antibody for
60 min followed by incubation with rabbit antimouse IgG
at 1.9 lgÆmL
)1
or antirat IgG at 1.6 lgÆmL
)1
, depending
on the source of the primary antibody, for 30 min, and
protein A–gold complex, size 5 nm for 30 min [71]. After
washings, 1% glutaraldehyde in 0.1 m phosphate buffer
was used to block free binding sites on protein A. The sec-
tions were then incubated with the second antibody for
60 min followed by antimouse or rat IgG for 30 min and
the protein A–gold complex (size 10 nm) for 30 min, as des-
cribed above. Antibodies Cl22-2-42B, PDK-7B4, H3B,
G1A and PC10 were used for detection of pols a, d , e and
PCNA, respectively. Primary antibodies were used at
5 lgÆmL
)1
except for antibody PDK-7B4, for which a dilu-
tion of 1 : 2 to 1 : 3 of hybridoma supernatant was utilized.
The controls were prepared by carrying out the labelling
procedure without primary antibody. The efficiency of
blocking was controlled by performing the labelling proce-
dure in the absence of the second primary antibody. The
sections were embedded in methylcellulose and examined in
a Philips CM100 transmission electron microscope (FEI
Co., Hillsboro, OR, USA). Images were captured by a
CCD camera equipped with tcl-em-menu, version 3, from
Tietz Video and Image Processing Systems GmbH (Gau-
ting, Germany).
Statistical methods
The data from all series of experiment were analyzed by
normal linear regression models appropriately specified in
each case. The time trends in the measured outcomes were
described by including linear, as well as quadratic, terms of
the time factor in the model. The outcome variable was
transformed onto the natural logarithmic scale when mod-
elling the time trends, both in cross-linking intensity and in
chromatin association, because relative values of the out-
come were analyzed. As a null hypothesis we considered a
model in which the slope (coefficient of the linear term)
had the same value shared by the three polymerases. This
was evaluated against a model which allowed different
values of these regression coefficients for the separate
polymerases using the F statistics for nested models and
two-tailed t statistics for the appropriate contrasts between
the polymerases. The soundness of the model assumptions
were graphically examined by conventional residual plots.
The computations were performed using the R statistical
language ( especially its lm func-
tion designed to fit linear models.
Acknowledgements
This work was funded by grants from the Academy of
Finland to J.E.S and H.P. G.K. acknowledges support
by the Israel Cancer Research Fund (ICRF) and Uni-
ted States-Israel Bionational Science foundation. G.K.
is an incumbent of the Louise and Nahum Barag Chain
of Cancer Molecular Genetics. H.P.N. is supported by
grants Health Research Board, Ireland RP ⁄ 2003 ⁄ 133
und DFG SFB604. Antibodies 5B5 and GM130 were
generous gifts from R. Myllyla
¨
and S. Kellokumpu.
We thank Sirpa Kellokumpu and Leena Pa
¨
a
¨
kko
¨
nen
for excellent technical assistance.
References
1Hu
¨
bscher U, Maga G & Spadari S (2002) Eukaryotic
DNA polymerases. Annu Rev Biochem 71, 133–163.
2 Steitz TA (1998) A mechanism for all polymerases.
Nature 391, 231–232.
3 Lehman IR & Kaguni LS (1989) DNA polymerase a.
J Biol Chem 264, 4265–4268.
4 Bullock PA, Seo YS & Hurwitz J (1991) Initiation of
simian virus 40 DNA synthesis in vitro. Mol Cell Biol
11, 2350–2361.
5 Nethanel T & Kaufmann G (1990) Two DNA poly-
merases may be required for synthesis of the lagging
strand DNA of simian virus 40. J Virol 64, 5912–5918.
6 Waga S & Stillman B (1994) Anatomy of a DNA repli-
cation fork revealed by reconstitution of SV40 DNA
replication in vitro. Nature 369, 207–212.
7 Tsurimoto T & Stillman B (1991) Replication factors
required for SV40 DNA replication in vitro. II. Switch-
ing of DNA polymerase alpha and delta during initia-
tion of leading and lagging strand synthesis. J Biol
Chem 266, 1961–1968.
8 Waga S & Stillman B (1998) The DNA replication fork
in eukaryotic cells. Annu Rev Biochem 67, 721–751.
9 Pospiech H, Kursula I, Abdel-Aziz W, Malkas L, Uitto
L, Kastelli M, Vihinen-Ranta M, Eskelinen S & Syva
¨
oja
JE (1999) A neutralizing antibody against human DNA
polymerase e inhibits cellular but not SV40 DNA repli-
cation. Nucleic Acids Res 27, 3799–3804.
10 Waga S, Bauer G & Stillman B (1994) Reconstitution
of complete SV40 DNA replication with purified repli-
cation factors. J Biol Chem 269, 10923–10934.
Human DNA polymerases a, d and e in replication A. K. Rytko
¨
nen et al.
2998 FEBS Journal 273 (2006) 2984–3001 ª 2006 The Authors Journal compilation ª 2006 FEBS
11 Zlotkin T, Kaufmann G, Jiang Y, Lee MYWT, Uitto
L, Syva
¨
oja J, Dornreiter I, Fanning E & Nethanel T
(1996) DNA polymerase e may be dispensable for
SV40- but not cellular-DNA replication. EMBO J 15,
2298–2305.
12 Pospiech H & Syva
¨
oja J (2003) DNA polymerase epsi-
lon – more than a polymerase. ScientificWorldJournal 3,
87–104.
13 Budd ME & Campbell JL (1993) DNA polymerases delta
and epsilon are required for chromosomal replication in
Saccharomyces cerevisiae. Mol Cell Biol 13, 496–505.
14 Morrison A, Araki H, Clark AB, Hamatake RK &
Sugino A (1990) A third essential DNA polymerase in
S. cerevisiae. Cell 62, 1143–1151.
15 D’Urso G & Nurse P (1997) S. pombe cdc20
+
encodes
DNA polymerase e and is required for the chromosomal
replication but not for S phase checkpoint. Proc Natl
Acad Sci USA 94, 12491–12496.
16 Sugino A, Ohara T, Sebastian J, Nakashima N & Araki
H (1998) DNA polymerase e encoded by cdc20+is
required for chromosomal DNA replication in the fis-
sion yeast Schizosaccharomyces pombe. Genes Cells 3,
99–110.
17 Navas TA, Zhou Z & Elledge SJ (1995) DNA polymer-
ase e links the DNA replication machinery to the S
phase checkpoint. Cell 80, 29–39.
18 Kesti T, Flick K, Keranen S, Syva
¨
oja JE & Wittenberg
C (1999) DNA polymerase e catalytic domains are dis-
pensable for DNA replication, DNA repair, and cell
viability. Mol Cell 3, 679–685.
19 Dua R, Levy DL & Campbell JL (1999) Analysis of the
essential functions of the C-terminal protein ⁄ protein
interaction domain of Saccharomyces cerevisiae pol e
and its unexpected ability to support growth in the
absence of the DNA polymerase domain. J Biol Chem
274, 22283–22288.
20 Feng W & D’Urso G (2001) Schizosaccharomyces pombe
cells lacking the amino-terminal catalytic domains of
DNA polymerase e are viable but require the DNA
damage checkpoint control. Mol Cell Biol 21, 4495–
4504.
21 Ohya T, Kawasaki Y, Hiraga S, Kanbara S, Nakajo K,
Nakashima N, Suzuki A & Sugino A (2002) The DNA
polymerase domain of pol e is required for rapid, effi-
cient, and highly accurate chromosomal DNA replica-
tion, telomere length maintenance, and normal cell
senescence in Saccharomyces cerevisiae. J Biol Chem
277, 28099–28108.
22 Waga S, Masuda T, Takisawa H & Sugino A (2001)
DNA polymerase e is required for coordinated and effi-
cient chromosomal DNA replication in Xenopus egg
extract. Proc Natl Acad Sci USA 98, 4978–4983.
23 Karthikeyan R, Vonarx EJ, Straffon AFL, Simon M,
Faye G & Kunz BA (2000) Evidence from mutational
specificity studies that yeast DNA polymerases d and e
replicate different DNA strands at an intracellular repli-
cation fork. J Mol Biol 299, 405–419.
24 Shcherbakova PV & Pavlov YI (1996) 3¢fi5¢ exonuc-
leases of DNA polymerases e and d correct base analog
induced DNA replication errors on opposite DNA
strands in Saccharomyces cerevisiae. Genetics 142, 717–
726.
25 Pavlov YI, Newlon CS & Kunkel TA (2002) Yeast ori-
gins establish a strand bias for replicational mutagen-
esis. Mol Cell 10 , 207–213.
26 Datta A, Schmeits JL, Amin NS, Lau PJ, Myung K &
Kolodner RD (2000) Checkpoint-dependent activation
of mutagenic repair in Saccharomyces cerevisiae pol3–01
mutants. Mol Cell 6, 593–603.
27 Pavlov YI, Mian IM & Kunkel TA (2003) Evidence for
preferential mismatch repair of lagging strand DNA
replication errors in yeast. Curr Biol 13, 744–748.
28 Aparacio OM, Weinstein DM & Bell SP (1997) Compo-
nents and dynamics of DNA replication complexes in
S. cerevisiae, redistribution of MCM proteins and
Cdc45p during S phase. Cell 91, 59–69.
29 Aparacio OM, Stout AM & Bell SP (1999) Differential
assembly of Cdc45p and DNA polymerases at early and
late origins of DNA replication. Proc Natl Acad Sci
USA 96, 9130–9135.
30 Masumoto H, Sugino A & Araki H (2000) Dpb11 con-
trols the association between DNA polymerases a and e
and the autonomously replicating sequence region of
budding yeast. Mol Cell Biol 20, 2809–2817.
31 Mimura S, Masuda T, Matsui T & Takisawa H (2000)
Central role for Cdc45 in establishing an initiation com-
plex of DNA replication in Xenopus egg extract. Genes
Cells 5, 439–452.
32 Fuss G & Linn S (2002) Human DNA polymerase e
colocalizes with PCNA and DNA replication late, but
not early in S phase. J Biol Chem 277, 8658–8666.
33 Krude T (1999) Mimosine arrests proliferating human
cells before onset of DNA replication in a dose-depend-
ent manner. Exp Cell Res 247, 148–159.
34 Krude T (2000) Initiation of human DNA replication
in vitro using nuclei from cells arrested at an initiation-
competent state. J Biol Chem 275, 13699–13707.
35 Insdorf NF & Bogenhagen DF (1989) DNA polymerase
c from Xenopus laevis. J Biol Chem 264, 21498–21503.
36 Todorov IT, Attaran A & Kearsey SE (1995) BM28, a
human member of the MCM2-3–5 family, is displaced
from chromatin during DNA replication. J Cell Biol
129, 1433–1445.
37 Huang D, Pospiech H, Kesti T & Syva
¨
oja JE (1999)
Structural organization and splice variants of the
POLE1 gene encoding the catalytic subunit of human
DNA polymerase e. Biochem J 339, 657–665.
38 Krude T, Jackman M, Pines J & Laskey RA (1997)
Cyclin ⁄ Cdk-dependent initiation of DNA replication in
a human cell-free system. Cell 88, 109–119.
A. K. Rytko
¨
nen et al. Human DNA polymerases a, d and e in replication
FEBS Journal 273 (2006) 2984–3001 ª 2006 The Authors Journal compilation ª 2006 FEBS 2999
39 Stoeber K, Mills AD, Kubota Y, Krude T,
Romanowski P, Marheineke K, Laskey RA & Williams
GH (1998) Cdc6 protein causes premature entry into
S phase in a mammalian cell-free system. EMBO J 17,
7219–7229.
40 Heintz NH & Stillman BW (1988) Nuclear DNA synth-
esis in vitro is mediated via stable replication forks
assembled in a temporally specific fashion in vivo. Mol
Cell Biol 8, 1923–1931.
41 Tanaka S, Hu SZ, Wang TS-F & Korn D (1982)
Preparation and preliminary characterization of mono-
clonal antibodies against human DNA polymerase a.
J Biol Chem 257, 8386–8390.
42 Jiang Y, Zhang SJ, Wu SM & Lee MYWT (1995)
Immunoaffinity purification of DNA polymerase d.
Arch Biochem Biophys 320 , 297–304.
43 Szu
¨
ts D & Krude T (2004) Cell cycle arrest at the initia-
tion step of human chromosomal DNA replication
causes DNA damage. J Cell Sci 17, 4897–4908.
44 Nakamura H, Morita T, Masaki S & Yoshida S (1984)
Intracellular localization and metabolism of DNA poly-
merase a in human cells visualized with monoclonal
antibody. Exp Cell Res 151, 123–133.
45 Jaunin F, Visser AE, Cmarko D, Aten JA & Fakan S
(2000) Fine structural in situ analysis of nascent DNA
movement following DNA replication. Exp Cell Res
260, 313–323.
46 Lattanzi G, Galanzi A, Gobbi P, Falconi M, Matteucci
A, Breschi L, Vitale M & Mazzotti G (1998) Ultra-
structural aspects of the DNA polymerase a distribution
during the cell cycle. J Histochem Cytochem 46, 1435–
1442.
47 Hoza
´
k P, Hassan B, Jackson DA & Cook PR (1993)
Visualisation of replication factories attached to a
nucleoskeleton. Cell 73, 361–373.
48 Hoza
´
k P, Jackson DA & Cook PR (1994) Replication
factories and nuclear bodies, the ultrastructural charac-
terization of replication sites during the cell cycle. J Cell
Sci 107, 2191–2202.
49 Uitto L, Halleen J, Hentunen T, Ho
¨
yhtya
¨
M & Syva
¨
oja
JE (1995) Structural relationship between DNA poly-
merases e and e* and their occurrence in eukaryotic
cells. Nucleic Acids Res 23, 244–247.
50 Lee MYWT, Tan CK, Downey KM & So AG (1984)
Further studies on calf thymus DNA polymerase d puri-
fied to homogeneity by a new procedure. Biochemistry
23, 1906–1913.
51 Szekely AM, Chen Y-H, Zhang C, Oshima J & Weiss-
man SM (2000) Werner protein recruits DNA polymer-
ase d to the nucleolus. Proc Natl Acad Sci USA 97,
11365–11370.
52 Bravo R & MacDonald-Bravo H (1987) Existence of
two populations of cyclin ⁄ proliferating cell nuclear
antigen during the cell cycle: association with DNA
replication sites. J Cell Biol 105, 1549–1554.
53 Leonhardt H, Rahn H-P, Weinzierl P, Sporbert A,
Cremer T, Zink D & Cardoso MC (2000) Dynamics of
DNA replication factories in living cells. J Cell Biol 149 ,
271–279.
54 Maga G & Hu
¨
bscher U (2003) Proliferating cell nuclear
antigen (PCNA): a dancer with many partners. J Cell
Sci 116, 3051–3060.
55 Sporbert A, Gahl A, Ankerhold R, Leonhardt H &
Cardoso MC (2002) DNA polymerase clamp shows lit-
tle turnover at established replication sites but sequen-
cial de novo assembly at adjacent origin clusters. Mol
Cell 10, 1355–1365.
56 Gonza
´
lez-Melendi P, Testillano PS, Ahmadian P, Beg-
on
˜
a F & Risuen
˜
o M-C (1996) New in situ approaches
to study the induction of pollen embryogenesis in Capsi-
cum annum. Eur J Cell Biol 69, 373–386.
57 Gonza
´
lez-Melendi P, Testillano PS, Ahmadian P, Reyes
J & Risuen
˜
o M-C (2000) Immunoelectron microscopy
of PCNA as an efficient marker for studying replication
times and sites during pollen development. Chromosoma
109, 397–409.
58 Ras
ˇ
ka I, Koberna K, Jarnı
´
k M, Petras
ˇ
ovic
ˇ
ova V, Bed-
na
´
r J, Ras
ˇ
ka K Jr & Bravo R (1989) Ultrastructural
immunolocalization of cyclin ⁄ PCNA in synchronized
3T3 cells. Exp Cell Res 184, 81–89.
59 Ras
ˇ
ka I, Michel LS, Jarnı
´
k M, Dundr M, Fakan S,
Gasser S, Gassmann M, Hu
¨
bscher U, Izaurralde E,
Martinez E et al. (1991) Ultrastructural cryoimmuno-
cytochemistry is a convenient tool for the study of
DNA replication in cultured cells. J Electron Microsc
Tech 18, 91–105.
60 Sobczak-Thepot J, Harper F, Florentin I, Zindy F,
Brechot C & Puvion E (1993) Localization of cyclin A
at sites of cellular DNA replication. Exp Cell Res 206,
43–48.
61 Hiraga S-I, Hagihara-Hayashi A, Ohya T & Sugino A
(2005) DNA polymerases alpha, delta, and epsilon
localize and function together at replication forks in
Saccharomyces cerevisiae. Genes Cells 10, 297–309.
62 Fukui T, Yamauchi K, Muroya T, Akiyama M, Maki
H, Sugino A & Waga S (2004) Distinct roles of DNA
polymerases d and e at the replication fork in Xenopus
egg extract. Genes Cells 9, 179–191.
63 Philimonenko AA, Hodny Z, Jackson DA & Hozak P
(2006) The microarchitecture of DNA replication
domains. Histochem Cell Biol 125, 103–117.
64 Garg P & Burgers PMJ (2005) DNA polymerases that
propagate the eukaryotic DNA replication fork. Crit
Rev Biochem Mol Biol 40, 115–128.
65 Walter JC & Newport J (2000) Initiation of eukaryotic
DNA replication: origin unwinding and sequential chro-
matin association of Cdc45, RPA, and DNA polymer-
ase alpha. Mol Cell 5, 617–627.
66 Pacek M, Tutter AV, Kubota Y, Takisawa H & Walter
JC (2006) Localization of MCM2-7, Cdc45, and GINS
Human DNA polymerases a, d and e in replication A. K. Rytko
¨
nen et al.
3000 FEBS Journal 273 (2006) 2984–3001 ª 2006 The Authors Journal compilation ª 2006 FEBS
to the site of DNA unwinding during eukaryotic DNA
replication. Mol Cell 21, 581–587.
67 Burhans WC, Vassilev LT, Wu JM, Sogo J, Nallaseth
FS & DePamphilis M (1991) Emetine allows identi-
fication of origins of mammalian DNA replication by
imbalanced DNA synthesis, not through conservative
nucleosome segregation. EMBO J 10, 4351–4360.
68 Matsunaga F, Norais C, Forterre P & Myllykallio H
(2003) Identification of short ‘eukaryotic’ Okazaki frag-
ments synthesized from a prokaryotic replication origin.
EMBO Rep 4, 154–158.
69 Leipe DD, Aravind L & Koonin EV (1999) Did DNA
replication evolve twice independently? Nucleic Acids
Res 27, 3389–3401.
70 Vindelo
¨
v LL, Christensen IJ & Nissen NI (1983) Stan-
dardization of high-resolution flow cytometric DNA
analysis by the simultaneous use of chicken and trout
red blood cells as internal reference standards. Cytome-
try 3, 323–327.
71 Slot JW & Geuze HJ (1985) A novel method to make
gold probes for multiple labeling cytochemistry. Eur J
Cell Biol 38, 87–93.
72 Dornreiter I (1991) Generation of monoclonal antibod-
ies against DNA polymerase a-primase and their use for
investigating protein–protein interactions during viral
DNA replication. PhD Thesis. Munich University,
Munich, Germany.
73 Stadlbauer F, Brueckner A, Rehfuess C, Eckerskorn C,
Lottspeich F, Forster V, Tseng BY & Nasheuer HP
(1994) DNA replication in vitro by recombinant DNA-
polymerase-a-primase. Eur J Biochem 222, 781–793.
74 Waseem NH & Lane DP (1990) Monoclonal antibody
analysis of the proliferating cell nuclear antigen
(PCNA). Structural conservation and the detection of a
nucleolar form. J Cell Sci 96, 121–129.
Supplementary material
The following supplementary material is available
online:
Doc. S1. Statistical modelling of the relative photolabel-
ling of replicative pols a, d and e.
Fig. S1. Human T98G glioblastoma cells were starved
for 6 days in medium containing 0.25 % serum and then
stimulated to proliferate in complete medium. Flow cytr-
ometric analysis indicates cell cycle progression based on
the DNA content of cells at the indicated times.
Fig. S2. Human IMR-90 fibroblasts were synchronised
to G1 phase by release from confluency, or they were
subsequently synchronised to G1 ⁄ S boundary with
mimosine and released for 4, 8 or 12 hours to yield
samples at different S phase stages. Flow cytrometric
analysis indicates the DNA content of cells throughout
the time course.
This material is available as part of the online article
from
A. K. Rytko
¨
nen et al. Human DNA polymerases a, d and e in replication
FEBS Journal 273 (2006) 2984–3001 ª 2006 The Authors Journal compilation ª 2006 FEBS 3001