Báo cáo khoa học: A modelling approach to quantify dynamic crosstalk between the pheromone and the starvation pathway in baker’s yeast pot
Bạn đang xem bản rút gọn của tài liệu. Xem và tải ngay bản đầy đủ của tài liệu tại đây (415.08 KB, 14 trang )
A modelling approach to quantify dynamic crosstalk
between the pheromone and the starvation pathway
in baker’s yeast
Jo
¨
rg Schaber
1
, Bente Kofahl
2
, Axel Kowald
1
and Edda Klipp
1
1 Max Planck Institute for Molecular Genetics, Berlin, Germany
2 Humboldt University Berlin, Theoretical Biophysics, Germany
Cells respond to their environment based on external
cues. A great variety of receptors exist that are able to
sense all kinds of stimuli and trigger corresponding
responses in the cell through signalling pathways.
However, life is complex and in order to make the
right decisions concerning growth, proliferation, stress
response, etc., cells must not only be able to process
multiple information in parallel but also to combine
and integrate this information. It can be expected that
a cell’s response to multiple stimuli is not just the sum
of the individual responses but that signals suppress
or amplify each other according to their respective
importance. This is achieved by wiring signalling path-
ways in such a way that they can interact with each
Keywords
crossactivation; crossinhibition; filamentous
growth pathway; mathematical model;
mating
Correspondence
E. Klipp, Max Planck Institute for Molecular
Genetics, Ihnestr 63-73, 14195 Berlin,
Germany
Fax: +49 30 804093 22
Tel: +49 30 804093 16
E-mail:
Note
The mathematical model described here has
been submitted to the Online Cellular
Systems Modelling Database and can be
accessed free of charge at chem.
sun.ac.za/database/schaber/index.html.
(Received 7 April 2006, revised 2 June
2006, accepted 6 June 2006)
doi:10.1111/j.1742-4658.2006.05359.x
Cells must be able to process multiple information in parallel and, more-
over, they must also be able to combine this information in order to trigger
the appropriate response. This is achieved by wiring signalling pathways
such that they can interact with each other, a phenomenon often called
crosstalk. In this study, we employ mathematical modelling techniques to
analyse dynamic mechanisms and measures of crosstalk. We present a
dynamic mathematical model that compiles current knowledge about the
wiring of the pheromone pathway and the filamentous growth pathway in
yeast. We consider the main dynamic features and the interconnections
between the two pathways in order to study dynamic crosstalk between
these two pathways in haploid cells. We introduce two new measures of
dynamic crosstalk, the intrinsic specificity and the extrinsic specificity.
These two measures incorporate the combined signal of several stimuli
being present simultaneously and seem to be more stable than previous
measures. When both pathways are responsive and stimulated, the model
predicts that (a) the filamentous growth pathway amplifies the response of
the pheromone pathway, and (b) the pheromone pathway inhibits the
response of filamentous growth pathway in terms of mitogen activated pro-
tein kinase activity and transcriptional activity, respectively. Among several
mechanisms we identified leakage of activated Ste11 as the most influential
source of crosstalk. Moreover, we propose new experiments and predict
their outcomes in order to test hypotheses about the mechanisms of cross-
talk between the two pathways. Studying signals that are transmitted in
parallel gives us new insights about how pathways and signals interact in a
dynamical way, e.g., whether they amplify, inhibit, delay or accelerate each
other.
Abbreviations
PP, double phosphorylated; FREP, filamentation response element product; K, kinase; MAP, mitogen activated protein; PREP, pheromone
response element product.
3520 FEBS Journal 273 (2006) 3520–3533 ª 2006 The Authors Journal compilation ª 2006 FEBS
other, a phenomenon often called crosstalk. Many dif-
ferent ways of pathway interactions have been des-
cribed in the literature [1–3]. An important question in
cell biology is how these systems transduce different
extracellular stimuli to produce appropriate responses
despite or in exploitation of pathway interactions.
There have been attempts to quantify crosstalk in
signalling networks. In one study crosstalk was categ-
orized by a classification of the input-output relations
of signalling networks [4]. Quantification consisted of
counting the occurrence of each category in a pairwise
comparison of pathways. Another study quantified the
degree of crosstalk between two pathways by relating
the number of realized interactions between two path-
ways to the number of hypothetically possible interac-
tions [5]. This definition was restricted to pathways
that do not share components. Both studies considered
topological and structural properties of signalling net-
works and did not account for temporal and dynamic
aspects. Another study analysed the steady state prop-
erties of two simple dynamic three-step kinase cascades
with a shared component and concluded that with the
proposed wiring scheme selective activation was poss-
ible without physical separation of the two cascades
[6]. However, an analysis of the temporal behaviour of
the two cascades shows that both pathways will always
be activated even though not at the same time but
subsequently. Thus, in order to understand crosstalk
mechanisms, the dynamic behaviour of interacting
pathways is important, even more because it is the
transient dynamic behaviour that is important in sig-
nalling rather than the static or steady state features.
A recent study addressed this problem proposing meas-
ures of dynamic crosstalk [7]. By analysing the activation
of pathways by the intrinsic and an extrinsic stimulus,
respectively, they defined measures for pathway specificity
and fidelity. These measures give useful insights into how
pathways interact with each other. However, it is import-
ant to note that these measures refer to responses to one
stimulus at a time. These measures give no clue of how
signals interact while being transmitted concomitantly.
It can be expected that signals amplify or inhibit each
other, when transmitted at the same time. Thus, to under-
stand how signals interact dynamically it does not suffice
to study each signal in isolation but also to study the
cell’s response to multiple stimuli at the same time.
The aim of this study was twofold. First, we wanted
to map existing literature to a mathematical model to
study the dynamic behaviour of two experimentally
well characterized pathways and their interactions, i.e.,
the pheromone and filamentous growth pathway in
bakers yeast. Second, we wanted to analyse and com-
pare measures of dynamic crosstalk.
The mathematical model described here has been
submitted to the Online Cellular Systems Modelling
Database and can be accessed free of charge at http://
jjj.biochem.sun.ac.za/database/schaber/index.html.
Discussion
We developed a dynamic mathematical model that rep-
resents current knowledge about the wiring of the
pheromone pathway and the filamentous growth path-
way in yeast. We concentrated on the main dynamic
features and the interconnections between the two
pathways and on a limited temporal scope. Moreover,
we defined new measures of dynamic crosstalk, ana-
lysed their relations and conducted simulation studies
to explore the contributions of several pathway inter-
actions to crosstalk. As the kinetics of the considered
reactions are largely unknown, our results must be
viewed with respect to the chosen set of parameters.
However, the important dynamic features of the model
resembled what is known from experiments and were
robust to single parameter perturbation (Fig. 3).
We defined new measures of crosstalk, i.e., intrinsic
specificity S
i
and extrinsic specificity S
e
that yield a
better understanding of how the two pathways dynam-
ically interact because they consider the combined res-
ponse of several signals. Crosstalk, in our view, is not
something that cells must avoid but rather it is indis-
pensable in order to trigger the appropriate response
to multiple simultaneous stimuli. Thus, it is instructive
to analyse signal transduction of several pathways in
parallel, because this is what the cell has to face.
The new crosstalk measures characterize how the
cells integrate different signals when being transmitted
concomitantly. Concerning the pheromone response,
they indicate that both signals amplify each other. This
result could already be anticipated from the wiring
scheme of the pathways, because it contains no direct
inhibition of the pheromone pathway by the filamen-
tous growth pathway. In the case of the filamentous
growth pathway, however, we saw a crossinhibition by
the pheromone pathway. This result was not clear just
by studying the wiring scheme, because we considered
several promoting and inhibiting influences of the
pheromone pathway on the filamentous growth path-
way, whose overall effect is not obvious. Our new
crosstalk measures complement already existing cross-
talk measures and give additional information by a
single number that integrates complex time courses in
a conceivable and interpretable way. However, it must
be stressed that our proposed interpretations of the
new crosstalk measures only mirror a phenomenologi-
cal description of the considered outputs. If the wiring
J. Schaber et al. Modelling dynamic crosstalk in cell signalling
FEBS Journal 273 (2006) 3520–3533 ª 2006 The Authors Journal compilation ª 2006 FEBS 3521
scheme is not known, these measures do not allow
deriving conclusions about actual molecular interac-
tions. Sensitivity analysis indicated that the new cross-
talk measures are more stable than the other crosstalk
measures, probably because by integrating both inputs
they mutually buffer sensitivities of the other pathway.
For the pheromone pathway the Komarova-specific-
ity S
K
is less than one, meaning that the pheromone
stimulus activates its extrinsic response stronger than
its intrinsic response. This result is not intuitive. It
exemplifies that activation profiles of different compo-
nents can hardly be compared because in the model
these depend strongly on the parameters, and biologic-
ally an access of component A over component B does
not necessarily mean that component A has a stronger
impact than component B.
In experimental and theoretical studies, the crosstalk
measures C (or F), S
i
and S
e
(Table 1) can relate the
activation profile of one specific component to differ-
ent stimuli and allow drawing a conclusion about how
pathways interact in a dynamical way and how signals
are thereby modulated.
The newly proposed crosstalk measures S
i
and S
e
can be generalized to more than two interacting path-
ways. Suppose we have n stimuli f
1
, , f
n
correspond-
ing to n intrinsic responses X
1
, , X
n
. The intrinsic
specificity of pathway k, S
i
(k), i.e., a measure of how
extrinsic signals influences the intrinsic signals when
acting in parallel, can be defined as
S
i
ðkÞ¼
Xðf
k
Þ
Xðf
1
; ; f
n
Þ
and the extrinsic specificity of pathway k, S
e
(k), i.e., a
measure of how the intrinsic signal influences the
extrinsic signals when transmitted in parallel, can be
defined as
S
e
ðkÞ¼
Xðf
1
; ; f
kÀ1
; f
kþ1
; ; f
n
Þ
Xðf
1
; ; f
n
Þ
From the Monte Carlo analysis we conclude that it is
most instructive to use the time integral I as a measure
for activation. First, the integral is biologically mean-
ingful, because it represents the total amount of activa-
ted species, which were produced during the presence
of a stimulus. It virtually combines both amplitude
and time of a response. Second, it was correlated to
the maximal concentration, thus the maximal concen-
tration did not give much additional information in
our model. Moreover, the integral is also more easily
computed than the maximum as there are not pitfalls
like local maxima, and it was in our cases more intuit-
ive. In terms of signal timing we found the time of
reaching the first maximum more useful than the sig-
nalling time s as it gave a good measure of how fast a
first significant response was, rather than the time of
an average response.
In the literature we could not find experiments
where a pheromone stimulus and a starvation stimulus
were applied in parallel, although from our viewpoint
this would be an interesting experiment concerning
crosstalk. A prediction of our model for the phenotype
that would result from such an experiment is not poss-
ible, because the model was not built for such a pur-
pose. Specifically, we disregarded the Ras-dependent
activation of the filamentous growth pathway, and
additionally, most described effects depend on
unknown parameters. Moreover, in our model the
pheromone response will always be transient, irrespect-
ive of the length of the pheromone stimulus, because
activated Ste11 is degraded without being newly syn-
thesized (Fig. 4). Nevertheless, it would be informative
to test experimentally several features that are predic-
ted by the model. On the one hand, the model predicts
that a pheromone stimulus inhibits at least transiently
the starvation-induced activation of Kss1 and FREP.
On the other hand, a starvation stimulus is anticipated
to amplify Fus3 activation by a pheromone stimulus.
Moreover, we identified leakage of activated Ste11 as
the most influential source of crosstalk. Crosstalk of
activated Ste11 was stronger than crossinhibition by
degradation of Ste12 ⁄ Tec1 induced by activated Fus3.
The model also predicts that activating both pathways
at the same time results in amplification of the phero-
mone response and inhibition of the filamentous
growth response compared to a single stimulus, indica-
ting that the pheromone response is in this case the
dominant factor. In an experiment where cells are first
starved until a certain level of activated Kss1 is
reached and then a pheromone stimulus is applied, the
model predicts a lower pheromone response and a
weakened inhibitory effect of the pheromone pathway
on the filamentous growth response compared to the
effects caused by application of both stimuli at the
same time. This result depends of course on the chosen
set of parameters, but exemplifies how such a study
can lead to new hypotheses about the relative contri-
bution of distinct mechanisms to overall crosstalk. In
the model no cell cycle-dependent processes are consid-
ered and to test the model predictions by experiments
we recommend using synchronized cells, e.g., by coun-
ter-flow centrifugal elutriation [39].
We strongly believe that if we want to understand
how pathways interact and crosstalk dynamically,
measurements of pathway activation with both path-
ways being active are indispensable.
Modelling dynamic crosstalk in cell signalling J. Schaber et al.
3522 FEBS Journal 273 (2006) 3520–3533 ª 2006 The Authors Journal compilation ª 2006 FEBS
Model development and simulations
The pheromone and the filamentous growth
pathway
In this study we employ mathematical modelling techniques
to analyse dynamic mechanisms and measures of crosstalk.
We illustrate our approach by giving an example of two
signalling pathways in the budding yeast Saccharomyces
cerevisiae, i.e., the mating response, initiated by pheromone,
and the filamentous growth response, triggered by glucose
starvation or nitrogen depletion [8–10].
Budding yeast may be present in one of two haploid cell
types that are able to mate. Pheromones released by one
type bind to a receptor of the respective other type. The
receptor activates a heterotrimeric G protein that transmits
the signal from the cell surface to intracellular effectors
with the help of the membrane-associated protein Ste20
[11,12]. Elements of the signal transduction are the activa-
tion of a scaffold protein-bound mitogen activated protein
(MAP) kinase (K) cascade consisting of the scaffold pro-
tein Ste5, the MAPKKK Ste11, the MAPKK Ste7 and the
MAPK Fus3, and the phosphorylation and activation of
nuclear proteins controlling cell polarity, transcription and
progression through the cell cycle [2,13,14]. The signal
transduction prepares the cell for fusion with the mating
partner. Gene transcription is necessary to produce pro-
teins involved in processes like cell fusion and in the signal-
ling cascade. In the following, these proteins are called
pheromone response element products (PREPs). Their tran-
scription is regulated by the transcriptional activator Ste12
and its repressors Dig1 ⁄ Rst1 and Dig2 ⁄ Rst2 [15–19]
(Fig. 1).
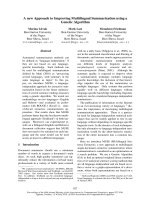
Bakers yeast is a fungus that occurs in distinct morpholo-
gies in response to different stimuli. In haploid cells, the
switch from normal growth to so-called invasive or filamen-
tous growth leads to enhanced cell–cell adhesion and agar
penetration. The stimuli causing this change in cell shape
are, for example, glucose depletion, alcohols or low levels
of pheromone [20]. The signalling pathway of filamentous
growth consists of two branches, the cAMP branch and a
MAPK branch. Here, only the latter is regarded. Like in
the pheromone pathway, a receptor activates a G protein,
which is competent to initiate a MAP kinase cascade via
Ste20. That cascade consists of the MAPKKK Ste11, the
MAPKK Ste7 and the MAPK Kss1. Double phosphorylat-
ed Kss1 (Kss1PP) is able to shuttle into the nucleus and
influence filamentous growth-intrinsic genes regulated by
the transcription factors Ste12 and Tec1 and the repressors
Dig1 ⁄ Rst1 and Dig2 ⁄ Rst2. The produced proteins are
called filamentation response element products (FREPs) in
the following (Fig. 1).
There are several ways in which the two roughly presen-
ted pathways can crosstalk or communicate with each other
that can both complement and counteract each other. We
will consider those for which there is strong evidence and
we find most important:
l
It has been shown that pheromone activated Ste11 can
leak out from the scaffold complex and can activate the fil-
amentous growth cascade [21]. This can result in a crossac-
tivation. In the same paper it is demonstrated that the
invasive growth pathway can also leak into the mating
pathway. However, activation of Fus3 by the filamentous
growth pathway is weak and therefore neglected in the fol-
lowing.
l
The scaffold complex of the pheromone pathway can
activate both Fus3 and Kss1, potentially activating both
the mating and the filamentation response [22–27]. How-
ever, the amount of phosphorylated Kss1 is attenuated by
double phosphorylated Fus3 (Fus3PP) [25]. This way, an
activation of the filamentous growth response by a phero-
mone stimulus is reduced. The mechanism causing this pro-
cess is still unknown, but it seems to be necessary that
Fus3PP exceeds a certain threshold concentration to regu-
late the level of Kss1PP [25].
l
In the pheromone pathway, Ste11 that is activated and
released from the scaffold is unstable and rapidly degraded
by an ubiquitin-dependent mechanism. Activated Fus3 may
promote this through feedback phosphorylations. Thus, the
possibility of an activation of other pathways by activated
Ste11 is decreased [28,29], but still detectable [21].
l
Phosphorylated Kss1 is able to phosphorylate Ste12, but
to a lower extent than Fus3PP [30] resulting in the potential
crossactivation of PREPs by the filamentous growth path-
way [26,27].
l
Fus3PP induces Tec1 ubiquitination and degradation
[25,30–32] and thereby reduces crossactivation of filamentous
growth response by pheromone activated Kss1.
sue
lc
un
noitavratS
rosneS
losoty
c
enomorehP
02etS
Gα G
βγ
5etS
11etS
7etS
3su
F
02etS
11etS
7etS
1
ssK
21etS
2/1giD
21etS
21etS
2/1giD
1ceT
rotpeceR
noit
a
mroF
xel
p
m
oC
n
oiti
b
i
hn
In
oita
vitcA
enarbmem
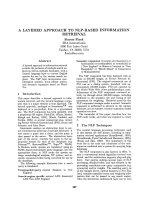
Fig. 1. Schematic overview of the pheromone (left) and the fila-
mentous growth pathway (right) depicting pathway interactions.
Components may have a promoting or inhibiting influence, depend-
ing on their activation state.
J. Schaber et al. Modelling dynamic crosstalk in cell signalling
FEBS Journal 273 (2006) 3520–3533 ª 2006 The Authors Journal compilation ª 2006 FEBS 3523
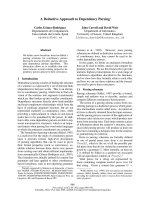
Definition of crosstalk measures
We assume that a signalling pathway has certain targets it
activates and that each target can be assigned a specific or
intrinsic stimulus and signal, whose major target it is, and
nonspecific or extrinsic stimuli and signals, whose minor
target it is (Fig. 2). This leads to an intuitive first descrip-
tion of the term crosstalk, i.e., the activation of a certain
pathway component by an extrinsic stimulus. We define
crosstalk C of the considered pathway with another path-
way as the activation of a pathway component by the
extrinsic stimulus e relative to the activation by the intrinsic
stimulus i, i.e.,
C ¼
XðeÞ
XðiÞ
where X(e) and X(i) denote some activation measures of
the considered pathway by stimulus e and i, respectively
(Fig. 2, for definition of activation measures see below).
This definition is the reciprocal of the pathway fidelity
introduced by Komarova et al. [7]. Given the intuitive
understanding that the activation by the extrinsic signal
X(e) is smaller than the activation by the intrinsic signal
X(i), this results in a measure between zero and one for no
and strong crosstalk, respectively. Of course, we can also
get C > 1, meaning that the activation by the extrinsic sig-
nal is stronger than the activation by the intrinsic signal.
As stated above, cells may be subjected to multiple stim-
uli at a time that can call for conflicting responses. In this
case, the cell has to combine signals to trigger the appropri-
ate response. Therefore, we introduce the two new meas-
ures, i.e., the intrinsic specificity S
i
and the extrinsic
specificity S
e
.
We define intrinsic specificity S
i
as the activation of the
target of the considered pathway by the intrinsic stimulus i
relative to the activation by both stimuli i and e, i.e.,
S
i
¼
XðiÞ
Xði; eÞ
where X(i,e) is the pathway activation when both stimuli
are present (Fig. 2). The intrinsic specificity is a measure of
how the intrinsic signal is influenced by the extrinsic signal
when both are transmitted concomitantly. S
i
< 1 means
that the combined signal of i and e yields a stronger
response than the intrinsic signal alone, and indicates that
the extrinsic signal amplifies the intrinsic signal when both
are transduced, i.e., it points to crossactivation. The smaller
S
i
, the stronger is the amplification by extrinsic signals and,
thus, the less is the specificity of activation concerning the
intrinsic signal. In cases where S
i
> 1, the activation by the
intrinsic signal is stronger than the integrated response and
indicates that when both signals are transmitted the extrin-
sic signal inhibits the intrinsic signal, which can be called a
crossinhibition. The greater S
i
, the stronger is the inhibition
by the extrinsic signal and, thus, the pathway is activated
more specifically by the intrinsic signal alone.
We can also define a measure of how the extrinsic signal
is affected by the intrinsic signal, when both are transmit-
ted, i.e., the extrinsic specificity S
e
:
S
e
¼
XðeÞ
Xði; eÞ:
If S
e
> 1, we encounter a situation where both signals
together produce a smaller activation than the extrinsic sig-
nal alone. This indicates that the intrinsic signal inhibits the
extrinsic signal, i.e., there is a crossinhibition. The larger
the value of S
e
the stronger the inhibition by the intrinsic
signal and, thus, the more specific the pathway is activated
by an extrinsic signal alone. A value of S
e
< 1 hints to a
situation where the intrinsic signal amplifies the extrinsic
signal. The lower S
e
the less specific is the pathway activa-
tion in relation to an extrinsic signal. A number close to
zero shows a dominance of the intrinsic signal over the
extrinsic signal or a weak crossactivation, and a number
close to one shows a dominance of the extrinsic signal over
the intrinsic signal, i.e., a strong crossactivation.
Table 1 gives an overview of these measures and pro-
posed interpretations of their respective values. Both meas-
ures of crosstalk should always be considered in parallel.
Table 2 lists how the combinations of both crosstalk meas-
ures can be interpreted.
The definitions above only consider activation measures
explicitly and not the input stimuli. These activation meas-
ures relate to time series of protein activation profiles
X(α =) f T(
α
R|)t(
α
R,no=
β
)ffo=
X(β =) f T(
α
R|)t(
α
R,ffo=
β
)no=
X(α, β =) f T(
α
R|)t(
α
R,no=
β
)no=
sulumitS α sulumitS β
rofrotpeceR α R,
α
rofrotpeceR β R,
β
roftegraT α T,
α
roftegraT β T,
β
cisnirtni
langis
cisnirtxe
langis
Fig. 2. (Upper) Illustration of the definition of intrinsic and extrinsic
signal. The stimulus a is recognized by a specific receptor R
a
,
which transduces a signal to a specific (intrinsic) target T
a
. The sti-
mulus b is recognized by a specific receptor R
b
, which transduces
a signal to a specific (intrinsic) target T
b
but can also transduce a
signal to T
a
, to which it is defined as an extrinsic signal. (Lower)
Activation X of T
a
is a function f of the time course of T
a
, given a
certain combination of present stimuli. The function f can be the
integral or the maximal concentration, for instance.
Modelling dynamic crosstalk in cell signalling J. Schaber et al.
3524 FEBS Journal 273 (2006) 3520–3533 ª 2006 The Authors Journal compilation ª 2006 FEBS
obtained by western blot analysis or time series of mRNA
expression profiles obtained by microarrays, for example.
These profiles are much easier to compare between path-
ways than input stimuli, like, for instance, a pheromone
and a starvation stimulus, simply because they have the
same units. It is not clear what would be the strength of a
pheromone stimulus compared to a starvation stimulus,
whereas the activation of a kinase or gene expression
under two different conditions can be much better com-
pared. Obviously, the measure of activation of a pathway
by a single stimulus, like X(i), and to several stimuli, like
X(i,e), can only be obtained by distinct time series experi-
ments. In order to calculate the crosstalk measures the
readouts from both experiments must be comparable, not
only by using, in this case, the same input stimulus i in
both experiments, but also by relating the readout in a
quantitative way. In the case of western blots this can be
achieved by blotting the protein activation time series of
both experiments on the same gel. In the case of micro-
arrays the signal values must be comparable not only
between time points for one experimental condition, but
also between experimental conditions by appropriate nor-
malization techniques.
The mathematical model
The balance between two opposing goals guided the mathe-
matical model development, i.e., to be as comprehensive
and yet as parsimonious as possible. Including as many
components as possible makes the model more realistic but
at the same time more difficult to analyse and comprehend.
Moreover, almost all parameters and kinetic constants are
unknown and thus, augmenting the model also increases its
arbitrariness. Therefore, we included only those compo-
nents that are involved in crosstalk and the most important
dynamic processes, so that the typically observed dynamic
behaviour could be captured (Figs 3 and 4). We omitted,
e.g., the MAPKK Ste7 because it is not yet clear whether it
is involved in crosstalk, and for the dynamics we consider
here it is negligible. We also omitted the G protein cycle
for the sake of simplicity, and we consider phosphorylation
reactions to be irreversible. Moreover, we only consider the
cell response up to a time point where the first proteins are
being synthesized, and neglect all processes that are import-
ant for morphological changes. We also assume that within
this time frame degraded Ste11 is lost from the system and
is not resynthesized. We therefore run the simulations only
until a time point of six hours. For a more detailed model
of the pheromone pathway see Kofahl and Klipp [33] and a
diagram of such a comprehensive combined model is
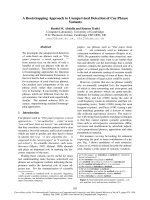
depicted in the supplementary material. In the following,
the concentration of compounds and reactions will be num-
bered with a preceding ‘c’or‘v’, respectively (Fig. 3).
The scaffold protein Ste5 (c
1
) and the MAPKKK Ste11
(c
2
) reversibly form a complex (c
3
, reactions v
1
and v
27
)
that is able to bind to Gbc (c
4
) after a pheromone stimu-
lus a (reaction v
2
). The complex Gbc–Ste5–Ste11 (c
5
)
binds the MAPK Fus3 (c
6
) or Kss1 (c
12
) (reactions v
3
and
v
9
, respectively). The phosphorylation events of the
MAPK cascade are lumped into one step (reactions v
4
and v
10
, respectively) resulting in the activated complexes
c
8
and c
14
. The phosphorylated MAPKs Fus3PP (c
9
) and
Kss1PP (c
15
) are able to dissociate from the scaffold pro-
tein (reactions v
5
and v
11
), which still forms a complex
Table 1. Crosstalk measures and their interpretations. X(i), X(e)andX(i,e) are measures for the activation of pathway X by the intrinsic, the
extrinsic and both stimuli, respectively. C pathway crosstalk, S
i
intrinsic specificity, S
e
extrinsic specificity.
Crosstalk measure Values Interpretation
C ¼
X ðeÞ
X ðiÞ
0 No crosstalk
< 1 Crosstalk, extrinsic activation weaker than intrinsic activation
> 1 Crosstalk, extrinsic activation stronger than intrinsic activation
S
e
¼
X ðeÞ
X ði;eÞ
0 No crosstalk
< 1 Crossactivation, intrinsic signal amplifies extrinsic signal, low specificity to extrinsic signal
> 1 Crossinhibition, intrinsic signal inhibits extrinsic signal, high specificity to extrinsic signal
S
i
¼
X ðiÞ
X ði;eÞ
< 1 Crossactivcation, extrinsic signal amplifies intrinsic signal, low specificity to intrinsic signal
> 1 Crossinhibition, extrinsic signal inhibits intrinsic signal, high specificity to intrinsic signal
Table 2. Combinations of crosstalk measures and their interpretations. X(e), X(i)andX(i,e) are measures for the activation of pathway X by
the extrinsic, the intrinsic and both input signals, respectively. S
i
, intrinsic specificity, S
e
extrinsic specificity.
X(e)>X(i,e)
S
e
>1
X(e)<X(i,e)
S
e
<1
X(i)>X(i,e) S
i
> 1 Mutual signal inhibition Intrinsic signal dominance
X(i)<X(i,e) S
i
< 1 Extrinsic signal dominance Mutual signal amplification
J. Schaber et al. Modelling dynamic crosstalk in cell signalling
FEBS Journal 273 (2006) 3520–3533 ª 2006 The Authors Journal compilation ª 2006 FEBS 3525
with the other components (c
10
), allowing further binding
of unphosphorylated MAPKs and release of phosphorylat-
ed MAPK molecules (reactions v
6
and v
12
). The complex
c
10
can decompose into Gbc (c
4
), Ste5 (c
1
) and ubiquiti-
nated activated Ste11 (Ste11PPP
ubi
, c
11
) (reaction v
7
).
Ste11PPP
ubi
in conjunction with activated Ste11
(Ste11PPP) can phosphorylate Kss1, resembling leakage of
activated Ste11 into the filamentous growth pathway. The
phosphorylated MAPKs become dephosphorylated (reac-
tions v
16
and v
26
). Fus3PP enhances the dephosphorylation
of Kss1PP (v
16
).
Even though the processes involving the transcription
factors take place in the nucleus we do not explicitly model
different reaction compartments or transport processes. The
transcriptional activator Ste12 is able to form homodimers
(c
18
) or heterodimers with Tec1 (c
22
). Both dimers can
reversibly bind to Kss1 (reactions v
17
and v
18
; v
21
and v
22
,
respectively). Kss1PP can activate c
18
and c
22
(reactions v
19
and v
23
). The active form of Fus3 exerts different influences
on the transcription factors. While Fus3PP activates c
18
(reaction v
19
), it induces degradation of Tec1 (reaction v
24
).
The active forms of Ste12 ⁄ Ste12 and Ste12 ⁄ Tec1 (c
19
and
c
23
) activate gene expression of target genes (reactions v
20
and v
25
).
In response to a stimulus that activates the filamentous
growth pathway by a hitherto not completely identified
molecular mechanism, here named b, the MAPKKK Ste11
(c
2
) is activated (reaction v
13
) and Ste11PPP ( c
16
) is pro-
duced. Ste11PPP can be deactivated (reaction v
14
) and ⁄ or
activates Kss1 (c
12
) (reaction v
15
). Kss1PP generated by this
signalling pathway acts like Kss1PP produced by the phero-
mone response pathway.
There are some processes enabling crosstalk correspond-
ing to the processes described above:
l
Ste11PPP phosphorylated in the pheromone pathway
(Ste11PPP
ubi
) can also phosphorylate Kss1 unbound to
(enomorehP α)
(noitavratS β)
v
4
v
01
c
01
c
1
1
G γ
β
c
9
11etS
v
6
v
5
v
1
1
v
2
1
v
7
v
62
v
61
1ssK
c
5
1
1
s
sK
1s
sK
v
81
PERP
P
ERF
losotyc
suelcun
v
8
1ssK1ssK
2
1etS
21etS
2
1etS
21etS
PP
1ssK
P
P
P
11e
t
S
PP P
11etS
ibU
21etS
1
ceT
1ssK
21etS 1ceT
21etS 21etS
P
21etS 1ceT
P
PP
1
ssK
P
P
3suF
1
1etS
11etS
5etS
G γβ
11et
S
5
e
t
S
1ssK 3suF
G γ
β
11e
tS
5
e
tS
3
s
uF
G γ
β
11
et
S
5
e
t
S
1
s
sK
G γ
β
1
1
et
S
5
e
t
S
1ssK
P
G γβ
11
etS
5
etS
3s
u
F
P
G γβ
11
e
tS
5etS
P
PP
1
ssK
1ssK 3su
F
5etS
G γβ
5etS
PP P
1
1etS
i
bU
PP
1
ssK
c
41
c
8
c
31
c
7
v
9
v
3
c
4
c
3
c
5
c
21
c
6
v
2
c
1
c
2
v
1
v
72
v
31
v
41
v
51
v
6
1
c
61
c
21
c
6
c
51
c
4
c
1
c
2
c
5
1
c
11
c
21
c
71
c
81
c
21
c
51
c
91
c
02
c
12
c
22
c
32
c
42
v
7
1
v
91
v
82
v
02
v
92
v
13
v
52
v
03
v
3
2
v
42
v
2
2
v
12
PP
3suF
c
9
1ssK
c
21
Fig. 3. Graphical representation of the mathematical model including all components and reactions considered (for a mathematical represen-
tation as a set of ordinary differential equations refer to the supplementary material). Proteins and reactions are annotated by their model
name. The distinction between cytosol and nucleus is only depicted for illustrative reason and is not reflected in the model. Solid arrows indi-
cate conversions whereas dotted arrows indicate promoting influences on the respective reaction.
Modelling dynamic crosstalk in cell signalling J. Schaber et al.
3526 FEBS Journal 273 (2006) 3520–3533 ª 2006 The Authors Journal compilation ª 2006 FEBS
Ste5 and, thus, leaks from the pheromone pathway and
enters the filamentous growth pathway (reaction v
15
).
l
Both pathways activate Kss1. However, Fus3PP pro-
motes Kss1PP dephosphorylation and thereby reduces
crossactivation (reaction v
16
).
l
Ste11PPP is degraded as Ste11PPP
ubi
(reaction v
8
).
l
On the one hand, Kss1PP activates both Ste12 ⁄ Ste12 and
Ste12 ⁄ Tec1 (reactions v
19
ad v
23
), however, activation of the
former is not as potent as activation of the latter. On the
other hand, Kss1 binds to both Ste12 ⁄ Ste12 and Ste12 ⁄
Tec1 and thereby inhibits their activation.
l
Fus3PP induces degradation of Tec1 (reaction v
24
) inhib-
iting crossactivation.
For a listing of the model equations and parameters refer
to the Supplementary material.
As little was known about the kinetic parameters they
were all set to unity in a first step. Systematic parameter fit-
ting like in other models of yeast signalling [34] was not
feasible because of lack of data. In order to map the
dynamic model behaviour to what is known from the few
available experiments (see below), some parameter adjust-
ments were made. Qualitative information that was avail-
able about the relation of certain reaction velocities was
incorporated into the model by increasing or decreasing
kinetic parameters by a factor of 10 (see remarks to the
model parameters in the Supplementary material). Due to
the lack of knowledge about the kinetics all reactions were
modelled as either first or second order mass action kinet-
ics. Initial values for the concentrations were derived
from Yeast GFP Fusion Localization Database (http://
yeastgfp.ucsf.edu [35], Table S1). The model was implemen-
ted in mathematica 5.1Ò (www.wolfram.com), and can be
downloaded as an SBML file from the journal website.
It must be noted that diploid cells lack a receptor for
pheromone and, thus, the pheromone pathway is not
responsive in diploid cells. The filamentous growth path-
way, however, is responsive in diploid cells, even though
the phenotype upon starvation is different. Therefore, there
is no crosstalk between the two pathways in diploid cells
and the model works only for haploid cells. Nevertheless,
the model for the filamentous growth pathway can also be
used for diploid cells.
Dynamic model behaviour
The dynamic behaviour of the model was tested by a qual-
itative comparison of the model results to available data.
Three so-called standard runs were employed: (a) only
application of a factor, (b) only application of b stimulus,
and (c) application of both stimuli. The application of a
factor was modelled by a smoothened step function of
10 min duration resembling receptor activation and subse-
quent deactivation by receptor internalization and other
0 100 200 300 400 500
1
2
3
4
5
PREPs
0 100 200 300 400 500
2
4
6
8
10
12
FREPs
α & β
β
α
0 100 200 300 400 500
10
20
30
40
50
Fus3PP
0 100 200 300 400 500
10
20
30
40
50
60
Kss1PP
0 100 200 300 400 500
0.2
0.4
0.6
0.8
1.
α stimulus
0 100 200 300 400 500
0.2
0.4
0.6
0.8
1.
β stimulus
t [min]
t [min]
C(t)
C(t)
C(t) [nM]
C(t) [nM] C(t) [nM]
C(t) [nM]
α & β
β
α
α & β
β
α
α & β
β
α
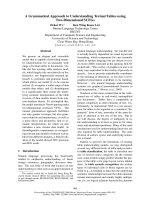
Fig. 4. Concentration profiles of pathway
output components. Fus3PP and PREPs are
the main targets of the pheromone path-
ways whereas Kss1PP and FREPs are the
main targets of the filamentous growth
pathway. For each component, the time
curves are displayed for the case that only
pheromone is present (a), that only a starva-
tion signal is present (b) or that both are act-
ive (a & b).
J. Schaber et al. Modelling dynamic crosstalk in cell signalling
FEBS Journal 273 (2006) 3520–3533 ª 2006 The Authors Journal compilation ª 2006 FEBS 3527
negative feedbacks. The b stimulation was modelled as a
smoothened step function of 6 h duration because starva-
tion was supposed to act on a larger time scale than a fac-
tor treatment. The simulation time was 12 h (Fig. 4).
Figure 4 displays the simulated temporal concentration
profiles of a and b stimulus, Fus3PP, Kss1PP, PREPs and
FREPs for the three standard runs. As can already be
deduced from the model structure, activated Fus3 can only
be produced by a pheromone stimulus and not by a starva-
tion signal. When both pathways are activated less Ste11 is
available for the pheromone pathway, therefore the concen-
tration of Fus3PP decreases. Nevertheless, PREP produc-
tion is slightly stronger and lasts longer when both signals
are active. This is due to the combined activation of
Fus3PP and Kss1PP on the PREPs and less Ste12 inhibi-
tion by nonactivated Kss1 (complex c
17
). The temporal pro-
file of Fus3PP follows well the experimental evidence where
a peak of activated Fus3 was observed after 20 min and a
decay to half of the maximal concentrations was seen after
90 min [25,28]. Fus3PP and Kss1PP show similar dynamics
upon a pheromone stimulus as has also been shown in
experiments [25]. Kss1 becomes rapidly activated by all
stimuli but to a different extent. While the response to star-
vation is strongest and follows the time course of the stimu-
lus, the response to pheromone is weaker and more
transient, which is in accordance with experimental data
[25]. The response to both stimuli is of intermediate
strength and duration. The PREPs time course upon a sti-
mulus has the same shape as the Fus3PP time course. In
experiments, a longer activation of mating response repor-
ter genes and mRNA was observed [25,36,37]. The PREPs
also become weakly activated upon a starvation stimulus
without pheromone signal. This was also observed in
experiments [25]. The activation profile of FREPs has the
same shape as the Kss1PP profiles.
Performance of crosstalk measures
In our example, activation of a pathway by an extrinsic sti-
mulus is defined as either the activation of the pheromone
response by a starvation stimulus or, vice versa, the activa-
tion of the filamentous growth response by a pheromone
stimulus. Activation is quantified by four different measures
derived from the time curves of PREPs and FREPs,
respectively, i.e., the time integral I, the first local maximum
M, the time of the first local maximum t
M
and signalling
time s [38]. For reasons of comparison we also calculated
the recently proposed measures of pathway specificity
(called Komarova-specificity S
K
in the following) and fidel-
ity F [7]. The calculated measures depicted in Tables 3 and
4 refer to the standard simulations described above (Fig. 4).
In Table 3 the crosstalk measures from the pheromone
pathway perspective are listed, i.e., the intrinsic stimulus is
a and the extrinsic stimulus is b. The time integral for the
intrinsic signal is smaller than for the extrinsic signal, which
is reflected by a crosstalk C > 1, indicating a stronger acti-
vation by the extrinsic signal than by the intrinsic signal.
This is counterintuitive. However, the integral has its lar-
gest value when both signals are transmitted at the same
time. The crosstalk measure extrinsic specificity S
e
tells us
that the combined signal is stronger than the extrinsic sig-
nal alone (S
e
< 1), indicating that the intrinsic signal
amplifies the extrinsic signal. This can also be seen in the
PREPs time curves of Fig. 4. The intrinsic specificity
S
i
< 1 also indicates a crossactivation, where this time the
extrinsic signal amplifies the intrinsic signal. Thus, we can
hypothesize a mutual crossactivation of both signals
(Table 2). Pathway fidelity F < 1 again shows that the
pathway is activated more strongly by its extrinsic stimulus
than by the intrinsic stimulus. The Komarova-specificity for
the integral is smaller than one. Following the interpreta-
tion of Komarova et al. [7], this means that in our model
the pheromone stimulus promotes the FREP activation
more than its own output.
The crosstalk measures for the maximal concentration of
a component give a different picture. Here, the crosstalk C
is lower than one and accordingly the pathway fidelity F is
Table 3. Crosstalk measures for the pheromone pathway (PREPs).
Here a is the intrinsic signal whereas b is the extrinsic signal. X(a),
X(b) and X(a,b) are the respective activation measures by the
pheromone (intrinsic) signal, the filamentation (extrinsic) signal and
both. C, S
i
, S
e
are the crosstalk measures for crosstalk, intrinsic
and extrinsic specificity, respectively, as described in the text and
in Table 1. F is the pathway fidelity, the reciprocal of C, and S
K
¼
X(a) ⁄ Y(a) is the pathway specificity, where Y(a) is the activation of
the target of filamentous growth pathway by the pheromone signal.
The latter two quantities were defined in Komarova et al. [7].
XX(a) X(b) X(a,b) CS
e
S
i
FS
K
Integral 174.9 231.6 423.9 1.32 0.5 0.4 0.7 0.5
Maximum 3.8 0.6 5.2 0.1 0.1 0.7 6.6 0.9
t
M
23.6 359.2 22.8 15.2 15.7 1.0 0.1 1.2
s 42.7 217.5 98.0 5.1 2.2 0.4 0.2 0.7
Table 4. Crosstalk measures for the filamentous growth pathway
(FREPs). Here b is the intrinsic signal whereas a is the extrinsic sig-
nal. X(a), X(b) and X(a,b) are the respective activation measures by
the pheromone (extrinsic) signal, the filamentation (intrinsic) signal
and both. C, S
i
, S
e
are the crosstalk measures for crosstalk, intrin-
sic and extrinsic specificity, respectively, as described in the text
and in Table 1. F is the pathway fidelity, the reciprocal of C,and
S
K
¼ X(b) ⁄ Y(b) is the pathway specificity, where Y(b) is the activa-
tion of the pheromone pathway by a starvation signal. The latter
two quantities were defined in Komarova et al. [7].
XX(a) X(b) X(a,b) CS
e
S
i
FS
K
Integral 324.3 6141.2 4393.4 0.1 0.1 1.4 18.9 26.5
Maximum 4.3 13.0 9.6 0.3 0.4 1.4 3.0 22.7
t
M
20.2 352.8 11.7 0.1 1.7 30.2 17.5 1.0
s 60.4 244.7 240.4 0.2 0.3 1.0 4.1 1.1
Modelling dynamic crosstalk in cell signalling J. Schaber et al.
3528 FEBS Journal 273 (2006) 3520–3533 ª 2006 The Authors Journal compilation ª 2006 FEBS
high. The extrinsic specificity S
e
and intrinsic specificity S
i
are both below one, indicating a situation of mutual cross
activation. The Komarova-specificity S
K
is also low. Note
that when considering maximum and integral the crosstalk
measures of Komarova et al. [7] come to opposing conclu-
sions, whereas our new crosstalk measures result in a con-
sistent interpretation.
Interpretation of the crosstalk measures concerning the
temporal measure t
M
again yields different conclusions. In
this case, C > 1 and F < 1 denote a delay of reaching the
maximal PREPs concentration when activated by its extrin-
sic signal. S
i
¼ 1 shows that the extrinsic signal does not
influence the timing of the response to the intrinsic signal,
but S
e
> 1 can be interpreted as an acceleration of the
combined signal compared to the extrinsic signal alone.
S
K
> 1 indicates that the pathway activates its extrinsic
output faster than its intrinsic output. This is also seen in
Fig. 4 where the maximal concentration of the FREPs is
reached faster than the maximal concentration of the
PREPs after a pheromone stimulus.
The signalling time s that can be interpreted as the time
of the mean activation [38], depicts larger values as t
M
.As
for t
M
, the intrinsic signal is faster than the extrinsic signal,
however, the timing of the combined signal is between the
intrinsic and the extrinsic signal, which results in S
i
<1.
S
K
< 1 means that the intrinsic output is activated faster
than its extrinsic output.
In Table 4 the crosstalk measures from the filamentous
growth pathway perspective are listed. All considered acti-
vation measures (I, M, t
M
, and s) are smaller for the extrin-
sic stimulus (a) than for the intrinsic stimulus (b). Contrary
to Table 3, the response to the combined signal is between
the intrinsic and the extrinsic response, except for t
M
.It
can be hypothesized that there is a weak crosstalk (C < 1).
From S
i
> 1 follows that the extrinsic signal inhibits the
intrinsic signal. This can also be seen in the FREPs time
curves in Fig. 4. However, the intrinsic signal dominates
the extrinsic signal when both are transmitted (S
i
> 1 and
S
e
< 0.5). Concerning t
M
, again the combined signal
results in an acceleration of both individual signals (S
i
>1,
S
e
> 1). Contrary to the effect observed for the pheromone
pathway the intrinsic signal exhibits slower dynamics than
the extrinsic signal (C < 1). The filamentous growth stimu-
lus exhibits in both pathways similar dynamics (S
K
¼ 1.1).
Sensitivity analysis
A sensitivity analysis gives an impression about how certain
properties of the model depend on the choice of parameter
values. A sensitive parameter, i.e., whose change has great
impact on a property of interest, indicates where measure-
ments should be made with care or where the model should
be refined. Especially, when parameters are unknown and
set arbitrarily, as in our case, a sensitivity analysis is indis-
pensable.
The model response was robust with respect to perturba-
tion of most parameters (for details see Supplementary
material). The sensitive parameters upon a pheromone sti-
mulus, i.e., those affecting Fus3PP and PREPs, were those
affecting the dephosphorylation and breakdown rates of
Fus3PP, PREPs and the scaffold complex c
10
(v
26
, v
29
, v
7
),
respectively, as well as the synthesis rates of the inactive
transcription complexes c
17
and c
18
(v
18
, v
28
). Regarding the
filamentous growth pathway, only the FREPs breakdown
rate was sensitive (v
31
) (Table S3). The fact that parameters
affecting dephosphorylation rates were sensitive indicates
an important role of phosphatases in pathway activation
and regulation.
Concerning the crosstalk measures, many more parame-
ters were sensitive, especially for C, F, and S
K
. The reac-
tions involved in Kss1 activation (v
15
, v
16
) and transcription
factor activation (v
19
, v
23
) were sensitive with respect to
many crosstalk measures. Notably, the crosstalk measures
involving only single stimulus activation measures (C, F,
S
K
) proved to be much more sensitive than our new activa-
tion measures (S
i
, S
e
). Only S
e
was sensitive in three
instances (Table S4).
Monte Carlo simulation
In addition to the parameter sensitivity of the model beha-
viour, we were interested in correlations between different
crosstalk and activation measures for varying parameters.
In the Monte Carlo study, we picked the values of 34 kin-
etic parameters randomly from an interval between a min-
imal (0.01) and a maximal value (10). For each random
parameter set we calculated the corresponding crosstalk
measures according to the employed activation measures as
in Tables 3 and 4. This was done 500 times. As a measure
of correlation we used the Spearman’s rank correlation
coefficient r
S
, because it is robust against outliers and can
also measure nonlinear correlations as long as they are
monotonous. While the normal correlation coefficient uses
the actual data values, the Spearman’s rank correlation is
based on the rank of the sorted data.
First, we calculated correlations between the different
activation measures for each crosstalk measure, respect-
ively. For all crosstalk measures there was a strong correla-
tion between the integral and the maximum (mean r
S
¼
0.9 ± 0.1) and a medium correlation between t
M
and s
(r
S
¼ 0.3 ± 0.2 and r
S
¼ 0.7 ± 0.0 for PREPs and FREPs,
respectively). The other activation measures were only
weakly correlated and the results were similar for PREPs
and FREPs (Table S2).
Then, we calculated correlations between the different
crosstalk measures for each activation measure, respect-
ively. Apart from the obvious nonlinear correlation between
C and F (the one is the reciprocal of the other), the correla-
tions differed considerably between activation measures,
PREPs and FREPs, and crosstalk measures (Table 5).
J. Schaber et al. Modelling dynamic crosstalk in cell signalling
FEBS Journal 273 (2006) 3520–3533 ª 2006 The Authors Journal compilation ª 2006 FEBS 3529
However, there were two strong correlations between
crosstalk measures irrespective of the employed activation
measure. This was the correlation between C and S
e
for the
PREPs and between C and S
i
for the FREPs (Fig. 5). Of
course, all measures that are correlated with C are also
correlated with F.
Considering the definitions of the crosstalk measures,
the strong correlation between C and S
e
for the PREPs
indicates that X(a) % X(a,b), meaning that the pheromone
response is almost equal to the combined response. This is
indeed the case as can be seen in Fig. 4. The strong recip-
rocal correlation between C and S
i
for the FREPs indi-
cates the same. Thus, in both pathways the pheromone
response seems to dominate the combined response inde-
pendently of the chosen parameter set. In the pheromone
pathway, the pheromone signal dominates because of the
small influence of the extrinsic (filamentous growth) signal
and in the filamentous growth pathway it dominates the
combined signal, because of its strong inhibitory role
(reaction v
16
and v
24
). Thus, our conclusion from the
standard run, that the filamentous growth response dom-
inates the combined response regardless of inhibition
(above), depends on the particular choice of parameters,
and in general the pheromone activation is similar to the
combined activation, i.e., X(a) % X(a,b) in the filamentous
growth pathway. However, in the filamentous growth
pathway it is mostly X(a)<X(a,b), i.e., S
e
< 1 (results
not shown).
Model simulations and predictions
One advantage of a mathematical model is its ability to eas-
ily conduct virtual experiments and generate predictions
addressing biological questions. This way it is, for instance,
possible to explore the contributions of different crosstalk
mechanisms to the overall response. From the perspective
of the filamentous growth pathway, we analyse the relative
contributions to crosstalk by (a) activation of Kss1 through
pheromone activated Ste11 (c
11
, reaction v
15
), by (b)
enhanced deactivation of Kss1PP through Fus3PP (reaction
v
16
), and by (c) degradation of Ste12 ⁄ Tec1 induced by
Fus3PP (reaction v
24
) by setting a single or several of the
corresponding parameters to zero (Table 6). The first pro-
cess can be regarded as a crossactivation whereas the latter
two are crossinhibitions instead. The results are displayed
in Table 6.
Not surprisingly, shutting off the leaking of activated
Ste11 from the pheromone pathway to the filamentous
growth pathway (simulation experiment 1) substantially
lowers extrinsic specificity (S
e
) compared to the standard
run. This is a sign of decreased crossactivation leading to
Table 5. Mean Spearman’s rank correlation coefficients r
S
and their respective standard deviations between crosstalk measures for Monte
Carlo simulations of 500 runs. The mean was taken over the activation measures integral I, maximal concentration M, and the time meas-
ures t
M
and s, separately for PREPs and FREPs, which are depicted in the upper triangle and the lower triangle of the table, respectively.
PREPs CS
e
S
i
FS
K
FREPs C 0.9 ± 0.1 )0.4 ± 0.3 )1 ± 0.0 )0.2 ± 0.2
S
e
0.5 ± 0.4 )0.4 ± 0.3 )1.0 ± 0.0 )0.1 ± 0.1
S
i
)1.0 ± 0.0 )0.4 ± 0.4 0.5 ± 0.2 0.1 ± 0.1
F )1.0 ± 0 )0.5 ± 0.4 1.0 ± 0.0 0.1 ± 0.1
S
K
0.0 ± 0.0 )0.1 ± 0.4 0.0 ± 0.0 0.0 ± 0.0
14
PREPs FREPs
12
10
S
e
8
6
4
2
2 4 6 10
CC
12 14 16 18 20
r
s
= 0.99
r
s
= -0.9
100
500
1000
1500
S
i
1 2 3
8
Fig. 5. Correlation between crosstalk measures for the integral as activation measure. Each dot represents one Monte Carlo simulation (see
text). r
S
denotes the Spearman’s rank correlation coefficient.
Modelling dynamic crosstalk in cell signalling J. Schaber et al.
3530 FEBS Journal 273 (2006) 3520–3533 ª 2006 The Authors Journal compilation ª 2006 FEBS
stronger crossinhibition. Shutting off dephosphorylation of
Kss1PP induced by Fus3PP (simulation experiment 2)
enhances crossactivation and lowers crossinhibition (lower
S
i
and higher S
e
). Inhibiting degradation of Ste12 ⁄ Tec1
triggered by Fus3PP (simulation experiment 3) only had a
notable effect by decreasing crossinhibition (lower S
i
).
Notably, neither the second nor the third process nor both
together could compensate for the effect of the first. This
identifies leakage of activated Ste11 from the pheromone
pathway as the most prominent of the three considered
crosstalk processes. However, it has to be emphasized that
even in the case of shutting off both inhibitory processes
(Column ‘2 + 3’, Table 6) the overall response is still a
crossinhibition (S
i
> 1) even though not as strong as in the
standard run. This is because both pathways sequester
Ste11 when both stimuli are present, and therefore the fila-
mentous growth pathway cannot be fully activated in this
situation.
The availability of Ste11 also plays a role when we study
the effect of a delayed pheromone stimulus (a
t
¼ 30 min,
a
e
¼ 40 min). When the filamentous growth pathway is act-
ive, a fraction of Ste11 is already phosphorylated and is no
longer available for a subsequent pheromone response. In
this case the pheromone response is smaller and conse-
quently also its inhibitory effect on the filamentous growth
pathway (results not shown).
A hypothetical experiment with a proteasome inhibitor
(v
8
¼ 0) results in a prolonged activation of Kss1, PREPs
and FREPs by a pheromone stimulus and consequently a
higher mutual crossactivation.
The sensitivity analysis showed that an altered sensitivity
of PREPs and FREPs to Ste12 promotor activity (v
20
and
v
25
) has a linear effect on their activation, i.e., the param-
eter sensitivity is equal to one concerning the integral and
maximum due to the linear kinetics involved. However, cal-
culating the quotient of the two integrals as in the case of
S
K
leads to reciprocal effects and thus to a much higher
sensitivity concerning this crosstalk measure (Table S4).
Different signal intensities (a, b) had only marginal
effects in our implementation because of rapid saturation
of the activation reactions. In experiments different sig-
nal intensities did have an effect, of course. It must be
stressed, however, that quantitative predictions cannot be
achieved with this model given the qualitative nature of the
parameters.
Acknowledgements
We wish to thank Carl-Fredrik Tiger for inspiring dis-
cussions concerning experimental aspects of crosstalk.
J.S. is supported by the QUASI project (EU contract
LSHG-CT2003-503230). BK is supported by the
Human Frontier Science Project (HFSP) no. 31102705.
AK and EK are supported by the German Federal
Ministry for Education and Research (BMBF, grant
031U109C).
References
1 Schwartz MA & Baron V (1999) Interactions between
mitogenic stimuli, or, a thousand and one connections.
Curr Opin Cell Biol 11, 197–202.
2 Schwartz MA & Madhani HD (2004) Principles of
MAP kinase signaling specificity in Saccharomyces cere-
visiae. Annu Rev Genet 38 , 725–748.
3 Cowan KJ & Storey KB (2003) Mitogen-activated pro-
tein kinases: new signaling pathways functioning in cel-
lular responses to environmental stress. J Exp Biol 206,
1107–1115.
4 Papin JA & Palsson BO (2004) Topological analysis of
mass-balanced signaling networks: a framework to
obtain network properties including crosstalk. J Theor
Biol 227, 283–297.
5 Binder B & Heinrich R (2004) Interrelations between
dynamical properties and structural characteristics of
signal transduction networks. Genome Inform Ser Work-
shop Genome Inform 15, 13–23.
6 Somsen OJ, Siderius M, Bauer FF, Snoep JL & Wes-
terhoff HV (2002) Selectivity in overlapping MAP
kinase cascades. J Theor Biol 218, 343–354.
7 Komarova NL, Zou X, Nie Q & Bardwell L (2005) A
theoretical framework for specificity in cell signaling.
Mol Syst Biol, doi:10.1038/msb4100031
8 Hohmann S (2002) Osmotic stress signaling and osmoad-
aptation in yeasts. Microbiol Mol Biol Rev 66, 300–372.
9 Gustin MC, Albertyn J, Alexander M & Davenport K
(1998) MAP kinase pathways in the yeast Saccharo-
myces cerevisiae. Microbiol Mol Biol Rev 62, 1264–1300.
10 Hohmann S (2002) Osmotic adaptation in yeast – con-
trol of the yeast osmolyte system. Int Rev Cytol 215,
149–187.
11 Leeuw T, Wu C, Schrag JD, Whiteway M, Thomas DY
& Leberer E (1998) Interaction of a G-protein beta-sub-
unit with a conserved sequence in Ste20 ⁄ PAK family
protein kinases. Nature 391, 191–195.
12 Song J, Chen Z, Xu P, Gingras R, Ng A, Leberer E,
Thomas DY & Ni F (2001) Molecular interactions of
Table 6. Crosstalk specificities S
i
and S
e
for the filamentous
growth pathway (FREPs, using the integral as activation measure)
corresponding to different simulation experiments. 1, no activation
of Kss1 by activated Ste11 leaking from the pheromone pathway
(k
30
¼ 0); 2, no dephosphorylation of Kss1PP triggered by Fus3PP
(k
28
¼ 0); 3, no degradation of Ste12 ⁄ Tec1 induced by Fus3PP
(k
24
¼ 0). Std, standard run as displayed in Table 4.
Std. 1 2 3 1 + 2 1 + 3 2 + 3 1 + 2 + 3
S
e
0.07 0.01 0.13 0.07 0.03 0.01 1.3 0.03
S
i
1.4 1.4 1.3 1.1 1.3 1.1 1.1 1.1
J. Schaber et al. Modelling dynamic crosstalk in cell signalling
FEBS Journal 273 (2006) 3520–3533 ª 2006 The Authors Journal compilation ª 2006 FEBS 3531
the Gbeta binding domain of the Ste20p ⁄ PAK family of
protein kinases. An isolated but fully functional Gbeta
binding domain from Ste20p is only partially folded as
shown by heteronuclear NMR spectroscopy. J Biol
Chem 276, 41205–41212. Epub 2001 August 16.
13 Madhani HD & Fink GR (1998) The riddle of MAP
kinase signaling specificity. Trends Genet 14, 151–155.
14 Dohlman HG & Thorner JW (2001) Regulation of G
protein-initiated signal transduction in yeast: paradigms
and principles. Annu Rev Biochem 70, 703–754.
15 Olson KA, Nelson C, Tai G, Hung W, Yong C, Astell
C & Sadowski I (2000) Two regulators of Ste12p inhibit
pheromone-responsive transcription by separate
mechanisms. Mol Cell Biol 20 , 4199–4209.
16 Tedford K, Kim S, Sa D, Stevens K & Tyers M (1997)
Regulation of the mating pheromone and invasive
growth responses in yeast by two MAP kinase sub-
strates. Curr Biol 7, 228–238.
17 Bardwell L, Cook JG, Voora D, Baggott DM, Martinez
AR & Thorner J (1998) Repression of yeast Ste12 tran-
scription factor by direct binding of unphosphorylated
Kss1 MAPK and its regulation by the Ste7 MEK.
Genes Dev 12, 2887–2898.
18 Hung W, Olson KA, Breitkreutz A & Sadowski I (1997)
Characterization of the basal and pheromone-stimulated
phosphorylation states of Ste12p. Eur J Biochem 245,
241–251.
19 Kusari AB, Molina DM, Sabbagh W Jr, Lau CS &
Bardwell L (2004) A conserved protein interaction net-
work involving the yeast MAP kinases Fus3 and Kss1.
J Cell Biol 164, 267–277.
20 Zeitlinger J, Simon I, Harbison CT, Hannett NM, Volk-
ert TL, Fink GR & Young RA (2003) Program-specific
distribution of a transcription factor dependent on part-
ner transcription factor and MAPK signaling. Cell 113,
395–404.
21 Flatauer LJ, Zadeh SF & Bardwell L (2005) Mitogen-
activated protein kinases with distinct requirements for
Ste5 scaffolding influence signaling specificity in Sac-
charomyces cerevisiae. Mol Cell Biol 25, 1793–1803.
22 Elion EA, Brill JA & Fink GR (1991) FUS3 represses
CLN1 and CLN2 and in concert with KSS1 promotes
signal transduction. Proc Natl Acad Sci USA 88, 9392–
9396.
23 Cherkasova V, Lyons DM & Elion EA (1999) Fus3p
and Kss1p control G1 arrest in Saccharomyces cerevi-
siae through a balance of distinct arrest and prolifera-
tive functions that operate in parallel with Far1p.
Genetics 151, 989–1004.
24 Ma D, Cook JG & Thorner J (1995) Phosphorylation
and localization of Kss1, a MAP kinase of the
Saccharomyces cerevisiae pheromone response pathway.
Mol Biol Cell 6, 889–909.
25 Sabbagh W Jr, Flatauer LJ, Bardwell AJ & Bardwell L
(2001) Specificity of MAP kinase signaling in yeast
differentiation involves transient versus sustained
MAPK activation. Mol Cell 8, 683–691.
26 Breitkreutz A, Boucher L & Tyers M (2001)
MAPK specificity in the yeast pheromone response
independent of transcriptional activation. Curr Biol 11,
1266–1271.
27 Maleri S, Ge Q, Hackett EA, Wang Y, Dohlman HG &
Errede B (2004) Persistent activation by constitutive
Ste7 promotes Kss1-mediated invasive growth but fails
to support Fus3-dependent mating in yeast. Mol Cell
Biol 24, 9221–9238.
28 Esch RK & Errede B (2002) Pheromone induction pro-
motes Ste11 degradation through a MAPK feedback
and ubiquitin-dependent mechanism. Proc Natl Acad
Sci USA 99, 9160–9165. Epub 2002 June 20.
29 van Drogen F & Peter M (2001) MAP kinase dynamics
in yeast. Biol Cell 93, 63–70.
30 Bru
¨
ckner S, Ko
¨
hler T, Braus GH, Heise B, Bolte M &
Mo
¨
sch HU (2004) Differential regulation of Tec1 by
Fus3 and Kss1 confers signaling specificity in yeast
development. Curr Genet 46, 331–342.
31 Bao MZ, Schwartz MA, Cantin GT, Yates JR III &
Madhani HD (2004) Pheromone-dependent destruction
of the Tec1 transcription factor is required for MAP
kinase signaling specificity in yeast. Cell 119, 991–
1000.
32 Chou S, Huang L & Liu H (2004) Fus3-regulated Tec1
degradation through SCFCdc4 determines MAPK
signaling specificity during mating in yeast. Cell 119,
981–990.
33 Kofahl B & Klipp E (2004) Modelling the dynamics of
the yeast pheromone pathway. Yeast 21, 831–850.
34 Klipp E, Nordlander B, Kruger R, Gennemark P &
Hohmann S (2005) Integrative model of the response of
yeast to osmotic shock. Nat Biotechnol 23, 975–982.
35 Ghaemmaghami S, Huh WK, Bower K, Howson RW,
Belle A, Dephoure N, O’Shea EK & Weissman JS
(2003) Global analysis of protein expression in yeast.
Nature 425, 737–741.
36 O’Rourke SM & Herskowitz I (1998) The Hog1 MAPK
prevents cross talk between the HOG and pheromone
response MAPK pathways in Saccharomyces cerevisiae.
Genes Dev 12, 2874–2886.
37 Roberts CJ, Nelson B, Marton MJ, Stoughton R,
Meyer MR, Bennett HA, He YD, Dai H, Walker WL,
Hughes TR, Tyers M, Boone C & Friend SH (2000)
Signaling and circuitry of multiple MAPK pathways
revealed by a matrix of global gene expression profiles.
Science 287 , 873–880.
38 Heinrich R, Neel BG & Rapoport TA (2002) Mathema-
tical models of protein kinase signal transduction. Mol
Cell 9, 957–970.
39 McEwen CR, Stallard RW & Juhos ET (1968) Separa-
tion of Biological Particles by Centrifugal Elutriation.
Anal Biochem 23, 369–377.
Modelling dynamic crosstalk in cell signalling J. Schaber et al.
3532 FEBS Journal 273 (2006) 3520–3533 ª 2006 The Authors Journal compilation ª 2006 FEBS
Supplementary material
The following supplementary material is available
online:
Doc. S1. (A) Detailed description of the mathematical
model. (B) Sensitivity analysis.
Fig. S1. Extended model scheme of the pheromone
and the filamentous growth pathway.
Table S1. Nonzero steady state concentrations used as
initial concentrations for the simulations.
Table S2. Mean Spearman’s rank correlation coeffici-
ents r
S
and their respective standard deviations between
activation measures for Monte Carlo simulation.
Table S3. Sensitivity analysis of activation measures
(AM), time integral I, first local maximum M and the
time of the first local maximum t
M
of simulated time
courses of Fus3PP, Kss1PP, PREPs and FREPs with
respect to all parameters.
Table S4. Sensitivity analysis of crosstalk measures
(CM) C,F,S
K
, S
i
and S
e
with respect to the activation
measures (AM), time integral I, first local maximum
M and the time of the first local maximum t
M
of simu-
lated time courses of PREPs (PRs) and FREPs (FRs)
with respect to all parameters.
This material is available as part of the online article
from
J. Schaber et al. Modelling dynamic crosstalk in cell signalling
FEBS Journal 273 (2006) 3520–3533 ª 2006 The Authors Journal compilation ª 2006 FEBS 3533