Báo cáo khoa học: Mycobacterium tuberculosis H37Rv ESAT-6–CFP-10 complex formation confers thermodynamic and biochemical stability docx
Bạn đang xem bản rút gọn của tài liệu. Xem và tải ngay bản đầy đủ của tài liệu tại đây (627.22 KB, 18 trang )
Mycobacterium tuberculosis H37Rv ESAT-6–CFP-10
complex formation confers thermodynamic and
biochemical stability
Akshaya K. Meher
1
, Naresh Chandra Bal
1
, Kandala V. R. Chary
2
and Ashish Arora
1
1 Molecular and Structural Biology, Central Drug Research Institute, Lucknow, India
2 Department of Chemical Science, Tata Institute of Fundamental Research, Mumbai, India
Comparative genomic studies based on whole genome
DNA microarray have led to the identification of 16
regions of deletion (RDs) in Mycobacterium bovis
BCG, which is currently used as a vaccine, with respect
to Mycobacterium tuberculosis and five RDs with
respect to M. bovis. RD1 is absent from all strains of
BCG and Mycobacterium microti, whereas it is present
in all virulent strains of M. tuberculosis and M. bovis
[1]. The RD1 region in M. tuberculosis is 9455 bp long,
and encompasses nine ORFs (Rv3871–Rv3879c).
Keywords
association constant; ESAT-6–CFP-10
complex; limited proteolysis; lipid–protein
interactions; thermal unfolding
Correspondence
A. Arora, Molecular and Structural Biology,
Central Drug Research Institute,
Lucknow 226 001, India
Fax: +91 522 223405
Tel: +91 522 261 2411 18 ext. 4329
E-mail:
(Received 4 January 2006, revised 30
January 2006, accepted 6 February 2006)
doi:10.1111/j.1742-4658.2006.05166.x
The 6-kDa early secretory antigenic target (ESAT-6) and culture filtrate
protein-10 (CFP-10), expressed from the region of deletion-1 (RD1) of
Mycobacterium tuberculosis H37Rv, are known to play a key role in viru-
lence. In this study, we explored the thermodynamic and biochemical chan-
ges associated with the formation of the 1 : 1 heterodimeric complex
between ESAT-6 and CFP-10. Using isothermal titration calorimetry
(ITC), we precisely determined the association constant and free energy
change for formation of the complex to be 2 · 10
7
m
)1
and )9.95 kcalÆ
mol
)1
, respectively. Strikingly, the thermal unfolding of the ESAT-6–CFP-
10 heterodimeric complex was completely reversible, with a T
m
of 53.4 °C
and DH of 69 kcalÆmol
)1
. Mixing of ESAT-6 and CFP-10 at any tempera-
ture below the T
m
of the complex led to induction of helical conformation,
suggesting molecular recognition between specific segments of unfolded
ESAT-6 and CFP-10. Enhanced biochemical stability of the complex was
indicated by protection of ESAT-6 and an N-terminal fragment of CFP-10
from proteolysis with trypsin. However, the flexible C-terminal of CFP-10
in the complex, which has been shown to be responsible for binding to
macrophages and monocytes, was cleaved by trypsin. In the presence of
phospholipid membranes, ESAT-6, but not CFP-10 and the complex,
showed an increase in a-helical content and enhanced thermal stability.
Overall, complex formation resulted in structural changes, enhanced ther-
modynamic and biochemical stability, and loss of binding to phospholipid
membranes. These features of complex formation probably determine the
physiological role of ESAT-6, CFP-10 and ⁄ or the complex in vivo. The
ITC and thermal unfolding approach described in this study can readily
be applied to characterization of the 11 other pairs of ESAT-6 family pro-
teins and for screening ESAT-6 and CFP-10 mutants.
Abbreviations
ANS, 8-anilinonapthalene-1-sulfonate; CFP-10, 10-kDa culture filtrate protein; DPC, dodecylphosphocholine; DSC, differential scanning
calorimetry; ESAT-6, 6-kDa early secretory antigenic target; ESAT-6–CFP-10 complex, 1 : 1 complex of ESAT-6 and CFP-10; HSQC,
heteronuclear single quantum correlation; ITC, isothermal titration calorimetry; Myr
2
PtdCho, dimyristoyl-DL-a-phosphatidylcholine; Ni ⁄ NTA,
nickel ⁄ nitrilotriacetic acid; RD1, region of deletion 1; trCFP-10, truncated 10-kDa culture filtrate protein.
FEBS Journal 273 (2006) 1445–1462 ª 2006 The Authors Journal compilation ª 2006 FEBS 1445
Rv3874 or esxB and Rv3875 or esxA encode the
proteins CFP-10 (10-kDa culture filtrate protein) and
ESAT-6 (6-kDa early secretory antigenic target),
respectively, which play a key role in virulence [2].
Both ESAT-6 and CFP-10 generate a specific Th-1
host immune response and have a strong diagnostic
potential for both the virulent form and latent form
of M. tuberculosis [3]. Several studies have shown
that RD1 and its flanking regions comprising ORFs
Rv3864–Rv3870 and Rv3880c–Rv3883c code for a spe-
cialized secretion system Esx-1, which is responsible
for secretion of ESAT-6 and CFP-10 [4,5]. Recently it
has been shown that the secretion of ESAT-6 and
CFP-10 is also dependent on Esx-1-associated protein
EspA [6].
The genes encoding ESAT-6 and CFP-10 are organ-
ized as an operon and are cotranscribed [7]. On the
basis of tryptophan fluorescence, CD and 1D
1
H-NMR spectra, Renshaw et al. [8] have shown that
ESAT-6 is a molten globule whereas CFP-10 is
unstructured in the native form. Together, ESAT-6
and CFP-10 form a tight 1 : 1 complex. Recently, the
NMR solution structure of the ESAT-6 and CFP-10
complex has been determined by Renshaw et al. [9]
(PDB ID, 1WA8]. In the complex, both the proteins
adopt helix–turn–helix hairpin conformation and are
orientated antiparallel to each other. The contact sur-
face between ESAT-6 and CFP-10 is primarily hydro-
phobic, and van der Waals interactions between
ESAT-6 and CFP-10 run all along the length of the
helices of both proteins. The surface features of the
complex, however, do not indicate its involvement with
any specific function; rather DNA binding, enzyme
activity and pore formation in lipid membranes can be
excluded on the basis of the structure. Fluorescence
microscopy studies have shown that the flexible C-ter-
minal of CFP-10 in the complex is responsible for spe-
cific binding to macrophages and monocytes, on the
basis of which a role in receptor-mediated signaling
has been attributed to the complex [9]. Whether CFP-
10 alone can bind to macrophages and monocytes in a
specific manner was, however, not explored.
The ESAT-6 family contains proteins consisting of
nearly 100 residues. M. tuberculosis H37Rv has 22
members of this family, all of which are in tandem
pairs arranged in clusters [10]. The ESAT-6 family of
protein pairs expressed from Rv0287 and Rv0288 as
well as Rv3019c and Rv3020c are secreted proteins
and form 1 : 1 heterodimeric complexes. Moreover
these protein pairs, because of their close sequence
similarity, may also form nongenome Rv0287–
Rv3020c and Rv0288–Rv3019c complexes. The ESAT-
6 and CFP-10 interaction is quite specific, and these
proteins do not form nongenome complexes with
either Rv0287 ⁄ Rv0288 or Rv3019c ⁄ Rv3020c pairs.
Mutational analysis of ESAT-6 has been carried out
recently to identify the key residues involved in com-
plex formation with CFP-10, secretion, T-cell response
and virulence of M. tuberculosis H37Rv [11]. Several
residues essential for complex formation have been
identified. Mutation of these key residues results in
disruption of complex formation and attenuation of
virulence. The results of mutational analysis have been
explained in terms of a coiled-coil model for the
ESAT-6–CFP-10 complex, with heptad repeats ‘abc-
defg’ harboring positions at sites ‘a’ and ‘d’ for hydro-
phobic residues.
Hsu et al. [12] have demonstrated that either the
deletion of RD1 or disruption of the Rv3874-Rv3875
(cfp-10-esat-6) operon of RD1 results in loss of cyto-
toxicity towards both pneumocytes and macrophages.
The behavior of these mutants is similar to that of
BCG and in contrast with the well-established cytotox-
icity of M. tuberculosis H37Rv to macrophages. Along
similar lines, Guinn et al. [13] have reported that
H37Rv RD1 mutants with disruption of either of the
genes Rv3870, Rv3871, Rv3874 (cfp-10), Rv3875 (esat-
6) or Rv3876 grew minimally and produced no cell
lysis in human macrophage-like THP-1 cell lines. In
the studies of both Hsu et al. and Guinn et al. it was
found that the H37Rv RD1 mutants grew inside the
host cells but were unable to cause cytolysis. It was
further demonstrated by Hsu et al. that ESAT-6, either
alone or in combination with CFP-10, but not CFP-10
alone, could cause disruption and eventual lysis of
black lipid membranes prepared from diphytanoyl-
phosphatidylcholine. On the basis of this, Hsu et al.
[12] proposed that ESAT-6 may mediate lethal ion
fluxes through plasma membranes of the host, leading
to cytolysis. In proteomic studies, ESAT-6 has been
found in the cell membrane fraction of M. tuberculosis
H37Rv [14]. However, Guinn et al. reported that addi-
tion of purified ESAT-6, either alone or in combina-
tion with CFP-10, did not show any toxic effect on
THP-1 cells. Therefore, the nature of the interaction of
ESAT-6, CFP-10 or the complex with phospholipid
membranes is currently not very clear.
A detailed characterization of biochemical and ther-
modynamic changes associated with complex forma-
tion is necessary to fully understand the biological role
of ESAT-6, CFP-10 and the complex. In addition, the
nature of the interaction of ESAT-6, CFP-10 and
the complex with phospholipid membranes needs to be
understood clearly. The results of our detailed bio-
physical studies show that, compared with ESAT-6 or
CFP-10, the complex has enhanced thermodynamic
Stability of ESAT-6–CFP-10 complex A. K. Meher et al.
1446 FEBS Journal 273 (2006) 1445–1462 ª 2006 The Authors Journal compilation ª 2006 FEBS
and biochemical stability. ESAT-6, but not CFP-10 or
the complex, undergoes conformational change on
binding to the phospholipid membranes. We also stud-
ied complex formation with CFP-10 and interaction
with phospholipid membranes for four mutants of
ESAT-6. We suggest biophysical characterization of
complex formation as a general approach that can be
used for all 11 pairs of ESAT-6 family proteins in
M. tuberculosis H37Rv, and furthermore for screening
the entire set of ESAT-6 and CFP-10 mutants.
Results
Thermodynamic parameters governing ESAT-6
and CFP-10 complex formation
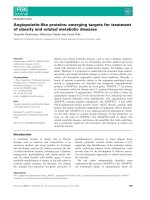
Isothermal titration calorimetry (ITC) experiments
were carried out to accurately measure the association
constant for ESAT-6 and CFP-10 complex formation.
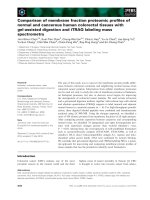
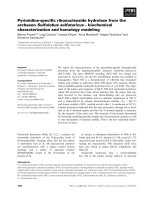
The raw ITC data, generated by titration of 1.3 mL
0.42 mm ESAT-6 during the 50 injections of 4 lL
0.042 mm CFP-10 are shown in Fig. 1A, and the integ-
rated areas under each peak versus molar ratio of
ESAT-6 to CFP-10 are plotted in Fig. 1B. The binding
isotherm of ESAT-6 with CFP-10 is characterized by
strong heat release, which is indicated by a slope
approaching infinity. The heat released decreases as
ESAT-6 becomes saturated. In the last 23 injections of
the titration, only heat of dilution is observed. The
binding isotherm in Fig. 1B was fitted to a single-site
binding model for determination of thermodynamic
parameters. The solid line indicates best fit to the plot.
The parameters used in fitting were the stoichiometry
of association ( n), the binding constant (K
B
) and the
change in enthalpy (DH
B
). The values of these parame-
ters obtained from the nonlinear least-squares fit to
the binding curve are: n ¼ 1.0, DH
B
¼ )40.3 kcalÆ
mol
)1
, and K
B
¼ 2 · 10
7
m
)1
. The ITC binding iso-
therm can be characterized by a unitless value c [15],
which is given by c ¼ K
B
[M]n, where [M] is the con-
centration of the macromolecule ESAT-6. For an accu-
rate determination of the binding constant, a ‘c’ value
between 1 and 1000 is recommended. In the case of
ESAT-6 and CFP-10, the value of ‘c’ is 840, which is
indicative of a tightly bound complex. The free energy
change (DG) associated with complex formation is
given by: DG ¼ –RTlnK
B
, where R is the gas constant
and T is the temperature in Kelvin. At 25 °C, DG for
complex formation is )9.95 kcalÆmol
)1
. The entropy
change associated with complex formation is deter-
mined from the equation: DG ¼ DH ) TDS.At25°C,
DS is )101 calÆmol
)1
ÆK
)1
. Both the entropy change
and enthalpy change associated with complex forma-
tion are characteristically high. However, typical
enthalpy–entropy compensation results in a moderate
value of DG of )9.95 kcalÆmol
)1
. The free energy
change for complex formation between ESAT-6 and
CFP-10 is comparable to the DG associated with simi-
larly sized protein–protein interactions, e.g. DG of
)9.6 ± 0.5 kcalÆmol
)1
was observed for interaction
between turkey ovomucoid third domain with a-chy-
motrypsin and DG of )11.3 ± 0.7 kcalÆ mol
)1
was
observed for interaction between T-cell factor 4 and
b-catenin [16,17].
Thermal unfolding of the ESAT-6–CFP-10 complex
is completely reversible
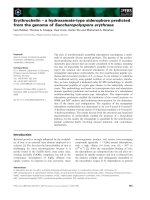
Differential scanning calorimetry (DSC) studies were
carried out to assess the thermal stability of the
ESAT-6–CFP-10 complex and to accurately measure
the enthalpy and heat capacity changes involved in the
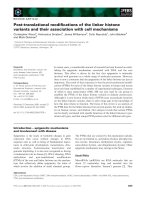
unfolding. A DSC thermogram of the thermal unfold-
ing of the complex at a concentration of 0.105 mm in
phosphate buffer and a scan rate of 60 °CÆh
)1
, from 20
to 80 °C is shown by the solid line curve in Fig. 2.
After the first heating scan, the sample was cooled
from 80 to 20 °C and then a second heating scan was
A
B
Fig. 1. Typical calorimetric isothermal titration measurements of
the interaction of CFP-10 with ESAT-6 in phosphate buffer at
25 °C. (A) Raw data of heat effect (in lcalÆs
)1
)of654-lL injections
of 0.42 m
M CFP-10 into 1.3 mL 0.042 mM ESAT-6 performed at 4-s
intervals. (B) The data points (d) were obtained by integration of
heat signals plotted against the molar ratio of ESAT-6 to CFP-10 in
the reaction cell. The solid line represents a calculated curve using
the best-fit parameters obtained by a nonlinear least squares
fit. The heat of dilution was subtracted from the raw data of titra-
tion of CFP-10 with ESAT-6.
A. K. Meher et al. Stability of ESAT-6–CFP-10 complex
FEBS Journal 273 (2006) 1445–1462 ª 2006 The Authors Journal compilation ª 2006 FEBS 1447
recorded, which is shown by the dotted line curve in
Fig. 2. The peak shaped thermograms indicate co-op-
erativity during unfolding [18]. The thermal unfolding
transition is characterized by an enthalpy change (DH)
of 69 kcalÆmol
)1
, T
m
of 53.4 °C, and T
1 ⁄ 2
of 9.01 °C.
However, no change in heat capacity (DC
p
) was
observed for the thermal unfolding transition. DSC
scans recorded at scan rates of 20, 40, 60 and
90 °CÆh
)1
showed only a small shift in the T
m
from 54
to 53.4 °C and a small decrease in transition enthalpy
from 74 to 69 kcalÆmol
)1
. As the first and second heat-
ing scans completely overlap at every scan rate, it
strikingly indicates that the thermal unfolding of the
complex is completely reversible.
The secondary and tertiary structural changes asso-
ciated with thermal unfolding of the complex were
followed by steady-state CD and 2D
15
N-
1
H heteronu-
clear single quantum correlation (HSQC) NMR experi-
ments, respectively. Far-UV CD spectra of CFP-10,
ESAT-6 and ESAT-6–CFP-10 complex were similar to
those reported previously by Renshaw et al. [8]. As
CFP-10 is almost completely unstructured, the thermal
unfolding and refolding experiments were performed
only for ESAT-6 and the complex. Steady-state CD
scans were recorded on a sample first at increasin g
temperatures in the range 25–75 °C and then in
decreasing order from 75 to 25 °C, at 5 °C intervals.
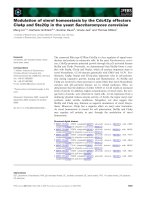
The thermal unfolding and refolding profiles of
ESAT-6 and the complex are shown in Fig. 3A. The
midpoints of thermal unfolding transitions (T
m
)of
Fig. 2. Thermal reversibility of 1 : 1 ESAT-6–CFP-10 complex monit-
ored by DSC. DSC thermogram of 0.51 mL 0.105 m
M ESAT-6–CFP-
10 from 20 °Cto80°C, at a scan rate of 60 °C per h. The raw data
were baseline-corrected for buffer. The plots show excess heat
capacity as a function of temperature in °C. The complex was hea-
ted to 80 °C for the first thermogram shown by the solid line.
The sample was then cooled down to 20 °C. The second thermo-
gram recorded by reheating the same sample is shown by a
dashed line.
Fig. 3. Thermal reversibility of ESAT-6 and the 1 : 1 ESAT-6–CFP-
10 complex monitored by CD. (A) Normalized transition curves for
temperature-induced transition of ESAT-6 and the complex monit-
ored in the far-UV CD region at 222 nm. Thermal unfolding (h) and
thermal refolding (s) profile of ESAT-6 and thermal unfolding (n)
and thermal refolding (e) profile of the complex were plotted as
fraction of protein folded versus temperature in °C. (B) Far-UV CD
spectrum of ESAT-6 (h) was recorded in phosphate buffer, pH 6.5
at 25 °C. The sample was heated to 70 °C and cooled down to
25 °C, and the far-UV CD spectrum was recorded again (s). (C) CD
spectrum of the 1 : 1 complex at 25 °C was recorded before therm-
al unfolding (h) and after thermal refolding (s) as described for
ESAT-6.
Stability of ESAT-6–CFP-10 complex A. K. Meher et al.
1448 FEBS Journal 273 (2006) 1445–1462 ª 2006 The Authors Journal compilation ª 2006 FEBS
ESAT-6 and the complex are at 33 °C and 53 °C,
respectively. For the complex, the T
m
determined from
CD (53 °C) matches well with that determined by
DSC (53.4 °C). CD spectra recorded before and after
unfolding, at 25 °C, for ESAT-6 and the complex are
shown in Fig. 3B,C, respectively. Similar to the unfold-
ing and refolding profiles mentioned above, entire CD
spectra before and after unfolding overlapped at every
temperature, suggesting that the molecular steps lead-
ing to thermal unfolding are retraced on refolding for
both ESAT-6 and the complex.
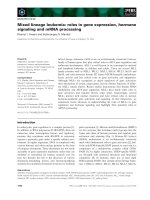
The 2D
15
N-
1
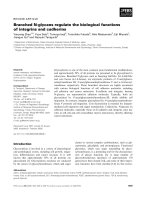
H-HSQC spectrum serves as a finger-
print of the overall structure of a protein. The HSQC
spectrum recorded with
15
N-labeled CFP-10 at 30 °C
is shown in Fig. 4A. The spectrum is characterized by
sharp but narrowly dispersed peaks along the
1
H
N
dimension (within 7–8.5 p.p.m), which is consistent
with CFP-10 being unstructured in its native form.
The 2D
15
N-
1
H-HSQC spectrum of
15
N-labeled ESAT-
6 is shown in the Fig. 4B. The broad peaks and peak
dispersion pattern in the HSQC spectrum are consis-
tent with the previously reported molten globular state
of free ESAT-6. The HSQC spectrum of the complex
formed between
15
N-labeled CFP-10 and unlabeled
ESAT-6 is shown in Fig. 4D, and that of the complex
formed between
15
N-labeled ESAT-6 with unlabeled
CFP-10 is shown in the Fig. 4E. Figure 4C shows the
2D
15
N-
1
H-HSQC spectrum of the complex in which
both the proteins are
13
C,
15
N-labeled. The sum of the
HSQC spectra of individually labeled proteins in com-
plex, i.e. the sum of spectra in Fig. 4D,E, is shown in
the Fig. 4F. The spectrum in Fig. 4F overlaps very
well with the spectrum of the complex shown in
Fig. 4C. To find any change in tertiary structure of the
AB C
DE F
Fig. 4. Conformational change observed individually in ESAT-6 and CFP-10 on complex formation. (A) and (D) show
15
N-
1
H-HSQC spectra of
15
N-labeled CFP-10 in the free state and in complex with unlabeled ESAT-6, respectively. (B) and (E) show
15
N-
1
H-HSQC spectra of
15
N-label-
ed ESAT-6 in the free state and in complex with unlabeled ESAT-6, respectively. (C)
15
N-
1
H-HSQC spectrum of 1 : 1 [
13
C,
15
N]ESAT-6–
[
13
C,
15
N]CFP-10 complex. (F) Spectrum produced by addition of the spectra in (D) and (E). All spectra were recorded in NMR buffer (see
Experimental procedures) containing 5% (v ⁄ v) D
2
Oat30°C on a 600-MHz NMR spectrometer.
A. K. Meher et al. Stability of ESAT-6–CFP-10 complex
FEBS Journal 273 (2006) 1445–1462 ª 2006 The Authors Journal compilation ª 2006 FEBS 1449
complex during the unfolding and refolding process,
15
N-
1
H-HSQC spectra on 1 mm complex in phosphate
buffer were first recorded at 30, 40, 50, 55, 60 and
65 °C, in increasing order (Fig. 5A,C,E,G,I,K, respect-
ively), after which HSQC spectra on the same sample
were recorded at 60, 55, 50, 40 and 30 °C
(Fig. 5J,H,F,D,B, respectively), in decreasing order.
The tertiary structure is retained up until 60 °C. Strik-
ingly, the peaks in the HSQC spectrum at any partic-
ular temperature before and after unfolding almost
completely overlap, and are representative of the
HSQC spectrum of the complex, but not the HSQC
spectra of the individual proteins ESAT-6 and CFP-
10. This indicates that the tertiary structure of the
complex is also completely regained after thermal
unfolding.
Molecular recognition between ESAT-6 and
CFP-10 exists even when the two proteins are in
unstructured form
As the secondary structure of ESAT-6 is highly
dependent on the temperature, we investigated whether
any residual secondary structure of ESAT-6 is neces-
sary for complex formation with CFP-10. CD scans
were recorded for samples in which ESAT-6 and CFP-
10 were mixed at 25, 30, 35, 40, 45, 50 and 55 °C, and
compared with CD scans of the complex formed
between the two proteins at 25 °C and heated to
equivalent temperatures. Fig. 6 shows thermograms
generated by plotting mean residue ellipticity at
222 nm as a function of temperature for ESAT-6,
CFP-10, the 1 : 1 complex of ESAT-6–CFP-10, and
equimolar CFP-10 and ESAT-6 mixed at different
temperatures. As can be seen, there was an increase in
helical content equivalent to that of the complex when
ESAT-6 and CFP-10 were mixed together at tempera-
tures up to 55 °C, indicating formation of helices
locally by interactions between specific segments of
CFP-10 and ESAT-6. These results indicate that the
secondary structure of ESAT-6 is not necessary for the
AB
CD
EF
GH
I
K
J
Fig. 5. Thermal reversibility of 1 : 1 ESAT-6–CFP-10 complex monit-
ored by NMR spectroscopy. 1 m
M [
15
N]ESAT-6–[
15
N]CFP-10 com-
plex in NMR buffer, pH 6.5, with 5% (v ⁄ v) D
2
O was used to
monitor thermal reversibility of the complex.
15
N-
1
H-HSQC spectra
were recorded on a 500-MHz NMR spectrometer at 30 °C(A),
40 °C(C),50°C(E),55°C(G),60°C (I) and 65 °C (K), in increasing
order, after which
15
N-
1
H-HSQC spectra on the same sample were
recorded at 60 (J), 55 (H), 50 (F), 40 (D) and 30 °C (B), in decreas-
ing order.
Fig. 6. Temperature dependence of the interaction of ESAT-6 and
CFP-10. Isothermal CD spectra were recorded at 5 °C temperature
interval from 25 to 55 °C. A plot is shown of mean residue elliptici-
ty values at 222 nm as a function of temperature, recorded for
ESAT-6 (h), CFP-10 (e), and 1 : 1 ESAT-6–CFP-10 complex formed
by mixing equimolar proteins at 25 °C(n), and equimolar ESAT-6
and CFP-10 mixed together at 25, 30, 35, 40, 45, 50 and 55 °C(d).
Stability of ESAT-6–CFP-10 complex A. K. Meher et al.
1450 FEBS Journal 273 (2006) 1445–1462 ª 2006 The Authors Journal compilation ª 2006 FEBS
complex formation, and specific molecular recognition
between the interacting segments of ESAT-6 and
CFP-10 exists even when the two proteins are in
unstructured form.
CFP-10 reduces its susceptibility to trypsin
digestion on forming a complex with ESAT-6
To investigate the biochemical stability of the proteins,
limited proteolysis with trypsin was performed at 4 °C,
for ESAT-6, CFP-10 and the 1 : 1 ESAT-6–CFP-10
complex, and the digested products thus obtained were
analyzed by SDS ⁄ PAGE (15% gel). The Coomassie-
stained SDS ⁄ polyacrylamide gels are shown in
Fig. 7A. On trypsinolysis, CFP-10 showed multiple
bands on SDS ⁄ PAGE after 1 min of digestion at 4 °C,
and was completely digested to oligopeptides in
20 min. ESAT-6 was stable for 60 min at 4 °C. Fur-
ther degradation of ESAT-6 yielded two bands corres-
ponding to molecular masses of 14 kDa and 3 kDa.
The 14-kDa band may be an aggregate of trypsin-
degraded products of ESAT-6. In contrast with ESAT-
6 and CFP-10, the complex displayed a characteristic
pattern on trypsinolysis. On treatment of the complex
with trypsin at 4 °C, one additional band appeared
after 1 min incubation. The largest and smallest of
these bands corresponded to CFP-10 and ESAT-6,
respectively. A third band labeled trCFP-10 (for trun-
cated CFP-10), in between CFP-10 and ESAT-6, with
molecular mass % 2 kDa lower than CFP-10 was
observed, which apparently results from truncation of
CFP-10 by cleavage at a particular site by trypsin. On
continued incubation, the intensity of the band corres-
ponding to CFP-10 decreased, whereas that of trCFP-
10 increased with time, and no change in the intensity
of the band corresponding to ESAT-6 was observed.
After 2 h of trypsin treatment, the band corresponding
to intact CFP-10 had disappeared completely, whereas
the bands corresponding to trCFP-10 and ESAT-6
were still present. An essentially similar pattern of
bands was observed for the complex after 3 h of tryp-
sinolysis except that a weak band with an apparent
mass of 6 kDa was observed, which resulted from fur-
ther degradation of trCFP-10. Both ESAT-6 and CFP-
10 have C-terminal hexa-histidine tags. Western blots
with antibody to histidine are shown in Fig. 7B.
trCFP-10 was not detected, indicating that it results
from cleavage of the C-terminus of CFP-10. Overall,
these results indicate that complex formation leads to
interdependent protection of an N-terminal fragment
of CFP-10 and ESAT-6 from trypsinolysis.
ESAT-6 possesses solvent-exposed hydrophobic
clusters
To assess the solvent-exposed hydrophobic surface of
the proteins, we studied the change in fluorescence
intensity of 8-anilino-1-naphthalenesulfonate (ANS) on
A
B
Fig. 7. Limited proteolysis with trypsin of ESAT-6, CFP-10 and 1 : 1 ESAT-6–CFP-10 complex. (A) SDS ⁄ PAGE of aliquots removed at differ-
ent time points for reaction of 40 l
M ESAT-6, or CFP-10, or 1 : 1 ESAT-6–CFP-10 complex with 1 lg trypsin at 4 °C. Lanes 1, 4, 7, 10, 13,
16, and 19, CFP-10; lanes 2, 5, 8, 11, 14, 17, and 20, ESAT-6; lanes 3, 6, 9, 12, 15, 18, and 21 ESAT-6–CFP-10 correspond to aliquots
withdrawn after 0, 1, 5, 20, 60, 120 and 180 min of trypsinolysis. LMW is low-molecular-mass protein marker. (B) Western blot developed
with antibody to histidine. The lanes of the blot correspond to the lanes of SDS ⁄ PAGE, except for LMW.
A. K. Meher et al. Stability of ESAT-6–CFP-10 complex
FEBS Journal 273 (2006) 1445–1462 ª 2006 The Authors Journal compilation ª 2006 FEBS 1451
binding to ESAT-6, CFP-10 and ESAT-6–CFP-10.
Figure 8 shows extrinsic fluorescence spectra of ANS
in the presence of ESAT-6, CFP-10 and the complex,
at 25 °C. The fluorescence intensities have been nor-
malized with respect to the maximum fluorescence
intensity of ANS bound to ESAT-6. As expected from
its molten globule state, ESAT-6 showed high ANS
binding. No change in fluorescence intensity of ANS
was observed in the presence of CFP-10, indicating
that ANS did not bind to CFP-10, as expected from
the unstructured form of CFP-10. A decrease of
65 ± 5% in ANS fluorescence intensity was obtained
on ESAT-6–CFP-10 complex formation.
Myr
2
PtdCho vesicles stabilize the secondary
structure of ESAT-6 above its melting
temperature
To investigate the binding of ESAT-6, CFP-10 and the
complex to lipid membranes, 6 lm protein samples
were incubated with dimyristoyl-dl-a-phosphatidylcho-
line (Myr
2
PtdCho) vesicles in phosphate buffer, and
the change in conformation was monitored by CD
spectroscopy. CD spectra of CFP-10, ESAT-6–CFP-10
and ESAT-6 in the absence and presence of Myr
2
Ptd-
Cho vesicles are shown in Fig. 9A,B,C. At 25 °C, the
Fig. 9. Far-UV CD spectra of ESAT-6, CFP-10 and the 1 : 1 ESAT-6–CFP-10 complex in the presence of Myr
2
PtdCho vesicles. CD spectra of
6 l
M CFP-10, ESAT-6–CFP-10 and ESAT-6 without Myr
2
PtdCho vesicles in phosphate buffer, pH 6.5, at 25 °C(h) and 37 °C(s) and with
Myr
2
PtdCho vesicles in phosphate buffer, pH 6.5, at 25 °C(n)and37°C(,) are shown. The spectra obtained at 25 °C after cooling the pro-
tein samples containing Myr
2
PtdCho vesicles from 37 °C, are shown with symbols (e).
Fig. 8. Binding of ANS to ESAT-6, CFP-10 and the 1 : 1 ESAT-6–
CFP-10 complex. The fluorescence emission spectra of 100 l
M
ANS in the presence of 10 lM ESAT-6 (s), CFP-10 (h) and ESAT-
6–CFP-10 complex (m) in phosphate buffer, pH 6.5, at 25 °C.
Stability of ESAT-6–CFP-10 complex A. K. Meher et al.
1452 FEBS Journal 273 (2006) 1445–1462 ª 2006 The Authors Journal compilation ª 2006 FEBS
CD spectra of CFP-10 and the complex did not show
any significant change, whereas ESAT-6 showed a
minor increase in helicity (from 49% to 52%) in the
presence of Myr
2
PtdCho vesicles. When the tempera-
ture of the sample was increased to 37 °C, CFP-10 and
the complex still showed no change. However, ESAT-6
retained an a-helical content of 32% in contrast with
19% in the absence of Myr
2
PtdCho vesicles at 37 °C.
On cooling the same ESAT-6 ⁄ Myr
2
PtdCho vesicle
sample from 37 °Cto25°C, the a-helical content
increased further to 63%, which is significantly higher
than the helicity obtained on mixing ESAT-6 and
Myr
2
PtdCho vesicles at 25 °C.
Interaction of ESAT-6 mutants with CFP-10 and
phospholipid membranes
We have used a novel approach to select residues for
mutations from the 26 residues of ESAT-6 that are at
the interface between ESAT-6 and CFP-10 in the com-
plex, as reported by Renshaw et al. [9]. Our approach
was based on detection of NOEs from the backbone
amide protons of ESAT-6 to the side chain protons of
CFP-10. Residues of ESAT-6, the amide protons of
which showed strongest NOEs with the side chain
protons of CFP-10 in the labeled complex, were selected
for mutation. For detecting NOEs, we prepared the
complex from
13
C,
15
N-labeled CFP-10 and
2
H,
13
C,
15
N-
labeled ESAT-6. A set of 3D triple-resonance experi-
ments HNCO, HNCA, and HN(CA)CB were recorded
to validate our sample. Strips from HNCA and
HN(CA)CB spectra demonstrating the sequential
assignments of residues Leu39 to Trp43 are shown in
Fig. 10A,B, respectively. These assignments are similar
to those reported by Renshaw et al. [9]. An
15
N-edited
NOESY-HSQC spectrum was recorded for the complex
for detecting the NOEs. NOEs from backbone amide
protons of ESAT-6 and side chain protons of CFP-10
A
B
C
Fig. 10. Sequential assignments and inter-
protein NOEs for a segment of ESAT-6
interacting with CFP-10. (A) and (B) Strips
showing the sequential assignments from
3D HNCA and HN(CA)CB spectra, respect-
ively, recorded from 1 m
M 1 : 1 complex of
2
H,
13
C,
15
N-labeled ESAT-6 and
13
C,
15
N-labe-
led CFP-10 in NMR buffer with 5% (v ⁄ v)
D
2
Oat30°C on a 600-MHz NMR spectro-
meter. The strips are taken at the indicated
15
N chemical shifts that were assigned to
residues 39–43 of ESAT-6. They are cen-
tered about the corresponding amide proton
chemical shifts. The top of the sequence-
specific assignments is indicated by one-
letter amino-acid code and by sequence
number. The one directional arrows in these
figures indicate a sequential walk through
2D
13
C
a
-
1
H
N
and
13
C
b
-
1
H
N
planes taken
in the position of the corresponding
1
H
N
,
15
N,
13
C
a
and
1
H
N
,
15
N,
13
C
b
resonances
in 3D HNCA and HN(CA)CB spectra,
respectively. (C) Strips from
1
H,
15
N-NOESY-
HSQC spectrum recorded with s
mix
of
150 ms. In these strips, NOEs are shown
between downfield amide protons and
upfield aliphatic protons. The amide protons
correspond to the sequentially assigned seg-
ment 39–43 of ESAT-6. The backbone
amide protons of this segment show NOEs
with protons at 0.808 p.p.m. from a side
chain of CFP-10.
A. K. Meher et al. Stability of ESAT-6–CFP-10 complex
FEBS Journal 273 (2006) 1445–1462 ª 2006 The Authors Journal compilation ª 2006 FEBS 1453
were observed for the segments Ala14-Ala15-Ser16
(1.187 p.p.m.), Ala17-Ile18 (1.200 p.p.m.), Ser24-Ile25
(0.934 p.p.m.), Leu28-Leu29-Asp30 (0.897 p.p.m.),
Glu31-Gly32-Lys33-Gln34-Ser35-Leu36 (0.745 p.p.m.),
Leu39-Ala40-Ala41-Ala42-Trp43 (0.808 p.p.m.), and
Glu64-Leu65-Asn66 (1.415 p.p.m.). Values in paren-
theses are the chemical shift of the side chain protons of
CFP-10 with which backbone amide proton of ESAT-6
show the NOE. Figure 10C shows the NOE between the
amide protons for the segment Leu39 to Trp43 from
ESAT-6 to the side chain proton of CFP-10. Strongest
NOEs were observed for the residues Leu29, Gly32,
Ala41 and Leu65. On the basis of this, four point
mutants L29D, G32D, A41D and L65D of ESAT-6
were generated. We studied complex formation between
ESAT-6 mutants and CFP-10 by CFP-10 pull-down
assays and CD spectroscopy. In parallel, we also studied
the interaction of ESAT-6 mutants with Myr
2
PtdCho
membranes by CD spectroscopy.
SDS ⁄ PAGE of the CFP-10 pull-down assay is
shown in Fig. 11A. Two prominent low-molecular-
mass bands corresponding to untagged CFP-10 and
A
B
Fig. 11. Study of complex formation between ESAT-6 mutants and CFP-10. (A) A SDS ⁄ 15% polyacrylamide gel showing results of CFP-10
pull-down assay. LMW, low-molecular-mass protein marker. The rest of the lanes show purified ESAT-6 or ESAT-6 mutants and Ni ⁄ NTA
eluate (see Experimental procedures). (B) Far-UV CD spectra of CFP-10 (h), ESAT-6 mutants (n) and 1 : 1 mixture of ESAT-6 mutant and
CFP-10 (s) recorded in phosphate buffer, pH 6.5, at 25 °C.
Stability of ESAT-6–CFP-10 complex A. K. Meher et al.
1454 FEBS Journal 273 (2006) 1445–1462 ª 2006 The Authors Journal compilation ª 2006 FEBS
tagged ESAT-6 or ESAT-6 mutants were observed in
the eluted fractions of ESAT-6, ESAT-6-G32D and
ESAT-6-A41D. A single prominent band correspond-
ing to the molecular mass of ESAT-6 was observed in
the eluted fraction of ESAT-6-L29D and ESAT-6-
L65D. This indicates that only the ESAT-6 mutants
G32D and A41D form a complex with CFP-10.
The CD spectra of ESAT-6 mutants in the absence
and presence of equimolar CFP-10 are shown in
Fig. 11B. The a-helical contents of ESAT-6 mutants
L29D, G32D, A41D and L65D were 13%, 18%, 46%
and 9% compared with 49% a-helicity of ESAT-6. In
the presence of equimolar CFP-10, the a-helical con-
tents of the mixture containing ESAT-6 mutants
L29D, G32D, A41D and L65D were 42%, 61%, 64%
and 12%, respectively, compared with 64% a-helical
content of wild-type ESAT-6–CFP-10 complex.
The CD spectra of ESAT-6 mutants in the presence
and absence of Myr
2
PtdCho vesicles at 37 °C are
shown in Fig. 12. The a-helical content of L29D,
G32D, A41D and L65D at 37 °C without Myr
2
Ptd-
Cho vesicles were 15%, 10%, 19% and 9%, respect-
ively, and with Myr
2
PtdCho vesicles were 18%, 14%,
30% and 15%, respectively. This shows that only the
A41D mutant of ESAT-6 shows behavior similar to
the wild-type ESAT-6, whereas other mutations affect
the interaction of ESAT-6 with Myr
2
PtdCho mem-
branes.
Discussion
Secreted proteins ESAT-6 and CFP-10 of M. tuber-
culosis form a tight 1 : 1 complex. Secretion of these
proteins by internalized mycobacteria seems to be
important for the cytolysis of the host and conse-
quently mycobacterial virulence. However, mycobacte-
ria secrete a large number of proteins including some
of the other proteins of the ESAT-6 family. Therefore,
the thermodynamic parameters governing the specifici-
ty of complex formation between ESAT-6 and CFP-10
need to be determined more accurately. Renshaw et al.
[8] have previously estimated the dissociation con-
stant (K
d
) of the ESAT-6–CFP-10 complex to be
1.1 · 10
)8
m or lower, based on intrinsic tryptophan
fluorescence studies. We used ITC to accurately deter-
mine the association constant K
B
(K
B
¼ 1 ⁄ K
d
) and
also the thermodynamic parameters DH, DS, and DG
associated with complex formation. The strong interac-
tion of ESAT-6 and CFP-10 is reflected in the associ-
ation constant of 2 · 10
7
m
)1
. The major contribution
Fig. 12. Interaction of ESAT-6 mutants with Myr
2
PtdCho vesicles. The figures show far-UV CD spectra of 6 lM ESAT-6 mutants recorded at
37 °C, without Myr
2
PtdCho vesicles (h) and with 0.5 mM Myr
2
PtdCho vesicles (s) in phosphate buffer, pH 6.5.
A. K. Meher et al. Stability of ESAT-6–CFP-10 complex
FEBS Journal 273 (2006) 1445–1462 ª 2006 The Authors Journal compilation ª 2006 FEBS 1455
to the change in enthalpy DH ()40.3 kcalÆmol
)1
) comes
from the structuring of ESAT-6 and CFP-10, and the
corresponding reduction in solvent-exposed hydropho-
bic clusters, as indicated by the ANS-binding experi-
ment. This indicates that clustering of hydrophobic
side chains at the ESAT-6 ⁄ CFP-10 interface is an
important determinant of complex formation. The
large negative value of DS ()101 calÆ mol
)1
ÆK
)1
) results
from loss of conformational freedom of the side chains
on complex formation. The dissociation constant of
the complex (5 · 10
)8
m) obtained from ITC is in the
same range as the dissociation constant of the complex
reported previously by Renshaw et al. (1.1 · 10
)8
m).
The most exciting finding of our study is that the
thermal unfolding of the complex is completely reversi-
ble. To the best of our knowledge, ours is the first
report characterizing fully reversible thermal unfolding
of a complex formed between a molten globule and an
inherently unstructured protein. CD and NMR experi-
ments show that the molecular steps involved in
unfolding of the complex were retraced on refolding.
Further, a mixing experiment shows that complex for-
mation between ESAT-6 and CFP-10 can take place at
any temperature below the T
m
of the complex. This
strongly reflects the fact that molecular recognition
between interacting segments of ESAT-6 and CFP-10
exists even in the unfolded state, and is probably the
driving force for the folding of ESAT-6 and CFP-10.
In the recently determined solution NMR structure,
both ESAT-6 and CFP-10 adopt helix–turn–helix hair-
pin structures that lie antiparallel to each other. The
interface between ESAT-6 and CFP-10 is characterized
by extensive van der Waals contact all along the length
of the helices in both the proteins. Renshaw et al. have
reported that the residues Lys5, Thr6, Leu11, Glu14,
Asn17, Phe18, Ile21, Leu25, Gln28, Val32, Thr35,
Leu39, Gln42, Trp43, Arg44, Ala46, Ala47, Ala50,
Ala54, Phe58, Ala61, Lys64, Gln65, Glu68, Glu71,
Ile72, Asn75, Ile76 and Ala79 of CFP-10 and residues
Ile11, Ala14, Ile18, Asn21, Ile25, Leu28, Leu29, Glu31,
Gly32, Ser35, Lys38, Leu39, Ala41, Ala42, Trp43,
Lys57, Trp58, Thr61, Glu64, Leu65, Ala68, Leu69,
Leu72, Thr75, Ile76 and Met83 of ESAT-6 are at the
interface [9]. This primarily hydrophobic surface com-
plementarity of ESAT-6 and CFP-10 in the complex
explains the high specificity of ESAT-6 for CFP-10
and is also responsible for the reversible thermal
unfolding of the complex.
Proteolysis of antigens in lysosomes is an important
step in antigen processing and presentation. Natarajan
et al. [19] have shown that CFP-10, on trypsinization,
failed to induce maturation of dendritic cells, which
emphasized that the native form of CFP-10 was
required for its activity. Our study shows that CFP-10
is highly susceptible to proteolysis by trypsin. At 4 °C,
CFP-10 was completely degraded in 20 min. The high
susceptibility of CFP-10 is because of its unstructured
form. ESAT-6 displays higher stability towards proteo-
lysis by trypsin in comparison with CFP-10. At 4 °C,
ESAT-6 was almost completely degraded in 60 min.
Thermal unfolding experiments described above show
that at physiological temperature (37 °C), ESAT-6
would be in the unstructured form and therefore
highly susceptible to proteases. Mixing experiments
described above show that complex formation can take
place at 37 °C. Therefore, complex formation probably
provides higher stability to ESAT-6 and CFP-10
towards intracellular proteases. It is also very interest-
ing to note that the flexible C-terminus of CFP-10 in
the ESAT-6–CFP-10 complex, which has recently been
shown to be responsible for specific binding to the sur-
face of monocytes and macrophages [9], is quite sus-
ceptible to trypsin. A similar stability profile for
ESAT-6, CFP-10 and the complex towards lysosomal
enzymes cathepsin L and S has been reported recently
by Marei et al. [20].
Hsu et al. [12] suggested that ESAT-6 secreted by
intracellular mycobacteria mediates cytolysis of host
cells by causing lethal ion fluxes through plasma mem-
branes. This suggestion was based on two observa-
tions. First, addition of glycine, which can protect the
cell against lethal ion fluxes across plasma membranes,
reduced the amount of cytolysis from % 87% to
% 13%. Secondly, ESAT-6, but not CFP-10, could
cause disruption of black lipid membranes. However,
addition of ESAT-6 alone or in complex with CFP-10
to human macrophage-like THP-1 cell lines did not
show any toxic effect [13]. For a clear understanding
of the nature of binding of ESAT-6, CFP-10, and the
complex to phospholipid membranes, we probed the
interaction of these proteins with Myr
2
PtdCho mem-
branes by CD spectroscopy. In our study, the CD
spectra of CFP-10 and the complex did not show any
change in the presence of Myr
2
PtdCho vesicles at
either 25 °Cor37°C, which indicates that they do
not bind to phospholipid membranes. As CFP-10 is
unstructured, it lacks hydrophobic patches that would
thermodynamically drive its binding to the mem-
branes. Lack of secondary-structure change in the
complex in the presence of Myr
2
PtdCho vesicles
reflects either a complete lack of, or weak binding of,
the complex to the membranes. This is in complete
agreement with the surface properties of the solution
structure of the complex. The behavior of ESAT-6 is
very interesting. At 25 °C, it is probably weakly
bound to the surface of Myr
2
PtdCho vesicles. Binding
Stability of ESAT-6–CFP-10 complex A. K. Meher et al.
1456 FEBS Journal 273 (2006) 1445–1462 ª 2006 The Authors Journal compilation ª 2006 FEBS
to Myr
2
PtdCho vesicles correlates well with the ANS
binding, which indicates a solvent-exposed hydropho-
bic patch. At 25 °C, Myr
2
PtdCho vesicles are already
in liquid crystalline state. Therefore, on increasing the
temperature from 25 °Cto37°C, the major change
expected is the unfolding of ESAT-6. This suggests
that unfolding of ESAT-6 in the presence of Myr
2
Ptd-
Cho vesicles at the physiological temperature of 37 °C
may lead to a structural transition which may cause a
deeper integration of ESAT-6 in the lipid membrane.
Both CFP-10 and ESAT-6 form highly helical struc-
tures in the presence of dodecylphosphocholine (DPC)
micelles (data not shown). However, mixing of CFP-
10 ⁄ DPC micelles and ESAT-6 ⁄ DPC micelles did not
produce any further conformational change (our
unpublished CD and NMR results), indicating that, in
the presence of DPC, ESAT-6 and CFP-10 do not
bind to each other. The same principle can perhaps be
extended to the phospholipid membranes. It is likely
that ESAT-6 bound to phospholipid membranes
would not interact with CFP-10. Therefore, at least
one probable outcome of the interaction of ESAT-6
with membranes is sequestration of ESAT-6 at the cell
membrane. Binding to CFP-10 or phospholipid mem-
branes are two mutually exclusive and competing
options for ESAT-6 secreted in the host cell. Our
study of binding of ESAT-6 to Myr
2
PtdCho mem-
branes presents a model that can be extended to either
artificial membranes composed of different phospholi-
pids and cholesterol or membranes derived from var-
ious host cells. Such a characterization would be a
prerequisite for a meaningful interpretation of the role
of ESAT-6, if any, in host cell lysis, and consequently
in M. tuberculosis virulence.
Secretion of ESAT-6 and CFP-10 is dependent on
an intact Esx-1 system and Esx-1 associated protein
EspA and is essential for both virulence and specific
T-cell response. Recently, Brodin et al. [11] have
shown that M. tuberculosis H37Rv mutants with
mutations of ESAT-6 that prohibit complex formation
with CFP-10, for example L28A ⁄ L29S, W43R, and
G45T, also show very poor immunogenic response
and attenuated virulence. With the view of disrupting
complex formation, we introduced mutations in
ESAT-6 by substituting a hydrophobic interfacial resi-
due (except for G32) with a charged residue. These
four residues, L29, G32, A41 and L65, were selected
on the basis of strong intermolecular NOEs between
their amide protons and the side chain protons of res-
idues of CFP-10. These residues are among the inter-
facial residues of ESAT-6 reported by Renshaw et al.
[9]. The A41D and G32D mutations had no affect on
complex formation. For L29D, complex formation
was weak, whereas for L65D, it was completely dis-
rupted. However, only the A41D mutant interacted
with phospholipid membranes in a manner similar to
wild-type ESAT-6, whereas significant binding was
not detected for the other three mutants. The A41D
mutant has a molten globular structure and binds
ANS just like the wild-type ESAT-6, whereas for the
other three mutants there is no significant binding of
ANS (data not shown). This suggests that a molten
globular state is necessary for interaction with phos-
pholipid membranes.
Our results can be discussed with reference to the
model of coiled-coil motifs consisting of heptad repeats
for the ESAT-6–CFP-10 complex proposed by Brodin
et al. [11]. As per their model, residues at position ‘a’
and ‘d’ of the four helices (the N-terminal and C-ter-
minal helices of ESAT-6 and CFP-10) are hydrophobic
and form the interface between the two proteins, resi-
dues at position ‘e’ and ‘g’ are generally polar and are
responsible for specificity of interactions between the
neighboring helices, whereas residues at positions ‘b’,
‘c’ and ‘f’ are at the outer surface of the helix and can-
not possibly interact with residues of other helices.
Our finding that ESAT-6 mutants L29D and L65D do
not form a complex with CFP-10 is consistent with the
model. L29D occupies position ‘a’ in the N-terminal
helix whereas L65D occupies position ‘d’ in the C-ter-
minal helix. Residue G32 occupies position ‘d’ in the
N-terminal helix. Our results show that introducing a
charged residue at this position does not cause disrup-
tion of complex formation with CFP-10. Residue A41
is almost at the terminus of the N-terminal helix and
part of a 3
10
helix as reported by Renshaw et al. [9].
Introduction of a charged residue is tolerated at this
position. In fact, the A41D mutant has a molten glob-
ular structure just like the wild-type ESAT-6 and dis-
plays exactly the same behavior in binding to CFP-10
or phospholipid membranes.
Although a role in receptor-mediated signaling has
been suggested for the complex, no receptor has been
discovered yet. In view of this, mutational analysis can
be very useful in understanding the structural require-
ments for secretion as well as for mediating virulence.
As ESAT-6 and CFP-10 are small proteins and there is
no post-translation modification of any functional con-
sequence of these proteins in M. tuberculosis, the pro-
teins expressed in Escherichia coli or Mycobacterium
smegmatis can serve equally well for the in vitro studies.
Our approach of evaluating precise thermodynamic
parameters of complex formation using ITC can be
used to compare binding strength for a large number of
ESAT-6 and CFP-10 mutants in vitro. This can be fol-
lowed by selection of suitable candidates for functional
A. K. Meher et al. Stability of ESAT-6–CFP-10 complex
FEBS Journal 273 (2006) 1445–1462 ª 2006 The Authors Journal compilation ª 2006 FEBS 1457
studies of the type reported by Brodin et al. [11].
Such a rational approach would reduce the number
of experiments performed on animals. This kind of
mutational analysis can also be immensely useful in
selection of a mutant RD1-complemented BCG strain
that has accentuated immunogenic but poor virulence
characteristics.
In conclusion, we followed the putative events start-
ing from the expression of ESAT-6 and CFP-10 to
their functional activity. Overall, complex formation
results in structural changes, enhanced thermodynamic
and biochemical stability, and loss of binding to
phospholipid membranes. These features of complex
formation are likely to determine the physiological role
of CFP-10, ESAT-6 and ⁄ or the complex in vivo. Our
study provides the essential groundwork on the basis
of which further mutational analysis of ESAT-6 and
CFP-10 can be performed for the selection of a more
potent RD1-complemented BCG vaccine.
Experimental procedures
Materials
Expression vectors pET22b and pET28b were obtained
from Novagen (Darmstadt, Germany). Vector pQE60 was
from Qiagen (Hilden, Germany). Oligonucleotides for gene
isolation were bought from Sigma-Genosys (Bangalore,
Karnataka, India). Restriction endonucleases, T4 DNA
ligase and DNA size markers were from New England Bio-
labs (Beverly, MA, USA). Taq polymerase and other rea-
gents for PCR, and the Plasmid Miniprep kit, the
Maxiprep kit and the Gel extraction kit used for plasmid
preparations and DNA purification processes, respectively,
were obtained from Qiagen. [
15
N]Ammonium sulfate,
d-[
13
C]glucose, d-[
2
H
7
,
13
C]glucose, and D
2
O (99.92%) used
for labeling of the proteins were obtained from Cambridge
Isotope Limited, Inc. (Andover, MA, USA). Nickel ⁄ nitrilo-
triacetic acid (Ni ⁄ NTA) superflow metal-affinity chroma-
tography matrix was obtained from Qiagen. For protein
concentration, Amicon YM-3 ultrafiltration membrane was
used (molecular mass cut-off 3 kDa; Millipore (India) Pvt.
Ltd, Bangalore, India). The rest of the chemical reagents
were from Sigma (New Delhi, India) and SRL (Mumbai,
Maharashtra, India).
Cloning, overexpression and purification of
CFP-10 and ESAT-6
Genomic DNA of M. tuberculosis H37Rv was prepared as
described by Kremer et al. [21]. The genes esxB (CFP-10)
and esxA (ESAT-6) were isolated by PCR using oligonucleo-
tide primers. EsxA was subcloned into pET22b, and esxB
was cloned into pET28b. This cloning strategy added a
sequence of eight additional residues (Leu-Glu-His-His-
His-His-His-His) at the C-terminus of ESAT-6, and a
sequence of 13 residues (Lys-Leu-Ala-Ala-Ala-Leu-Glu-His-
His-His-His-His-His) at the C-terminus of CFP-10. Un-
tagged CFP-10 was prepared by PCR amplification of esxB
containing a stop codon in the reverse primer and cloning
the resulting PCR product in pQE60. Mutants of ESAT-6
were prepared as described previously [22] and were sub-
cloned into pET22b. The clones were verified by DNA
sequencing. The vectors containing esxA, esxB and esxA
mutants were then transformed into BL21 (kDE3) E. coli
cells and grown in Luria–Bertani medium supplemented
with either kanamycin (for the expression of CFP-10) or
ampicillin (for the expression of ESAT-6 and ESAT-6
mutants). The pQE60 vector containing untagged CFP-10
was transformed into E. coli M15 cells and grown in Luria–
Bertani medium containing both ampicillin and kanamycin.
BL21 (kDE3) cells containing the plasmid pET28b-CFP-
10 were grown in Luria–Bertani medium and induced at
A
600
¼ 1.0 with a final concentration of 600 lm isopropyl
b-d-thiogalactopyranoside and grown further for 3 h.
C-Terminal hexa-histidine-tagged CFP-10 was purified over
Ni ⁄ NTA matrix using a standard protocol. The column
fractions were checked for purity by SDS ⁄ PAGE (15%
gel), and the fractions containing more than 80% pure pro-
tein were pooled. The pooled fractions were dialyzed
against buffer A (20 mm NaH
2
PO
4
,1mm EDTA, 1 mm
phenylmethanesulfonyl fluoride, pH 6.5) and loaded on a
10-mL Q-Sepharose Fast Flow (GE Healthcare, Little
Chalfont, UK) column pre-equilibrated with same buffer.
The protein was collected in the flow through and was
more than 95% pure. Purified CFP-10 was dialyzed against
20 mm NaH
2
PO
4
⁄ 50 mm NaCl ⁄ 0.1% NaN
3
, pH 6.5, and
concentrated by ultrafiltration using Amicon ultrafiltration
membranes. Protein concentration was determined using
Bradford reagent and the sample was stored at 4 °C. The
yield of the purified CFP-10 was 8 mg per liter of culture.
Untagged CFP-10 was expressed in a similar way to that
described above. After harvesting, the cell pellet was sus-
pended in 20 mm NaH
2
PO
4
buffer, pH 6.5, containing
50 mm NaCl and 1 mm phenylmethanesulfonyl fluoride,
and lysed. The lysate was centrifuged at 16 060 g for
30 min, and the clear supernatant thus obtained was passed
through 0.2-lm filter and stored at 4 °C before use.
For the expression of ESAT-6, BL21 (kDE3) cells con-
taining the plasmid pET22b-ESAT-6 were grown in Luria–
Bertani medium and induced at A
600
¼ 0.6 with a final
concentration of 500 lm isopropyl b-d-thiogalactopyrano-
side, and grown further for 6 h. C-Terminal hexa-histidine-
tagged ESAT-6 was purified on a Ni ⁄ NTA superflow
column, under denaturing conditions, as per the manufac-
turer’s instructions except that NaCl and guanidine hydro-
chloride were excluded from the buffer. Purity of the
protein in the eluted fractions was determined by
SDS ⁄ PAGE (15% gel). Fractions of > 95% purity were
Stability of ESAT-6–CFP-10 complex A. K. Meher et al.
1458 FEBS Journal 273 (2006) 1445–1462 ª 2006 The Authors Journal compilation ª 2006 FEBS
pooled, and the protein was refolded by dialysis as des-
cribed previously [8]. Refolded ESAT-6 was dialyzed
against buffer (20 mm NaH
2
PO
4
,50mm NaCl, 0.1%
NaN
3
, pH 6.5), and concentrated by ultrafiltration through
Amicon YM3 membranes. The protein concentration was
estimated using Bradford reagent. Yield of purified ESAT-6
was % 30 mg per liter of culture. This sample stored at 4 °C
was stable for several months. For the pull-down assay, the
refolded protein was dialyzed against 20 mm NaH
2
PO
4
buffer, pH 6.5, containing 50 mm NaCl and 1 mm phenyl-
methanesulfonyl fluoride. The ESAT-6 mutants were
processed in a similar way and dialyzed against 20 mm
NaH
2
PO
4
⁄ 50 mm NaCl ⁄ 1mm phenylmethanesulfonyl
fluoride, pH 6.5, before storing at 4 °C.
Uniformly
15
N and
13
C,
15
N-labeled ESAT-6 and CFP-10
were prepared by growing the cells in M9 minimal medium
containing [
15
N]ammonium sulfate and ⁄ or [
13
C]glucose as
the sole source of nitrogen and carbon, respectively, and
purified as described above. Uniformly
2
H,
13
C,
15
N-labeled
ESAT-6 was prepared by growing the cells in M9 medium
containing D
2
O in place of water, [
15
N]ammonium sulfate
and d-[
2
H,
13
C]glucose. All labeled samples were dialyzed
against the NMR buffer (20 mm NaH
2
PO
4
,50mm NaCl,
0.1 mm NaN
3
, pH 6.5). The 1 : 1 ESAT-6–CFP-10 complex
was prepared by mixing equimolar amounts of free ESAT-6
and CFP-10.
ITC
ITC experiments were performed at 25 °C on a VP-ITC
calorimeter from MicroCalä (Northampton, MA, USA).
The calorimeter was calibrated according to the user man-
ual of the instrument. Stock solutions of both proteins were
dialyzed extensively against the phosphate buffer (20 mm
NaH
2
PO
4
,50mm NaCl, 1 mm EDTA, pH 6.5) and
degassed for 20 min before each of the ITC experiments.
Titrations were performed at least in duplicate using the
same set of stock solutions. The ITC experiments were per-
formed by adding aliquots of CFP-10 to ESAT-6. The sam-
ple cell was filled with 1.3 mL 0.042 mm of ESAT-6
(titrand) and titrated against CFP-10, which was filled in
the syringe at a concentration of 0.42 mm. Sixty-five injec-
tions with an injection volume of 4 lL each were made at
intervals of 4 s. During the titration, the reaction mixture
was continuously stirred at 400 r.p.m. Control experiments
were performed by injecting CFP-10 into buffer under con-
ditions exactly similar to the ESAT-6 ⁄ CFP-10 titration, to
take into account heats of dilution and viscous mixing. The
heats of injection of the control experiment were subtracted
from the raw data of ESAT-6 and CFP-10 titration. The
ITC data were analyzed using the origin version 7.0 soft-
ware provided by Microcal. The heats of binding were nor-
malized with respect to the titrant concentration, and a
volume correction was performed to take into account dilu-
tion of titrand during each injection. The amount of heat
produced per injection was calculated by integration of
the area under each peak using a baseline selected by the
origin program.
DSC
DSC experiments were carried out on a VP-DSC calori-
meter from MicroCal. The calorimeter was calibrated
according to the user manual of the instrument. The volume
of reference and sample cells was 0.51 mL. The phosphate
buffer used in all experiments and buffer–buffer baseline
run was recorded before each sample run under exactly simi-
lar conditions. ESAT-6–CFP-10 complex was extensively
dialyzed against phosphate buffer and brought to a concen-
tration of 0.105 mm. Both the sample and buffer solutions
were thoroughly degassed for 20 min just before the experi-
ment. DSC scans were performed from 20 to 80 °C at four
different heating rates of 20, 40, 60 and 90 °C per hour.
After being heated up to 80 °C, the samples were cooled to
20 °C and rescanned. Degassing during the experiment was
prevented by an additional constant pressure of 2 atm
(203 kPa) over the liquid solutions in the cells. Buffer scans
were subtracted from the sample scans, and the data was
normalized with respect to protein concentration, scan rate,
and electrical calibration of the calorimeter, to generate the
excess heat capacity vs. temperature thermogram of the
sample. The baselines before and after transition were selec-
ted for the thermogram with the origin 7.0 program, and
the transition enthalpy, T
m
and T
1 ⁄ 2
were determined by
integration and nonlinear curve fitting to a two-state model.
CD spectroscopy
CD measurements were carried out on a Jasco spectropola-
rimeter model J-810 fitted with a thermostatically controlled
cell holder with an accuracy of ± 0.1 °C. Calibration of
the spectropolarimeter was performed with (+)-10-cam-
phorsulfonic acid. The CD results were expressed as mean
residue ellipticity (MRE), in degreeÆcm
)2
Ædmol
)1
, calculated
as follows:
½MRE¼ðh  100  MÞ=ðc  d  N
A
Þ
where h ¼ observed ellipticity in degrees, c ¼ protein con-
centration in mgÆmL
)1
, d ¼ path length in cm, M ¼ protein
molecular mass, and N
A
¼ number of amino-acid residues.
ESAT-6 consists of 103 residues (10 970 Da) and CFP-10
consists of 113 residues (12 315 Da). The percentage of
a-helical content was determined by K2d program.
Isothermal wavelength scan of protein samples was car-
ried out at the indicated temperatures, with a scan rate of
10 nmÆmin
)1
in the wavelength range 250–200 nm, response
time 1 s, data pitch of 0.5, at two protein concentrations of
3 lm and 6 lm using a quartz cell of path length 2 mm.
Three scans were averaged for each spectrum. All spectra
A. K. Meher et al. Stability of ESAT-6–CFP-10 complex
FEBS Journal 273 (2006) 1445–1462 ª 2006 The Authors Journal compilation ª 2006 FEBS 1459
were corrected by subtracting the buffer background. Phos-
phate buffer was used during the recording of CD spectra.
Thermal denaturation studies were performed by record-
ing spectra of protein samples at various temperatures ran-
ging from 25 °Cto70°C, with a 5 °C increment. Samples
were incubated for 10 min at each temperature before
recording of the spectra. The fraction of protein folded cor-
responding to fractional helicities observed at mean residue
ellipticity values at 222 nm were calculated by the equation
[23]:
ð½h
obs
À½h
den
Þ=ð½h
nat
À½h
den
Þ
where [h]
obs
is the experimentally observed mean residue
ellipticity at 222 nm, [h]
nat
and [h]
den
are mean residue ellip-
ticities at 222 nm when the protein is in its native state (at
25 °C, in phosphate buffer) and in its fully denatured state
(at 70 °C, in phosphate buffer). CD unfolding curves were
produced by plotting fraction of protein folded against tem-
perature. Each thermal denaturation experiment was repea-
ted at least twice with fresh samples. In all cases, after the
heating experiment, the samples were tested for their trans-
parency.
To study the effect of lipid vesicles on the conformation
of proteins, far-UV CD spectra of the protein samples were
recorded in the presence of 0.5 mm Myr
2
PtdCho vesicles.
Myr
2
PtdCho (Sigma, St Louis, MO, USA) was used for
preparation of lipid vesicles: 1 mg Myr
2
PtdCho was dis-
solved in chloroform and dried under a continuous stream
of nitrogen to form a film on the inner walls of a glass test
tube. The lipid film was vacuum dried for 2 h and suspen-
ded in phosphate buffer. The suspension was incubated at
37 °C for 30 min, vortex-mixed and sonicated with a 3 mm
probe (Bransonic, Danbury, CT, USA) at room tempera-
ture until a clear solution was observed. The sample was
centrifuged for 10 min at 16 060 g at room temperature to
remove titanium particles. The supernatant was removed
and used for the CD experiments.
NMR spectroscopy
NMR spectra were recorded with 1 mm protein samples [in
20 mm sodium phosphate (pH 6.5) ⁄ 50 mm NaCl ⁄ 0.1%
sodium azide; and 5% (v ⁄ v)
2
H
2
O] on a Varian 600-MHz
spectrometer equipped with triple nuclei inverse probe, at
30 °C. 2D
15
N-
1
H-HSQC spectra were recorded for follow-
ing samples:
15
N-labeled CFP-10,
15
N-labeled ESAT-6,
15
N-labeled CFP-10 + unlabeled ESAT-6,
15
N-labeled
ESAT-6 + unlabeled CFP-10 and
15
N-labeled CFP-10 +
15
N-labeled ESAT-6. For thermal unfolding or refolding
studies, 2D
15
N-
1
H-HSQC spectra with 1 mm
15
N-labeled
ESAT-6–
15
N-labeled CFP-10 complex were recorded on a
Bruker 500-MHz spectrometer at 30, 40, 50, 55, 60 and
65 °C, after which HSQC spectra on the same sample were
recorded at 60, 55, 50, 40 and 30 °C. The HSQC spectrum
for each experiment was acquired with 1024 and 128 com-
plex points in the
1
H and
15
N dimensions, respectively. The
2D data were zero-filled to 2048 and 1024 points along
1
H
and
15
N dimensions, respectively, and apodized with 60°
shifted sine-square-bell window function along both dimen-
sions before Fourier transformation. The spectral data were
processed using felix 2002 (Accelrys, Bangalore, India)
and analyzed using xeasy [24].
Backbone assignments for ESAT-6 were obtained for a
sample of 1 : 1 complex of
2
H,
13
C,
15
N-labeled ESAT-6 and
13
C,
15
N-labeled CFP-10 at 30 °C, from triple-resonance
experiments HNCA, HN(CA)CB and HN(CA)CO, and
15
N-edited NOESY-HSQC. A mixing time of 150 ms was
used for the NOESY experiment, and the time domain data
were acquired with 1024, 80, and 32 points in the
1
H
(direct),
1
H (indirect), and
15
N dimensions, respectively.
The fid were zero-filled to 1024, 512 and 128 points. All
dimensions were apodized with a 60° shifted squared sine-
bell window function and Fourier transformed.
Limited proteolysis and western blotting
ESAT-6, CFP-10 and the 1 : 1 complex of ESAT-6–CFP-10
(40 lm in 500 lL) were incubated with 1 lL1mgÆmL
)1
trypsin at 4 °C. The reactions were performed in 20 mm
Na
2
HPO
4
⁄ 50 mm NaCl, pH 7.6. Aliquots (50 lL) of each
reaction mixture were removed at time points 0, 1, 5, 20, 40,
60, 120 and 180 min. The proteolysis reactions were stopped
by precipitating proteins with 10% trichloroacetic acid, and
then the samples were analyzed by SDS ⁄ PAGE (15% gel).
The fragments obtained on SDS⁄ PAGE were transferred
to a nitrocellulose membrane by applying 350 mA current
for 4 h in Tris ⁄ glycine ⁄ methanol buffer. The transferred
bands on the membrane were initially detected by Ponceau
S staining. After destaining of the membrane, it was
blocked with skimmed milk, and rabbit anti-histidine IgG
was added to it. Excess antibody was removed by washing
the membrane with 1 · NaCl ⁄ P
i
containing 0.05% Tween
20. The membrane was subsequently treated with horserad-
ish peroxidase-conjugated secondary antibody. Excess sec-
ondary antibody was removed with 1 · NaCl ⁄ P
i
⁄ Tween 20
buffer. The blot was developed with 10 mL 1 · NaCl ⁄ P
i
containing 10 mg 3,3¢-diaminobenzidine tetrahydrochloride,
10 mg imidazole and 6 lLH
2
O
2
.
Fluorescence spectroscopy
Fluorescence spectra were acquired at 25 °C, on a Perkin–
Elmer Life Sciences LS 50B spectroluminescencemeter,
using a 5-mm path length quartz cell. ANS stock solution
was prepared in phosphate buffer, and the concentration
of ANS was determined using the absorption coefficient
(e) ¼ 8000 m
)1
Æcm
)1
at 372 nm [25]. The samples were kept
in the dark immediately after the addition of ANS stock
solution to the proteins, and measurements were made
within an hour. The ANS-binding experiments were carried
Stability of ESAT-6–CFP-10 complex A. K. Meher et al.
1460 FEBS Journal 273 (2006) 1445–1462 ª 2006 The Authors Journal compilation ª 2006 FEBS
out at the excitation maximum of ANS, i.e. 380 nm, and
emission spectra were recorded in the range 400–600 nm,
with a slit width of 12 nm for excitation and 10 nm for
emission. The concentration of the protein samples was
10 lm, and the molar ratio of protein to ANS was 1 : 10 in
all experiments.
CFP-10 pull-down assay
A 0.5-m Ni ⁄ NTA column was equilibrated with 20 mm
NaH
2
PO
4
⁄ 50 mm NaCl ⁄ 1mm phenylmethanesulfonyl
fluoride, pH 6.5. Then 0.5 mg refolded tagged ESAT-6 in
20 mm NaH
2
PO
4
⁄ 50 mm NaCl ⁄ 1mm phenylmethanesulfo-
nyl fluoride, pH 6.5 buffer was passed through the column,
followed by washing with equilibration buffer. Excess
E. coli lysate containing untagged CFP-10 was allowed to
pass through the column. Then the column was extensively
washed with 20 mm NaH
2
PO
4
⁄ 300 mm NaCl ⁄ 1mm phe-
nylmethanesulfonyl fluoride ⁄ 20 mm imidazole, pH 6.5. The
proteins bound to the column were eluted with 20 mm
NaH
2
PO
4
⁄ 300 mm NaCl ⁄ 250 mm imidazole ⁄ 1mm phenyl-
methanesulfonyl fluoride, pH 6.5. In a similar way, binding
of untagged CFP-10 to the mutants of ESAT-6 were indi-
vidually tested on the Ni ⁄ NTA column. The eluted frac-
tions were analyzed by SDS ⁄ PAGE (15% gel).
Acknowledgements
We gratefully acknowledge Dr C. M. Gupta, Director,
Central Drug Research Institute for his constant sup-
port during the studies. We thank Dr S. Sinha and Dr
G. Palit, CDRI, for providing the M. tuberculosis
H37Rv culture, and help with fluorescence experi-
ments, respectively. A.K.M. and N.C.B are recipients
of research fellowships from the Indian Council of
Medical Research, New Delhi, and the Council of Sci-
entific and Industrial Research, New Delhi, respect-
ively. The facilities provided by the National Facility
for High Field NMR, supported by the Department of
Science and Technology (DST), Department of Bio-
technology (DBT), Council of Scientific and Industrial
Research (CSIR), and Tata Institute of Fundamental
Research, Mumbai, India, are gratefully acknow-
ledged. This work was supported by the MLP 0007
project of CDRI.
References
1 Behr MA, Wilson MA, Gill WP, Salamon H, Schoolnik
GK, Rana S & Small PM (1999) Comparative genomics
of BCG vaccines by whole-genome DNA microarray.
Science 284, 1520–1523.
2 Pym AS, Brodin P, Majlessi L, Brosch R, Demangel C,
Williams A, Griffiths KE, Marchal G, Leclerc C & Cole
ST (2003) Recombinant BCG exporting ESAT-6 confers
enhanced protection against tuberculosis. Nat Med 9,
533–539.
3 van Pinxteren LA, Ravn P, Agger EM, Pollock J &
Andersen P (2000) Diagnosis of tuberculosis based on
the two specific antigens ESAT-6 and CFP10. Clin
Diagn Lab Immunol 7, 155–160.
4 Stanley SA, Raghavan S, Hwang WW & Cox JS (2003)
Acute infection and macrophage subversion by Myco-
bacterium tuberculosis require a specialized secretion sys-
tem. Proc Natl Acad Sci USA 28, 13001–13006.
5 Gao LY, Guo S, McLaughlin B, Morisaki H, Engel JN
& Brown EJ (2004) A mycobacterial virulence gene clus-
ter extending RD1 is required for cytolysis, bacterial
spreading and ESAT-6 secretion. Mol Microbiol 53,
1677–1693.
6 Fortune SM, Jaeger A, Sarracino DA, Chase MR, Sas-
setti CM, Sherman DR, Bloom BR & Rubin EJ (2005)
Mutually dependent secretion of proteins required for
mycobacterial virulence. Proc Natl Acad Sci USA 102,
10676–10681.
7 Berthet FX, Rasmussen PB, Rosenkrands I, Andersen P
& Gicquel B (1998) A Mycobacterium tuberculosis
operon encoding ESAT-6 and a novel low-molecular-
mass culture filtrate protein (CFP-10). Microbiology
144, 3195–3203.
8 Renshaw PS, Panagiotidou P, Whelan A, Gordon SV,
Hewinson RG, Williamson RA & Carr MD (2002)
Conclusive evidence that the major T-cell antigens of
the Mycobacterium tuberculosis complex ESAT-6 and
CFP-10 form a tight 1:1 complex and characterization
of the structural properties of ESAT-6, CFP-10, and the
ESAT-6-CFP-10 complex. Implications for pathogenesis
and virulence. J Biol Chem 277, 21598–21603.
9 Renshaw PS, Lightbody KL, Veverka V, Muskett FW,
Kelly G, Frenkiel TA, Gordon SV, Hewinson RG,
Burke B, Norman J, et al. (2005) Structure and function
of the complex formed by the tuberculosis virulence fac-
tors CFP-10 and ESAT-6. EMBO J 24, 2491–2498.
10 Lightbody LK, Renshaw PS, Collins ML, Wright RL,
Hunt DM, Gordon SV, Hewinson RG, Buxton RS,
Williamson RA & Carr MD (2004) Characterisation of
complex formation between members of the Mycobac-
terium tuberculosis complex CFP-10 ⁄ ESAT-6 protein
family: towards an understanding of the rules governing
complex formation and thereby functional flexibility.
FEMS Microbiol Lett 238, 255–262.
11 Brodin P, de Jonge MI, Majlessi L, Leclerc C, Nilges
M, Cole ST & Brosch R (2005) Functional analysis of
ESAT-6, the dominant T-cell antigen of Mycobacterium
tuberculosis, reveals key residues involved in secretion,
complex-formation, virulence and immunogenicity.
J Biol Chem 280, 33953–33959.
12 Hsu T, Hingley-Wilson SM, Chen B, Chen M, Dai AZ,
Morin PM, Marks CB, Padiyar J, Goulding C, Gingery
A. K. Meher et al. Stability of ESAT-6–CFP-10 complex
FEBS Journal 273 (2006) 1445–1462 ª 2006 The Authors Journal compilation ª 2006 FEBS 1461
M, et al. (2003) The primary mechanism of attenuation
of bacillus Calmette-Guerin is a loss of secreted lytic
function required for invasion of lung interstitial tissue.
Proc Natl Acad Sci USA 100, 12420–12425.
13 Guinn KM, Hickey MJ, Mathur SK, Zakel KL, Grot-
zke JE, Lewinsohn DM, Smith S & Sherman DR (2004)
Individual RD1-region genes are required for export of
ESAT-6 ⁄ CFP-10 and for virulence of Mycobacterium
tuberculosis. Mol Microbiol 51, 359–370.
14 Sinha S, Kosalai K, Arora S, Namane A, Sharma P,
Gaikwad AN, Brodin P & Cole ST (2005) Immunogenic
membrane-associated proteins of Mycobacterium tuber-
culosis revealed by proteomics. Microbiology 151, 2411–
2419.
15 Pierce MM, Raman CS & Nall BT (1999) Isothermal
titration calorimetry of protein–protein interactions.
Methods 19, 213–221.
16 Filfil R & Chalikian TV (2003) The thermodynamics of
protein-protein recognition as characterized by a combi-
nation of volumetric and calorimetric techniques: the
binding of turkey ovomucoid third domain to alpha-
chymotrypsin. J Mol Biol 326, 1271–1288.
17 Knapp S, Zamai M, Volpi D, Nardese V, Avanzi N,
Breton J, Plyte S, Flocco M, Marconi M, Isacchi A
et al. (2001) Thermodynamics of the high-affinity inter-
action of TCF4 with beta-catenin. J Mol Biol 306,
1179–1189.
18 Jelesarov I & Bosshard HR (1999) Isothermal titration
calorimetry and differential scanning calorimetry as
complementary tools to investigate the energetics of bio-
molecular recognition. J Mol Recognit 12, 3–8.
19 Natarajan K, Latchumanan VK, Singh S, Singh S &
Sharma P (2003) Down-regulation of T helper 1
responses to mycobacterial antigens due to maturation
of dendritic cells by 10-kDa mycobacterium tuberculosis
secretory antigen. J Infect Dis 187, 914–928.
20 Marei A, Ghaemmaghami A, Renshaw P, Wiselka M,
Barer M, Carr M, Ziegler-Heitbrock L (2005) Superior
T cell activation by ESAT-6 as compared with the
ESAT-6-CFP-10 complex. Int Immunol 17, 1439–1446.
21 Kremer L, Baulard A, Estaquier J, Poulain-Godefroy O
& Locht C (1995) Green fluorescent protein as a new
expression marker in mycobacteria. Mol Microbiol 17,
913–922.
22 Higuchi R, Krummel B & Saiki RK (1988) A general
method of in vitro preparation and specific mutagenesis
of DNA fragments: study of protein and DNA interac-
tions. Nucleic Acids Res 16, 7351–7367.
23 Muhle-Goll C, Nilges M & Pastore A (1995) The leu-
cine zippers of the HLH-LZ proteins Max and c-Myc
preferentially form heterodimers. Biochemistry 34,
13554–13564.
24 Bartels C, Xia T, Billeter M, Guntert P & Wuthrich K
(1995) The program XEASY for computer supported
NMR spectral analysis of biological macromolecules.
J Biomol NMR 6, 1–10.
25 Muro-Pastor MI, Barrera FN, Reyes JC, Florencio FJ
& Neira JL (2003) The inactivating factor of glutamine
synthetase, IF7, is a ‘natively unfolded’ protein. Protein
Sci 12, 1443–1454.
Stability of ESAT-6–CFP-10 complex A. K. Meher et al.
1462 FEBS Journal 273 (2006) 1445–1462 ª 2006 The Authors Journal compilation ª 2006 FEBS