Báo cáo khoa học: Determining and understanding the control of glycolysis in fast-growth tumor cells Flux control by an over-expressed but strongly product-inhibited hexokinase pdf
Bạn đang xem bản rút gọn của tài liệu. Xem và tải ngay bản đầy đủ của tài liệu tại đây (209.72 KB, 14 trang )
Determining and understanding the control of glycolysis
in fast-growth tumor cells
Flux control by an over-expressed but strongly product-inhibited
hexokinase
Alvaro Marı
´
n-Herna
´
ndez
1
, Sara Rodrı
´
guez-Enrı
´
quez
1
, Paola A. Vital-Gonza
´
lez
1
, Fanny L. Flores-
Rodrı
´guez
1
, Marina Macı
´as-Silva
2
, Marcela Sosa-Garrocho
2
and Rafael Moreno-Sa
´
nchez
1
1 Instituto Nacional de Cardiologı
´
a, Departamento de Bioquı
´
mica, Juan Badiano no. 1, Colonia Seccio
´
n XVI, Me
´
xico, Mexico
2 Instituto de Fisiologı
´
a Celular, Departamento de Biologı
´
a Celular, Universidad Nacional Auto
´
noma de Me
´
xico, Mexico
It is well documented that fast-growth tumor cells have
higher rates of lactate formation even under aerobic
conditions than nontumorigenic cells. For instance, dif-
ferent types of hepatoma (Reuber, Morris, Dunings
LC18) and fibrosarcoma 1929 exhibit rates of
0.2–2.7 lmol lactateÆh
)1
Æ(mg protein)
)1
, whereas normal
liver and kidney cells have rates of 0.05 lmol lactateÆ
h
)1
Æ(mg protein)
)1
[1,2].
The increase in tumor glycolysis has been associated
with the activation of several oncogenes (c-myc, ras and
src) or with the expression of the hypoxia-inducible
factor (HIF-1a) in transformed human lymphoblastoid
Keywords
elasticity coefficient; flux-control coefficient;
hexokinase type 2; metabolic control
analysis; phosphofructokinase type 1
Correspondence
R. Moreno-Sa
´
nchez, Instituto Nacional de
Cardiologı
´
a, Departamento de Bioquı
´
mica,
Juan Badiano no. 1, Col. Seccio
´
n XVI,
Tlalpan, Me
´
xico 14080, Mexico
Fax: 52 55 55730926
Tel: 52 55 55732911 ext. 1422, 1298
E-mail: ,
(Received 17 October 2005, revised 21
February 2006, accepted 3 March 2006)
doi:10.1111/j.1742-4658.2006.05214.x
Control analysis of the glycolytic flux was carried out in two fast-growth
tumor cell types of human and rodent origin (HeLa and AS-30D, respect-
ively). Determination of the maximal velocity (V
max
) of the 10 glycolytic
enzymes from hexokinase to lactate dehydrogenase revealed that hexokin-
ase (153–306 times) and phosphfructokinase-1 (PFK-1) (22–56 times) had
higher over-expression in rat AS-30D hepatoma cells than in normal
freshly isolated rat hepatocytes. Moreover, the steady-state concentrations
of the glycolytic metabolites, particularly those of the products of hexo-
kinase and PFK-1, were increased compared with hepatocytes. In HeLa
cells, V
max
values and metabolite concentrations for the 10 glycolytic
enzyme were also significantly increased, but to a much lesser extent (6–9
times for both hexokinase and PFK-1). Elasticity-based analysis of the
glycolytic flux in AS-30D cells showed that the block of enzymes produ-
cing Fru(1,6)P
2
(i.e. glucose transporter, hexokinase, hexosephosphate
isomerase, PFK-1, and the Glc6P branches) exerted most of the flux con-
trol (70–75%), whereas the consuming block (from aldolase to lactate
dehydrogenase) exhibited the remaining control. The Glc6P-producing
block (glucose transporter and hexokinase) also showed high flux control
(70%), which indicated low flux control by PFK-1. Kinetic analysis of
PFK-1 showed low sensitivity towards its allosteric inhibitors citrate and
ATP, at physiological concentrations of the activator Fru(2,6)P
2
. On the
other hand, hexokinase activity was strongly inhibited by high, but phy-
siological, concentrations of Glc6P. Therefore, the enhanced glycolytic
flux in fast-growth tumor cells was still controlled by an over-produced,
but Glc6P-inhibited hexokinase.
Abbreviations
DHAP, dihydroxyacetone phosphate; G6PDH, glucose-6-phosphate dehydrogenase; GAPDH, glyceraldehyde-3-phosphate dehydrogenase;
GluT, glucose transporter; LDH, lactate dehydrogenase; PFK-1, phosphofructokinase type 1.
FEBS Journal 273 (2006) 1975–1988 ª 2006 The Authors Journal compilation ª 2006 FEBS 1975
and human U87 glioma [3,4]. As a result of oncogene
activation and expression, the over-expression of several
genes encoding eight glycolytic proteins, including the
glucose transporter (GluT), takes place [5]. The over-
expression of a plasma membrane H
+
-ATPase in rat
fibroblasts, to alter the cytosolic pH regulation, and pre-
sumably enhance ATP consumption, also promotes a
sevenfold stimulation of glycolysis, in addition to indu-
cing malignant transformation [6].
In comparison with hepatocytes, in several fast-
growth tumor cells (AS-30D, Novikoff) there is over-
expression of hexokinase-II [7,8], due to the activation
of its own promoter, through a demethylation process
[9] or through protein p53 activation (an abundant
protein in fast-growth tumor cells) [10].
Binding of tumoral hexokinase-II to the mitochond-
rial outer membrane apparently changes its kinetic
properties, compared with the cytosolic isoenzyme, i.e.
mitochondrial hexokinase-II shows lower sensitivity
( 30%) to inhibition by its product Glc6P [7]. The
close vicinity of hexokinase-II to the adenine nucleo-
tide translocase in tumor mitochondria ensures that
mitochondrial ATP is preferentially used for hexose
phosphorylation [8]. It has also been reported that
hexokinase-II plays an important role in preventing
apoptotic events, such as cytochrome c release in HeLa
cells, by interfering with the binding of the pro-apop-
totic protein Bax to the outer mitochondrial membrane
[11].
In normal tissues, citrate and ATP are potent allo-
steric inhibitors of phosphofructokinase type 1 (PFK-
1) [12], where it is mainly constituted by M subunits,
but this does not occur when the predominant subunit
is L or C [13]. The tumoral isoenzyme is less sensitive
to the inhibitory effect of these two allosteric effectors
[13,14]. In this regard, it has been observed that the
subunit L or C content of tumor PFK-1 increases,
whereas that of subunit M decreases, which explains
the smaller effect of its negative modulators [15–17]. It
has also been reported that the content of Fru(2,6)P
2
(a potent PFK-1 activator [12]) in HeLa cells, Ehrlich
ascites cells and HT29 human colon adenocarcinoma
is much higher than in normal hepatocytes [20–80 ver-
sus 6 pmolÆ(mg protein)
)1
, respectively] [18–21]. These
observations suggest that PKF-1 is highly active in
tumors cells [13,20].
In mammalian nontumorigenic systems, such as
human erythrocytes and rat perfused heart, glycolytic
flux is mainly controlled by hexokinase (60–80%) and
PFK-1 (20–30%) [22,23]. In tumor cells, an expected
consequence of the over-expression of several glycolyt-
ic enzymes and glucose transporters, and kinetic chan-
ges in hexokinase and PFK-1, is a large modification
of the regulatory mechanisms and fuctioning of the
pathway. Hence, the assumption that control of the
glycolytic flux in tumor cells is similar to that of nor-
mal cells is apparently not well supported. Therefore,
to identify the flux-controlling sites of tumoral glycol-
ysis, we firstly determined the V
max
of each glycolytic
enzyme from hexokinase to lactate dehydrogenase
(LDH) in AS-30D and HeLa cells. Measurement of
enzyme activity under V
max
conditions ensures the
determination of the content of active enzyme and
allows the degree of over-expression compared with
normal cells to be established. Secondly, we deter-
mined the steady-state concentrations of several inter-
mediate metabolites to identify enzymes that may
impose limitations on the glycolytic flux, although such
inferences do not always hold, particularly for interme-
diates involved in more than two reactions.
To evaluate quantitatively flux control in tumoral
glycolysis, we used the theory of the metabolic control
analysis [24] by applying an elasticity analysis. This
consists of the experimental determination of the sensi-
tivity of segments of the pathway towards a common
intermediate. Once we had identified the main sites of
flux control, we performed experiments to determine
which biochemical mechanisms are involved in estab-
lishing why some enzymes exert significant control and
others do not.
Results
Maximal activities of glycolytic enzymes in
hepatocytes and fast-growth tumor cells
In normal freshly isolated hepatocytes, the enzymes
with lower activity (and hence less content) were hexo-
kinase < PFK-1 < aldolase, enolase (Table 1). This
activity pattern is in agreement with that found in
hepatocytes by other authors [7,15]. In whole liver, the
activities of all glycolytic enzymes were very similar,
except for pyruvate kinase, which was 3 times lower
than that obtained in isolated hepatocytes (data not
shown). In an attempt to establish a proliferating, non-
tumorigenic cell system, to make a more rigorous com-
parison with the tumor cell lines used in this work, we
also isolated hepatocytes from regenerating rat liver;
organ regeneration was induced by prior treatment
with CCl
4
[0.39 gÆ(kg body weight)
)1
] for 12 or 24 h.
In two different cell preparations, the V
max
values of
the glycolytic enzymes were essentially identical with
those found for normal isolated hepatocytes (data not
shown).
In rat AS-30D hepatoma cells, the enzymes with
lower activity were hexokinase, PFK-1 and aldolase, a
Control of glycolysis in tumor cells A. Marı
´
n-Herna
´
ndez et al.
1976 FEBS Journal 273 (2006) 1975–1988 ª 2006 The Authors Journal compilation ª 2006 FEBS
pattern that also agrees with that reported for the
same cells [7] and for other tumor cell types [25]. The
AS-30D ⁄ hepatocyte activity ratio revealed that hexo-
kinase and, to a lesser extent, PFK-1 were the enzymes
that were most over-expressed in tumor cells; all other
glycolytic enzymes, including glucose-6-phosphate
dehydrogenase (G6PDH), were also over-expressed in
AS-30D tumor cells (Table 1).
In HeLa cells, all glycolytic enzymes, except phospho-
glycerate mutase, also exhibited a higher activity than
that shown by hepatocytes. However, in these human
tumor cells neither hexokinase nor PFK-1 were highly
over-expressed as they were in rodent AS-30D cells.
In HeLa cells, hexosephosphate isomerase, PFK-1,
triosephosphate isomerase and pyruvate kinase,
together with G6PDH, showed greater over-expression
compared with hepatocytes (Table 1). V
max
for phos-
phoglycerate mutase in HeLa cells was 14 and 8 times
lower than that found in AS-30D cells and hepatocytes,
respectively; such low phosphoglycerate mutase activity
has also been observed by other authors [25]. Negligible
a-glycerophosphate dehydrogenase activity was found
in both tumor cell types. A similar observation has been
described for the Morris hepatomas 3924A, 5123D,
7793 and 44 [26], which are fast or moderate-growth
tumor lines [27].
Glycolytic flux and intermediary concentrations
As expected from the general increase in glycolytic
enzymes, steady-state generation of lactate in the pres-
ence of 5 mm glucose was markedly higher in AS-30D
and HeLa cells (9–13 times) than in hepatocytes
(Table 2). In the absence of added glucose, the glyco-
lytic flux diminished drastically in both tumor cell
types, being negligible in AS-30D cells. The difference
between the rates of lactate formation with and with-
Table 1. Maximal activity of glycolytic enzymes in hepatocytes and tumor cells. AS-30D, HeLa and hepatocytes (65 mg proteinÆmL
)1
) were
incubated in lysis buffer as described in Experimental procedures. Activities of all enzymes were determined in the cytosolic-enriched frac-
tion at 37 °C. Specific activities are expressed in UÆ(mg protein)
)1
. The values shown represent the mean ± SD with the number of different
preparations assayed in parentheses. HK, hexokinase; HPI, hexosephosphate isomerase; TPI, triosephosphate isomerase; GAPDH, glyceral-
dehyde-3-phosphate dehydrogenase; PGK, phosphoglycerate kinase; PGAM, phosphoglycerate mutase; PYK, pyruvate kinase; LDH, lactate
dehydrogenase; G6PDH, glucose-6-phosphate dehydrogenase; a-GPDH, a-glycerophosphate dehydrogenase; PGM, phosphoglucomutase;
ND, not detected.
Enzymes Hepatocytes AS-30D
AS-30D ⁄
hepatocytes HeLa
HK 0.003 ± 0.002 (3) 0.46 ± 0.1** (7) 153 0.02 ± 0.006†† (4)
HPI
a
0.4 ± 0.05 (3) 1.6 ± 0.7* (4) 4 3.0 ± 1.7 (4)
PFK-1
b
0.01 ± 0.002 (3) 0.21 ± 0.1* (4) 22 0.09 ± 0.02 †(5)
Aldolase 0.09 ± 0.02 (3) 0.23 ± 0.07* (4) 2.7 0.2 ± 0.05 (5)
TPI
a
15.6 ± 5.6 (3) 56 ± 15* (4) 3.6 42 ± 13 (3)
GAPDH 0.32 ± 0.07 (3) 1 ± 0.28* (3) 2.7 2 ± 0.74 (5)
GAPDH
a
0.66 ± 0.23 (3) 0.9 (2) 1.4 2.5 ± 0.8 (5)
PGK 8.2 ± 5.8 (3) 27 ± 10* (4) 3.3 13 ± 6† (5)
PGAM 11 ± 2 (3) 20 ± 5* (4) 2.3 1.4 ± 1 (4)
Enolase 0.11 ± 0.03 (3) 0.51 ± 0.13* (3) 4.3 0.36 ± 0.15 (5)
PYK 0.8 ± 0.36 (3) 6.6 ± 1.5** (4) 8.1 3 ± 1.3 † (4)
LDH 4.4 ± 1.9 (3) 6.4 ± 3.7 (4) 1.5 1.7 ± 0.6 (3)
G6PDH 0.03 ± 0.003 (3) 0.05 ± 0.02 (3) 1.4 0.22 ± 0.08†† (5)
PGM
c
0.37 (2) 0.21 ± 0.06 (5) 0.6 0.42 ± 0.13 (4)
a-GPDH
d
0.11 (2) 0.002 ± 0.001 (3) 0.05 ND
*P<0.05 versus hepatocytes,**P<0.005 versus hepatocytes, †P < 0.05 versus AS-30D, ††P < 0.005 versus AS-30D. Student’s t-test for
nonpaired samples.
a
Activity in the reverse reaction.
b
Activity determined in the presence of 16–20 mM NH
4
+
.
c
The PGM activity was
determined in the absence of glucose-1,6- bisphosphate.
d
The reaction was started by adding DHAP.
Table 2. Glycolysis in hepatocytes and tumor cells. AS-30D and
HeLa cells (15 mg proteinÆmL
)1
) and hepatocytes (30 mg pro-
teinÆmL
)1
) were incubated in Krebs–Ringer medium as described in
Experimental procedures. Under these conditions, the rate of lac-
tate formation in AS-30D cells was constant after 2 min and up to
10 min from glucose addition (i.e. steady-state glycolysis). The
intracellular concentration of Fru(1,6)P
2
was also invariant between
the 2- and 10-min points, after the addition of glucose (data not
shown). Glycolytic fluxes are expressed in nmolÆmin
)1
Æ(mg cell pro-
tein)
)1
. The values shown represent the mean ± SD with the num-
ber of different preparations assayed in parentheses. The negative
flux value indicates lactate consumption.
Condition Hepatocytes AS-30D HeLa
+ Glucose 2.4 ± 1.7 (6) 21 ± 9 (40) 32 ± 10 (8)
– Glucose ) 0.4 ± 1 (6) ) 2.2 ± 2.6 (17)* 7 ± 9 (6)
A. Marı
´
n-Herna
´
ndez et al. Control of glycolysis in tumor cells
FEBS Journal 273 (2006) 1975–1988 ª 2006 The Authors Journal compilation ª 2006 FEBS 1977
out added glucose indicates that net glycolytic flux
depends on external glucose, which was 8–9 times
higher in AS-30D and HeLa cells than in hepatocytes.
The elevated glycolytic flux in HeLa cells in the
absence of added glucose was probably sustained by
endogenous sources, i.e. glycogen degradation. The
content of glycogen was apparently not depleted in
HeLa cells by the 10 min preincubation at 37 °C. In
contrast, the total dependence of the glycolytic flux on
external glucose in AS-30D cells suggests depletion of
glycogen induced by the 10 min preincubation at
37 °C. The glycolytic flux values reported in this work
are in the same range as reported for other tumor cell
types [2].
The steady-state concentrations of all glycolytic
metabolites in AS-30D tumor cells also significantly
increased, except for phosphoenolpyruvate and pyru-
vate (Table 3). In particular, Fru(1,6)P
2
increased 250
times and dihydroxyacetone phosphate (DHAP) 16.6
times. The cytosolic pyridine nucleotide redox state
(NADH ⁄ NAD
+
), estimated from the lactate ⁄ pyruvate
ratio, was more reduced in AS-30D cells, a situation
that favors flux through biosynthetic pathways. The
concentration of ATP was also higher in AS-30D cells
than in hepatocytes; however, the ATP ⁄ ADP ratio was
similar (2.3 and 2.4). The latter values are similar to
those previously reported [28] for normal organs such
as rat heart (5.7) and liver (4.9), as well as mouse Erhl-
ich ascites cells (2.3) and 3924A hepatoma cells (1.2).
In contrast with AS-30D cells, the steady-state con-
centrations of Glc6P, Fru6P, Fru(1,6)P
2
and DHAP
in HeLa cells were similar to those observed in hepato-
cytes, whereas the ATP and pyruvate concentrations
were 1.6 and 4 times higher than in AS-30D cells
(Table 3).
Determination of flux control coefficients for
glycolysis in hepatoma cells
Metabolic control analysis establishes how to deter-
mine quantitatively the degree of control (named flux
control coefficient, C
J
Ei
) that each enzyme Ei exerts
over the metabolic flux J [24]. In the oxidative phos-
phorylation pathway, C
J
Ei
values can be determined
by titrating the flux with specific inhibitors [24,29,30].
However, there are no specific, permeable inhibitors
for each glycolytic enzyme.
An alternative approach called elasticity analysis
[31–34] consists of experimental determination of the
sensitivity of enzyme blocks towards a common inter-
mediate metabolite m. By applying the summation and
connectivity theorems of metabolic control analysis
(see Eqns 1 and 2 in Experimental procedures), the
C
J
Ei
values can be calculated. Variations in the steady-
state activity of the enzyme blocks can be attained by
adding different concentrations of the initial substrate
or inhibitors of either block, which do not have to be
specific for only one enzyme but they do have to inhi-
bit only one block. The block of enzymes that gener-
ates the common intermediate is named the producer
block, whereas the block of enzymes consuming that
metabolite is named the consumer block.
For glycolysis, and other pathways, any metabolite
may be used as the common intermediate that con-
nects producer and consumer branches. However, to
reach consistent results, it is more convenient to use,
as common intermediates, metabolites that are present
at relatively high concentrations and that are only con-
nected to the specific pathway, such as Fru(1,6)P
2
.
Although other metabolites such as Glc6P, Fru6P and
DHAP may be present at high concentrations, they are
connected with other pathways (glycogen synthesis and
degradation, pentose phosphate cycle, glycerol and tri-
acyglycerol synthesis). However, this last group of
metabolites may still be used in elasticity-based analy-
sis as long as the flux through the other pathways is
low (or it is assumed to be negligible) [33,35,36] or by
actually determining the effect of the branching path-
ways on the main flux and on the concentration of the
connecting metabolite [23].
To determine the elasticity coefficients of the con-
sumer block for the common metabolite (e
Ei
m
), we
Table 3. Steady-state concentrations (mM) of glycolytic intermedi-
ates in normal rat hepatocytes and hepatoma cells. See legend to
Table 2 and Experimental procedures for experimental details. Val-
ues shown are the mean ± SD. The number of experiments is
shown in parentheses. ND, not detected; NM, not measured;
DHAP, dihydroxyacetone phosphate; G3P, glyceraldehyde 3-phos-
phate; PEP, phosphoenolpyruvate; Lac, lactate; Pyr, pyruvate.
Metabolite Hepatocytes AS-30D HeLa
Glucose NM 6.2 ± 1 (3) NM
Glc6P 0.96 ± 0.16 (3) 5.3 ± 2.6**(23) 0.6 ± 0.16††(4)
Fru6P 0.4 ± 0.03 (3) 1.5 ± 0.7**(22) 0.22 ± 0.09†† (4)
Fru(1,6)P
2
0.1 ± 0.05 (3) 25 ± 7.6**(19) 0.29 ± 0.06†† (4)
DHAP 0.6 ± 0.1 (3) 10 ± 2.3**(14) 0.93 ± 0.07†† (3)
G3P 0.09 ± 0.01 (3) 0.9 ± 0.4*(7) ND
PEP 0.1 (2) 0.1 ± 0.02 (3) 0.32 (2)
Pyr 1.6 ± 0.7 (3) 2.1 ± 1 (7) 8.5 ± 3.6†† (5)
Lac
a
9.6 ± 1.3 (3) 27 ± 11* (3) 33 (2)
ATP 3.6 ± 0.24 (3) 5.6 ± 1.2* (9) 9.2 ± 1.9† (4)
ADP 1.6 ± 0.6 (4) 2.4 ± 0.7 (7) 2.7 ± 1.3 (3)
Lac ⁄ Pyr ratio 6.3 12.9 3.9
a
L-Lactate was intracellularly located. *P<0.05 versus Hepato-
cytes, **P<0.005 versus Hepatocytes, †P < 0.05 versus AS-30D,
††P < 0.005 versus AS-30D.
Control of glycolysis in tumor cells A. Marı
´
n-Herna
´
ndez et al.
1978 FEBS Journal 273 (2006) 1975–1988 ª 2006 The Authors Journal compilation ª 2006 FEBS
incubated hepatoma cells with different glucose con-
centrations (4–6 mm) or with the hexosephosphate
isomerase inhibitor 2-deoxyglucose (0.5–10 mm), which
induced variations in flux and in the steady-state con-
centrations of the metabolite. The elasticity of the pro-
ducer block was determined by titrating flux with the
LDH inhibitor, oxalate (0.5–2 mm), or the glyceralde-
hyde-3-phosphate dehydrogenase inhibitor, arsenite
(5–100 lm). Thus, the glycolytic flux (measured as the
rate of lactate formation) and the concentration of
several intermediates [Glc6P, Fru6P, Fru(1,6)P
2
and
DHAP] were determined under both conditions. The
tangents to the curves, or the straight lines, taken at
the reference, control points (100%) in the normalized
plots of flux versus [metabolite] obtained with glucose
and oxalate, or 2-deoxyglucose and arsenite, represent
the elasticities towards the intermediate metabolite of
the consumer and producer blocks, respectively.
We are aware that the experimental points in the
flux versus [metabolite] plot should be fitted to a
hyperbolic curve rather than to a straight line, as most
of the glycolytic enzymes and transporters follow a
Michaelis–Menten kinetic pattern; a near-linear rela-
tion between rate and substrate concentration might
be attained when the product concentration varies con-
comitantly. However, the lack of sufficient experimen-
tal points near the reference, unaltered state may
generate high, unrealistic slope values (? 2) for the
estimation of elasticity coefficients (Fig. 1) either by fit-
ting to hyperbolic or linear equations. The definitions
of the elasticity and flux control coefficients as well as
the theorems of metabolic control analysis are based
on differentials. However, it was not easy to produce
small changes (and much less infinitesimal changes) of
flux and metabolite concentration by using the experi-
mental protocols described. In consequence, slope
values were calculated with both approximations, non-
linear hyperbolic fitting and linear regression. In gen-
eral, similar elasticity coefficients resulted from either
approximation, although less dispersion was attained
with the linear regression (see legend to Table 4 for
values).
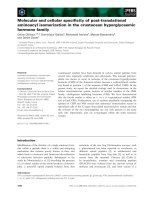
Titration of the glycolytic flux with exogenous glu-
cose and oxalate (Fig. 1A), or with 2-deoxyglucose
and arsenite (Fig. 1B), induced changes in flux and the
Fru(1,6)P
2
concentration. Analysis of both segments
showed that the Fru(1,6)P
2
consumer block (formed
by enzymes from aldolase to LDH) showed a higher
elasticity than the producer block (comprising GluT to
PFK-1). In the first case (with glucose or 2-deoxy-
glucose), the slope had a positive value because
Fru(1,6)P
2
is a substrate for the consumer block. On
the other hand, with oxalate or arsenite titration, the
slope had a negative value because Fru(1,6)P
2
is a
product of the producer block, i.e. Fru(1,6)P
2
accumu-
lation inhibits the producer activity.
60 80 100 120 140
0
40
80
120
160
% Glycolysis% Glycolysis
% F-1,6-BP
+ Oxalate
50 100 150 200 250 300 350
20
40
60
80
100
% F-1,6-BP
+ 2DOG
+Arsenite
A
B
+ Glucose
m = -1.7
m = 3.56
m = -0.17
m = 1.14
Fig. 1. Experimental determination of elasticity coefficients for glyc-
olytic intermediates in tumor cells. AS-30D hepatoma cells (15 mg
proteinÆmL
)1
) were incubated in Krebs–Ringer medium at 37 °C.
After 10 min, different concentrations of glucose (s, 4–6 m
M)and
oxalate (m, 0.5–2 m
M) in (A), or 2-deoxyglucose (s, 0.5–10 mM)
and arsenite (m, 5–100 l
M) in (B), were added to the cell suspens-
ion. When a glycolytic inhibitor was added, glucose was kept
constant at 5 m
M. The hexokinase and PFK-1 activities, which are
part of the Fru(1,6)P
2
-producing block, were n ot affected by 10 mM
oxalate or 1 mM arsenite (data not shown). Thus, the effect of
these two inhibitors on flux was due to their interaction with
enzymes of the Fru(1,6)P
2
-consuming block, most likely LDH [66]
(data not shown) and glyceraldehyde-3-phosphate dehydrogenase
[67]. The values of the straight lines, or the tangents to the curves,
at 100% Fru(1,6)P
2
(m), which are the elasticity coefficients in
these normalized plots, are shown on the traces.
A. Marı
´
n-Herna
´
ndez et al. Control of glycolysis in tumor cells
FEBS Journal 273 (2006) 1975–1988 ª 2006 The Authors Journal compilation ª 2006 FEBS 1979
It is worth emphasizing that, owing to the multitude
of variables involved in determining flux and interme-
diary concentrations, which have to be kept constant
during the experimental determination of elasticities
towards one metabolite, the dispersion of the experi-
mental points can be considerable in some cell prepa-
rations. This can be appreciated in Fig. 1 and in the
values shown in Table 4. Nonetheless, it is possible to
reach relevant conclusions about which steps exert sig-
nificant flux control of glycolysis and which steps have
low or negligible control (Table 5).
The elasticity coefficients, estimated from experi-
ments such as those shown in Fig. 1, are summarized
in Table 4. The flux control coefficients derived from
the elasticity coefficients are also shown. These data
clearly established that the main control of the glyco-
lytic flux in AS-30D cells resides in the upstream part
of the pathway. The experiments with glucose and oxa-
late show a high value for the flux control coefficient
of the Glc6P producer block [C
J
P(Glc6P)
], which indi-
cates that GluT, hexokinase and perhaps the degrada-
tion of glycogen, steps that lead to the formation of
Glc6P, were the sites that exerted most of the flux con-
trol. In turn, the experiments with 2-deoxyglucose and
arsenite revealed that the producer block of Fru(1,6)P
2
exerted most of the control, which indicates that flux
control was mainly located in GluT, hexokinase and
glucogenolysis together with hexosephosphate iso-
merase and PFK-1.
The same conclusion may be drawn from the high
C
J
P(Fru6P)
value (Table 4). However, the glycolytic
flux was negligible in the absence of added glucose
(Table 2), indicating that Glc6P and Fru6P forma-
tion from glycogen degradation was not significant
in AS-30D cells. Hence, from the difference between
the values of C
J
P(Glc6P)
and C
J
P(Fru6P)
, which were
determined under the same experimental conditions
with glucose and oxalate, it was possible to calculate
a specific flux control value of )0.02 for the Glc6P
branches, pentose phosphate cycle and glycogen syn-
thesis (Table 4).
Because of the less than perfect match of C
J
C
and C
J
P
values estimated from three different experimental pro-
tocols (Table 4), it was difficult to obtain a reliable flux
control coefficient for the DHAP consumer branch.
With 2-deoxyglucose and arsenite, the C
J
P(Fru(1,6)P2)
value of 0.75 suggests that the rest of the pathway (from
aldolase to LDH) exerts a flux control of 0.25 (Table 5).
However, the C
J
C(DHAP)
values with glucose and oxalate
or with glucose and arsenite were 0.49 and 0.37, respect-
ively, which revealed some discrepancy with the 2-
deoxyglucose and arsenite protocol. If the total
summation of C
J
Ei
values was higher than 1.0, then
branching in the middle and lower segments of glycol-
ysis might be significant, bringing about negative flux
control coefficients.
Table 4. Control (C) and elasticity (e) coefficients values of AS-30D hepatoma cells. Control coefficients were calculated from elasticity co-
efficients, derived from data such as those shown in Fig. 1, and applying summation and connectivity theorems (Eqns 1 and 2; see Experi-
mental procedures). e
p
m
, elasticity of producer block; e
c
m,
elasticity of consumer block; C
J
p
, control coefficient of producer block; C
J
c
, control
coefficient of consumer block. All the elasticity coefficients shown in the table were calculated by using slope values derived from linear
regression, although similar values were attained by nonlinear regression. For instance, the nonlinear regression for the titrations with 2-de-
oxyglucose and arsenite gave e
C
FBP
and e
P
FBP
of 1.99 ± 0.79 and )1.5 ± 1.6, which yielded the C
J
c
and C
J
P
of 0.39 ± 0.24 and 0.61 ± 0.24,
respectively. The number of experiments is shown in parentheses, and values are mean ± SD. DHAP, Dihydroxyacetone phosphate.
Metabolite e
C
m
C
J
C
e
P
m
C
J
P
+ Glucose + Oxalate
Glc6P 2.1 ± 1.7 (6) 0.29 ± 0.17 (3) ) 0.86 ± 0.41 (3) 0.71 ± 0.17 (3)
Fru6P 1.2 ± 0.45 (4) 0.31 ± 0.14 (3) ) 0.67 ± 0.43 (3) 0.69 ± 0.14 (3)
Fru(1,6)P
2
2.2 ± 0.95 (5) 0.44 ± 0.08 (5) ) 1.35 ± 0.66 (6) 0.62 ± 0.08 (5)
DHAP 1.27 ± 0.47 (5) 0.49 ± 0.18 (5) ) 1.5 ± 1 (5) 0.51 ± 0.18 (5)
+ 2-Deoxyglucose + Arsenite
Fru(1,6)P
2
0.93 ± 0.2 (3) 0.24 ± 0.06 (3) ) 0.25 ± 0.1 (3) 0.75 ± 0.05 (3)
+ Glucose + Arsenite
DHAP 1.18 ± 0.2 (3) 0.37 ± 0.15 (3) ) 0.5 ± 0.1 (3) 0.63 ± 0.14 (3)
Table 5. Distribution of control of glycolysis in AS-30D cells. GluT,
Glucose transporter; HK, hexokinase; HPI, hexosephosphate iso-
merase; TPI, triosephosphate isomerase; GAPDH, glyceraldehyde-
3-phosphate dehydrogenase; PGAM, phosphoglycerate mutase;
PYK, pyruvate kinase; LDH, lactate dehydrogenase.
Enzymes or branches C
J
Ei
GluT + HK 0.71
Pentose phosphate cycle + HPI + glycogen synthesis )0.02
PFK-1 0.06
Aldolase, TPI, GAPDH, PGAM, enolase, PYK, LDH,
Pyr branches, ATP demand
0.25
SC
J(glycolysis)
Ei
¼ 1.00
Control of glycolysis in tumor cells A. Marı
´
n-Herna
´
ndez et al.
1980 FEBS Journal 273 (2006) 1975–1988 ª 2006 The Authors Journal compilation ª 2006 FEBS
The flux control coefficient of PFK-1 (Table 5) was
estimated from the C
J
P(Fru(1,6)P2)
value attained with
2-deoxyglucose and arsenite minus the C
J
P(Glc6P)
value
attained with external glucose and oxalate (Table 4).
Only positive differences between C
J
P
values are to be
taken into account for elucidating flux control for spe-
cific enzymes. With negative differences [for instance,
with C
J
P(Fru(1,6)P2)
minus C
J
P(Fru6P)
both attained with
glucose and oxalate], the explanation is that there is a
pathway branch at the measured metabolite concentra-
tion, or that the experimental dispersion masks small
differences, or that indeed there is no difference
between the enzyme blocks analyzed.
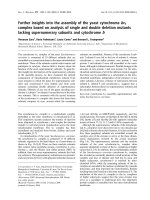
Kinetic analysis of tumoral hexokinase and PFK-1
To understand why hexokinase retained a significant
degree of control on glycolytic flux, despite its high
over-expression, and why PFK-1 control became negli-
gible, the kinetic properties of the two enzymes were
analyzed in cell extracts. The affinity of hexokinase for
glucose and ATP in both the cytosolic and mitochond-
rial fractions (Table 6) was in the same range as
reported by Wilson [37] for hexokinase from nontu-
morigenic mammalian tissues. Hexokinase was equally
distributed between the cytosol and mitochondria in
AS-30D hepatoma cells. Both hexokinase isoenzymes,
cytosolic and mitochondrial, were 81–93% inhibited by
1mm Glc6P (Fig. 2A).
The PFK-1 in the cytosolic-enriched fraction from
AS-30D cells exhibited K
m
and K
0.5
values for ATP
and Fru6P (Table 6) similar to those reported for
PFK-1 from other tumor cell lines [13,15]. In the
absence of added effectors, the PFK-1 kinetic pattern
was sigmoidal with respect to Fru6P [although
8–12 mm (NH
4
)
2
SO
4
coming from the coupling
enzymes was present], and hyperbolic with respect to
low concentrations of ATP (0.01–1 mm). At high con-
centrations (> 1 mm), ATP was inhibitory for PFK-1
activity. Citrate was also inhibitory at relatively low
(< 1 mm) Fru6P concentrations. However, when
1.5 mm Fru6P (physiological concentration) or higher
concentrations were used, citrate was innocuous, even
at concentrations as high as 10 mm (data not shown),
in the presence of 8–10 m m (NH
4
)
2
SO
4
. Fru(2,6)P
2
was the most potent activator of tumoral PFK-1, fol-
lowed by AMP and NH
4
+
(Table 6).
The mean ± SD intracellular concentrations of
AMP and citrate determined under glycolytic steady-
state conditions in AS-30D cells were 3.3 ± 1.4
Table 6. Tumoral hexokinase and PFK-1 kinetic parameters. The activities of hexokinase and PFK-1 were determined at 37 °C as described
in Experimental procedures. For hexokinase, the K
m
value for ATP was determined in the presence of 5 mM glucose, whereas that for gluc-
ose was determined with 10 m
M ATP. For PFK-1, the K
m
value for ATP was determined in the presence of 10 mM Fru6P, whereas the K
0.5
value for Fru6P was determined with 0.25 mM ATP. The ammonium concentration in the assay mixture, proceeding from the coupling
enzymes, was 16–20 m
M.TheK
0.5
values for NH
4
+
, AMP and Fru(2,6)P
2
were determined in the presence of 2 mM Fru6P and 0.8 mM ATP,
and with lyophilized coupling enzymes (i.e. in the absence of contaminating ammonium). The number of independent experiments is shown
in parentheses. Units of K
m
and K
0.5
are lM; V
max
, UÆ(mg protein)
)1
.
Hexokinase
ATP Glucose
K
m
V
max
K
m
V
max
Mitochondrial 696 ± 180 (3) 1.96 ± 0.4 (3) 146 ± 12 (3) 1.65 ± 0.18 (3)
Cytosolic 990 ± 50 (3) 0.52 ± 0.1 (3) 180 ± 40 (3) 0.44 ± 0.1 (3)
Type I
a
500 30
Type II
a
700 300
Type III
a
1000 3
PFK-1
ATP Fru6P
K
m
V
max
K
0.5
V
max
14 ± 2 (3) 0.2 ± 0.09 (3) 200 (2) 0.2 (2)
NH
4
+
AMP
K
0.5
V
max
K
0.5
V
max
1400 ± 800 (3) 0. 51 ± 0.2 (3) 100 ± 50 (4) 0.58 ± 0.14(4)
Fru(2,6)P
2
K
0.5
V
max
0.96 ± 0.3 (3) 0.52 ± 0.16 (3)
a
Values taken from [37].
A. Marı
´
n-Herna
´
ndez et al. Control of glycolysis in tumor cells
FEBS Journal 273 (2006) 1975–1988 ª 2006 The Authors Journal compilation ª 2006 FEBS 1981
(n ¼ 10) and 1.7 ± 0.7 mm (n ¼ 6), respectively.
Thereafter, the PFK-1 activity was determined in the
presence of the intracellular concentrations of its sub-
strates (ATP, Fru6P), inhibitors (ATP, citrate) and
activators [AMP, Fru(2,6)P
2
]. PFK-1 activity was fully
inhibited in the presence of ATP and citrate; this activ-
ity was only partially restored by AMP (Fig. 2B). The
potent ATP + citrate inhibition was totally overcome,
or even surpassed, by Fru(2,6)P
2
at concentrations
found in tumor cells [18–21].
Discussion
Distribution of glycolytic flux control
Metabolic control analysis has been applied to deter-
mine the control structure of glycolysis in several nor-
mal mammalian systems, such as human erythrocytes,
rat heart and mouse skeletal muscle extracts [22,23,38].
With this quantitative framework, hexokinase and
PFK-1 have been identified as the main controlling
steps. Fast-growth tumor cells develop a nontypical
metabolism [39,40], which includes an accelerated gly-
colytic flux. As glycolysis in different tumor lines has
been considered to be an extremely fast pathway [39],
the identification of which enzyme(s) controls glycolyt-
ic flux becomes clinically relevant.
The 10 enzymes of the AS-30D hepatoma glycolytic
pathway showed higher activity than in normal rat
hepatocytes. Despite showing the greatest over-expres-
sion, hexokinase and PFK-1, together with aldolase,
had the lowest V
max
values (Table 1). Other groups
have described a similar pattern for AS-30D [7] and
other tumor cell types [25]. However, in all previous
papers [7,15,25,41,42] it was difficult to establish a
strict activity sequence order, as not all glycolytic
activities were determined; moreover, the activity
assays were performed at nonphysiological pH (>7)
and temperature (<37 °C). Indeed, determining V
max
under near-physiological conditions establishes the true
content of active enzyme, which is not possible when
mRNA, or protein, is measured.
The tumoral hexokinase and PFK-1, enzymes that
in normal tissues control the flux (100% in human
erythrocytes, 59% in isolated rat heart, and 100% in
rat skeletal muscle reconstituted pathway) [22,23,38],
exhibited the highest activity enhancement (306-fold
and 22–56-fold increase versus hepatocytes; Table 1).
In addition, the cytosolic concentrations of Glc6P and
Fru(1,6)P
2
, which are products of hexokinase and
PFK-1, respectively, increased by fivefold and 250-fold
(Table 3). The upper limits of activity increment were
established by taking into account both the cytosolic
and mitochondrial hexokinase activities (Table 6), and
the PFK-1 maximal activity attained in the presence of
the activator Fru(2,6)P
2
(Fig. 2B inset).
The flux control coefficients calculated from elastici-
ties are, to a great extent, determined by the definition
of producing and consuming blocks [24,43,44]. Elasti-
city-based analysis requires that (a) the metabolic
A
0.0 0.2 0.4 0.6 0.8
f)
e)
d)
c)
b)
a)
Activity (U/m
g
protein)
B
0.00 0.05 5 10 15 20
0
20
40
60
80
100
%Ac vitiyt
(mM)
0.0 0.2 0.4 0.6 0.8 1.0
0
20
40
60
80
100
ytivitcA%
G6P (mM)
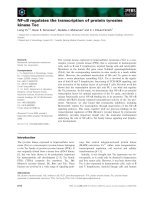
Fig. 2. Effect of modulators on tumoral hexokinase and PFK-1. (A)
Inhibition of mitochondrial bound (s) and cytosolic hexokinase (m)
by Glc6P. Values shown represent the mean ± SD from three dif-
ferent preparations assayed, except for the experiments with cyto-
solic hexokinase at 0 and 1 m
M Glc6P, in which nine different
preparations were analyzed. (B) Effect of modulators of PFK-1.
PFK-1 activity was determined in the presence of 1.5 m
M Fru6P
and (a) 0.8 m
M ATP; (b) 3.9 mM ATP; (c) 3.9 mM ATP +1.7 mM cit-
rate; (d) 3.9 m
M ATP +1.7 mM citrate + 3.2 mM AMP; (e) 3.9 mM
ATP + 1.7 mM citrate + 3.2 mM AMP + 5 lM Fru(2,6)P
2
; and (f)
3.9 m
M ATP + 1.7 mM citrate + 3.2 mM AMP + 50 lM Fru(2,6)P
2
.
Values shown represent the mean ± SD from three different prepar-
ations assayed. Inset: Activation of PFK-1 by different concentrat-
ions of Fru(2,6)P
2
(d), AMP (n) and NH
4
+
(m), in the presence of
2m
M Fru6P and 0.8 mM ATP.
Control of glycolysis in tumor cells A. Marı
´
n-Herna
´
ndez et al.
1982 FEBS Journal 273 (2006) 1975–1988 ª 2006 The Authors Journal compilation ª 2006 FEBS
pathway reaches a quasi-steady-state (see legend to
Table 2 for experimental details on how the glycolytic
steady-state flux was established), and (b) the interme-
diates that link the blocks are not significantly affected
by other pathways. However, some of the glycolytic
intermediates used in this work for the estimation of
elasticity coefficients such as Glc6P, Fru6P and DHAP
are indeed connected to other pathways, and hence
changes in the flux of glycogen synthesis and degrada-
tion, pentose phosphate cycle, and glycerol and triacyl-
glycerol synthesis might affect the concentrations of
these metabolites.
Another important assumption (c) in this elasticity-
based analysis is that producing and consuming blocks
affect each other only through the common metabolite.
However, the glycolytic segments analyzed in this work
may also interact through the moiety-conserved pools
of ATP–ADP–AMP and NAD(P)H–NAD(P)
+
. The
discrepancy in the calculated flux control coefficients
for producing and consuming blocks of DHAP and
Fru(1,6)P
2
, by using different experimental protocols
(Table 4), might partly be due to variation in the nico-
tinamide nucleotide redox state and adenine nucleotide
energy state, respectively.
Furthermore, the elasticity-based analysis might be
flawed, and the control distribution reported might be
erroneous, if the concentrations of adenine nucleotides
also varied in the titration experiments. It is worth
mentioning that several other studies involving elasti-
city-based analysis have not taken into account the
potential interactions between producing and consu-
ming blocks mediated by the pool of adenine nucleo-
tides [23,33–36,45]. Therefore, the variation in the
concentrations of ATP, ADP and AMP was deter-
mined under the conditions of the experiments shown
in Fig. 1. The results indicate that none of the adenine
nucleotides changed significantly (n ¼ 4) on varying
either glucose (from 4.5 to 5.5 mm) or oxalate (from
0to1mm); with 2 mm oxalate, a 10–30% increase in
ATP, ADP and AMP was observed. Thus, these find-
ings support the control distribution of glycolysis
(Table 5) derived from the elasticity-based analysis
shown in Table 4.
DHAP is certainly connected with nonglycolytic
reactions that involve NAD
+
such as a-glycerophos-
phate dehydrogenase, which was however, negligible in
AS-30D cells (Table 1). Likewise, Fru(1,6)P
2
formation
may affect the ATP ⁄ ADP ratio, which in turn establi-
shes communication with glycolytic downstream reac-
tions (phosphoglycerate kinase, pyruvate kinase) and
with other energy-dependent reactions (adenylate
kinase, ATPases, biosynthetic pathways). Moreover,
PFK-1 is activated by AMP (Table 6 and Fig. 2B),
which connects with the adenylate kinase reaction.
Therefore, the connectivity theorem used here for the
calculation of the flux control coefficients from elastici-
ties towards some intermediates [Eqn 2 in Experimen-
tal procedures] was apparently incomplete and too
simplistic to describe all interactions, and it may be
necessary to consider more complicated relationships
[24,43,44].
Notwithstanding the above arguments, the elasticity-
based analysis, as used here, revealed that the Glc6P-
producing block (GluT and hexokinase) exerted the
main control of flux. The finding that the intracellular
concentration of free glucose was high and saturating
for hexokinase (Table 3) suggests that most of the con-
trol exerted by the Glc6P-producing block might reside
in hexokinase. Moreover, high over-expression of
GluT has been documented for HeLa cells and other
human tumor cell types [46,47]. However, before we
can conclude that hexokinase is the main controlling
step, we should further examine the content and activ-
ity of the GluT under physiological conditions, as
product inhibition of the GluT activity has not been
explored [48].
In HeLa cells, all glycolytic enzymes except LDH
were also over-expressed compared with hepatocytes.
However, it should be noted that to achieve a more
rigorous comparison, a normal proliferating endothel-
ial cell line should be used instead of hepatocytes. The
over-expression in HeLa cells was much less than that
in AS-30D cells (Table 1); however, the glycolytic rates
were similar (Table 2). This was probably due to a
high rate of degradation of glycogen (high lactate for-
mation in the absence of added glucose; Table 2) and
amino acids (elevated concentration of pyruvate;
Table 3), the products of which bypass hexokinase, the
presumed main controlling step, to enter the glycolytic
pathway.
In HeLa cells, the control of glycolytic flux may also
reside in hexokinase, as in normal hepatocytes and
AS-30D cells, as well as in PFK-1, because the two
enzymes have the lowest V
max
values, and they are not
highly over-expressed. The eightfold lower concentra-
tion of Glc6P in HeLa cells, compared with AS-30D
cells, is expected to exert a low or negligible inhibition of
hexokinase. The low Glc6P concentration in HeLa cells
may be related to a higher activity of the Glc6P bran-
ches, glycogen synthesis and pentose phosphate cycle.
Indeed, G6PDH activity was 4–7 times higher in HeLa
cells than in hepatocytes and AS-30D cells (Table 1).
A higher ATP concentration in HeLa cells than in
AS-30D cells suggests a lower activity of ATPases and
other ATP-dependent cell processes or, alternatively,
that ATP production by oxidative phosphorylation
A. Marı
´
n-Herna
´
ndez et al. Control of glycolysis in tumor cells
FEBS Journal 273 (2006) 1975–1988 ª 2006 The Authors Journal compilation ª 2006 FEBS 1983
was faster. Indeed, the rate of oligomycin-sensitive
respiration, which reflects the rate of oxidative
phosphorylation [40,49], in the presence of 5 mm
glucose + 0.6 mm glutamine was 43 ± 4 ng-atoms
oxygenÆmin
)1
Æ10
)7
cells (n ¼ 4) in AS-30D cells and
92 ± 16 ng-atoms oxygenÆmin
)1
Æ10
)7
cells (n ¼ 6) in
HeLa cells. As the enzymatic assay of ADP determines
total but not free ADP, the ATP ⁄ ADP ratio was not
highly reliable as an indicator of the cellular energy
status.
There are two a-glycerophosphate dehydrogenase
isoenzymes in mammalian cells, one bound to the mit-
ochondrial inner membrane and another in the cytosol,
which regulate the cytosolic NADH ⁄ NAD
+
ratio and
are involved in the synthesis of triacylglycerols [50]. The
activity of the cytosolic isoenzyme decreases or becomes
negligible in fast-growth hepatomas [26,27] and AS-30D
and HeLa cells (Table 1), which may induce DHAP
accumulation (Table 3). An alternative route for triacyl-
glycerol synthesis has been described that does not
require a-glycerophosphate. This pathway starts with
the acylation of DHAP, in a reaction catalyzed by
DHAP acyltransferase, which is present in rat liver, kid-
ney, spleen and adipose tissue; at the subcellular level,
this enzyme is localized in the mitochondrial and micro-
somal fractions [51]. Such a route might be operating in
tumor cells.
Biochemical mechanisms underlying the
evaluated distribution of flux control
It should be emphasized that the analysis of V
max
val-
ues only (i.e. cellular content of active enzyme) to
reach conclusions on the metabolic pathway control is
certainly incomplete, as the enzymatic activities are
determined in the absence of their physiological activa-
tors and inhibitors, at saturating substrate concentra-
tions, and in the absence of products; these factors
discard the role of the reversibility of reactions under
physiological conditions on control of flux [52].
Accumulation of products may decrease the forward
reaction. In this regard, it is well documented that
Glc6P is a potent inhibitor of hexokinase-I, hexo-
kinase-II and hexokinase-III [37]. In consequence, the
increased hexokinase activity might be counter-
balanced by stronger Glc6P inhibition. One way to
circumvent this blockade is to over-express hexokinase-
III, an isoenzyme with a higher K
i
for Glc6P (0.1 mm).
Alternatively, hexokinase binding to mitochondria may
protect it against Glc6P inhibition [7,53]. However,
the Glc6P inhibition was strong and similar for both
mitochondrial and cytosolic hexokinase isoenzymes
(Figure 2A), when the activity was assayed under
near-physiological conditions of pH (7.0) and tempera-
ture (37 °C) and high concentrations of glucose
(> 1 mm) and Glc6P (‡ 1mm). On the other hand,
Nakashima et al. [7] and Bustamante et al. [53] deter-
mined Glc6P inhibition of mitochondrial hexokinase at
22–30 °C, pH 7.9, and in a hypotonic medium with
nonphysiological concentrations of glucose (< 1 mm)
and Glc6P (< 1 mm). The presence of this Glc6P regu-
latory mechanism in tumoral hexokinase supports an
essential role for this enzyme in the control of flux.
Four hexokinase isoenzymes have been identified in
mammalian cells: Type-I, II, III and IV (glucokinase),
from which the first three are Glc6P-sensitive [37].
Hexokinase-I and hexokinase-II may bind to the outer
mitochondrial membrane, as they have a specific
hydrophobic N-terminal segment [54]. Hexokinase-I is
predominantly located in brain, kidney, retina and
breast, whereas hexokinase-II is abundant in skeletal
muscle and adipose tissue [8]. In tumor cells, hexokin-
ase-II is apparently the main over-expressed isoenzyme
[7,8,37], except for brain tumors, in which hexokinase-I
is over-expressed [8].
Analysis of the hexokinase kinetic properties and
subcellular redistribution towards mitochondria sug-
gested that the isoenzyme over-expressed in AS-30D
cells was type II, as previously suggested using a sim-
ilar analysis [7]. The amount of mitochondrial hexo-
kinase in AS-30D (50%) and HeLa cells (70%; data
not shown) was also similar to that observed for
Novikoff and AS-30D ascites tumor cells of 50–80%
[55,56]. This observation explains, at least in part, the
enhanced glycolytic flux (Table 2, [8]) and the resist-
ance to apoptosis [11] in these tumor cells.
The kinetic analysis of PFK-1 revealed that the iso-
enzyme present in AS-30D cells was completely insen-
sitive to the usual allosteric inhibitors, ATP and
citrate, in the presence of a low, physiological concen-
tration of Fru(2,6)P
2
, and that it was highly sensitive
to the activators NH
4
+
, AMP and Fru(2,6)P
2
. The
high, physiological concentration of AMP in AS-30D
did not suffice to potently activate PFK-1 in the pres-
ence of ATP and citrate. The expression of a PFK-2
isoenzyme with a low fructose-2,6-bisphosphatase
activity in several human tumor lines has been des-
cribed [57,58], which ensures a high concentration of
Fru(2,6)P
2
. Indeed, Fru(2,6)P
2
was the most potent
activator of PFK-1 and blocked the inhibition by ATP
and citrate (Fig. 2B and Table 6, and also [12]).
Therefore, its kinetic properties predict that PFK-1
activity cannot impose a flux limitation on glycolysis
in AS-30D cells. Under near-physiological conditions,
the estimated elasticity coefficient of PFK-1 for Fru6P
was high (e
PFK-1
Fru6P
¼ 1.2), which provides the bio-
Control of glycolysis in tumor cells A. Marı
´
n-Herna
´
ndez et al.
1984 FEBS Journal 273 (2006) 1975–1988 ª 2006 The Authors Journal compilation ª 2006 FEBS
chemical mechanism for its low flux control coefficient
(Table 5). The PFK-1 elasticity and kinetic properties
also provide a biochemical basis for understanding the
diminished Pasteur effect observed in AS-30D [49] and
other tumor cell types [39].
Experimental procedures
Chemicals
Hexokinase, G6PDH, hexosephosphate isomerase, aldolase,
a-glycerophosphate dehydrogenase, triosephosphate isom-
erase, glyceraldehyde-3-phosphate dehydrogenase, pyruvate
kinase and LDH were purchased from Roche Co. (Mann-
heim, Germany). Recombinant enzymes enolase, pyruvate
phosphate dikinase and phosphoglycerate kinase from
Entamoeba histolytica were kindly provided by E Saavedra,
Instituto Nacional de Cardiologı
´
a, Me
´
xico. Glucose, Glc6P,
Fru(1,6)P
2
, glyceraldehyde 3-phosphate, 2-phosphoglycerate,
phosphoenolpyruvate, Fru(2,6)P
2
, pyruvate, citrate, ATP,
AMP, ADP, GTP, dithiothreitol, cysteine, NADH, NAD
+
,
NADP and oxalate were from Sigma Chemical (St Louis,
MO, USA). Fru6P and 3-phosphoglycerate were from Roche
(Indianapolis, IN, USA). Methoxy[
3
H]inulin was from Per-
kin–Elmer Life Sci (Boston, MA, USA). All other reagents
were of analytical grade from commercial sources.
Isolation of tumor and liver cells
AS-30D hepatoma cells [(2–4) · 10
8
cellsÆmL
)1
) were propa-
gated in female Wistar rats (200 g) by intraperitoneal trans-
plantation. Hepatoma cells were isolated as described
elsewhere [59].
HeLa cells (1.5 · 10
4
cellsÆmL
)1
) were grown in Dul-
becco’s minimal essential medium (Gibco Life Technol-
ogies, Rockville, MD, USA), supplemented with 10% fetal
bovine serum (Gibco), 10 000 UÆmL
)1
streptomycin ⁄ penicil-
lin, and fungizone (amphotericin B; Gibco) in 175-cm
2
flasks (Corning, New York, NY, USA) at 37 °Cin5%
CO
2
⁄ 95%O
2
. Hepatocytes were isolated by perfusion of
isolated liver with collagenase IV (Worthington, Lakewood,
NJ, USA) from fed Wistar rats [60]. The cellular viability
assayed by trypan blue exclusion was 80–85%. Experimen-
tal manipulation of human and rodent cells and animal spe-
cimens were carried out following the Instituto Nacional de
Cardiologı
´
a de Mexico guidelines in accordance with the
Declaration of Helsinki and the US NIH guidelines for care
and use of experimental animals.
Determination of steady-state concentrations
of metabolites
Cells (15 mg proteinÆmL
)1
) were incubated in Krebs-Ringer
medium with orbital shaking (150 r.p.m.) at 37 °Cina
plastic flask. After 10 min, 5 mm glucose was added to the
cell suspension. The reaction was stopped 3 min later with
ice-cold perchloric acid (3%, v ⁄ v, final concentration). For
the determination of the intracellular l-lactate, an aliquot
(1 mL) of the cell suspension was rapidly withdrawn and
centrifuged at 20 800 g for 10–15 s at room temperature.
The supernatant was discarded, and the pellet rinsed with
fresh Krebs–Ringer medium and then resuspended in 3%
perchloric acid. The samples were neutralized with 3 m
KOH ⁄ 0.1 m Tris. The concentrations of Glc6P, Fru6P,
Fru(1,6)P
2
, DHAP, glyceraldehyde 3-phosphate, phospho-
enolpyruvate, pyruvate, ATP, ADP, AMP, citrate and
l- lactate were determined by standard enzymatic assays [61].
Protein was determined by the biuret method using BSA
as standard [62].
Determination of intracellular glucose
AS-30D cells (15 mgÆmL
)1
) were preincubated for 10 min in
the absence of exogenous substrates at 37 °C. Exogenous glu-
cose was added after 10 min, and the cells were incubated for
3 min more. Afterwards, an aliquot (0.5 mL) was carefully
poured into microcentrifuge tubes containing, from bottom
to top, 30% (v ⁄ v) perchloric acid (0.3 mL), 1-bromodode-
cane (0.3 mL) and fresh Krebs–Ringer medium (0.3 mL).
The sample was centrifuged for 2–3 min in a refrigerated
Microfuge (Eppendorf centrifuge 5804 R, Eppendorf,
Hamburg, Germany) at 20 800 g. The bottom layer was col-
lected and neutralized with 10% NaOH. Glucose was deter-
mined by enzymatic analysis [61].
To correct for the presence of exogenous glucose from the
incubation medium in the cellular pellet, the content of exter-
nal water was evaluated by using methoxy[
3
H]inulin. An
aliquot of cells (5–30 mg proteinÆmL
)1
) was incubated
in 0.5 mL Krebs–Ringer medium with [
3
H]inulin
(0.15 mgÆmL
)1
, specific radioactivity 5200 c.p.m.Ælg
)1
) for
15 s. Thereafter, the cell suspension was carefully layered
into microcentrifuge tubes prepared as described above. The
radioactivity of the bottom layer was measured in a liquid
scintillation analyzer (Packard Instruments ⁄ Canberra,
Meriden, CT, USA). The concentration of glucose carried
from the extracellular milieu was 1.28 mm. This value was
subtracted from the original intracellular concentration.
Determination of glycolytic flux in liver and
tumor cells
Cells (15 mg proteinÆmL
)1
) were incubated in 3 mL Krebs–
Ringer medium with orbital stirring (150 r.p.m.) at 37 °Cin
a plastic flask. After 10 min, 5 mm glucose was added to
the cells; the reaction was stopped with cold 3% perchloric
acid 0 and 3 min later. The samples were neutralized with
3 m KOH ⁄ 0.1 m Tris. l-Lactate generated was determined
by enzymatic analysis [61].
A. Marı
´
n-Herna
´
ndez et al. Control of glycolysis in tumor cells
FEBS Journal 273 (2006) 1975–1988 ª 2006 The Authors Journal compilation ª 2006 FEBS 1985
Cell extracts of tumor and liver cells
Cells (65 mg proteinÆmL
)1
) were resuspended in 25 mm
Tris ⁄ HCl buffer, pH 7.6, with 1 mm EDTA, 5 mm dithio-
threitol and 1 mm phenylmethanesulfonyl fluoride. The cell
suspension was frozen in liquid nitrogen and thawed in a
water bath at 37 °C; this procedure was repeated three
times. Cell lysates were centrifuged at 39 000 g for 20 min
and 4 °C. Afterwards, the supernatant was collected for
determination of enzyme activity. Activities of hexokinase,
hexosephosphate isomerase, PFK-1, triosephosphate iso-
merase, aldolase, glyceraldehyde-3-phosphate dehydroge-
nase, phosphoglycerate kinase, phosphoglycerate mutase,
enolase, pyruvate kinase, LDH, a-glycerophosphate dehy-
drogenase, phosphoglucomutase and G6PDH were deter-
mined spectrophotometrically by standard assays [63,64].
The incubation buffer was 50 mm Mops, pH 7, at 37 °C.
Phosphoglycerate kinase activity was determined in 50 mm
potassium phosphate, pH 7, at 37 °C. To assay mitochond-
rial hexokinase, isolated mitochondria were prepared as
described elsewhere [59]. The assays for both cytosolic and
mitochondrial hexokinase isoenzymes were carried out at
37 °C in 1 mL KME buffer (100 mm KCl, 50 mm Mops,
0.5 mm EGTA, pH 7.0) plus 2 U G6PDH, 1 m m NADP
+
,
5mm MgCl
2
, glucose (from 0.05 to 10 mm) and 1 lm
oligomycin. The reaction was started by the addition of
ATP (0.05–5 mm) after 2 min incubation.
Assay for hexokinase inhibition by Glc6P was carried
out in 3 mL of KME buffer at 37 °C, in the presence of
3mm ATP, 5 mm MgCl
2
,1lm oligomycin and 0.2–1 mm
Glc6P. Owing to the high unspecific oxidation of added
NADH by the cytosolic-enriched and mitochondrial frac-
tions (despite the addition of rotenone), the activity was
calculated from the ADP generated, which was determined
by a standard assay [61]. The hexokinase activity was cor-
rected for the ADP formed in the absence of added glucose.
Bound and free isoenzymes were preincubated for 2 min,
and then the hexokinase reaction was started by adding
3mm glucose. After 30 s, the reaction was stopped with
ice-cold perchloric acid (3%, v ⁄ v, final concentration). The
samples were neutralized with 3 m KOH ⁄ 0.1 m Tris. The
control activities for both hexokinase isoenzymes were com-
parable to those determined by the G6PDH coupling assay.
For PFK-1 activity, freshly prepared extracts were incu-
bated at 37 °Cin50mm Mops, pH 7. The reaction assay
contained 0.15 mm NADH, 5 mm MgCl
2
,1mm EDTA,
Fru6P (from 0.01 to 10 mm) and ammonium sulfate suspen-
sions of the following coupling enzymes: 0.36 U aldolase,
9 U triosephosphate isomerase, and 3.1 U a- glyceralde-
hyde-3-phosphate dehydrogenase. The reaction was started
by the addition of exogenous ATP (from 0.01 to 2 mm). For
the determination of K
0.5
for NH
4
+
, AMP and Fru(2,6)P
2
,
as well as for the effect of activators and inhibitors, lyophi-
lized (ammonium-free) coupling enzymes were used in KME
buffer.
Determination of flux control coefficients
The flux control coefficients (C
J
Ei
) were determined by
using the elasticity-based analysis [31,34,45,65,]. This
approach quantifies the sensitivity of a given enzyme or
block of enzymes to variations in its substrate or product
when the steady-state flux is modified. Glycolysis was sti-
mulated by exogenous glucose (4–6 mm) or inhibited by
oxalate (0.5–2 mm), 2-deoxyglucose (0.5–10 mm) or arsenite
(5–100 lm). Under these conditions, the variation in the
glycolytic flux and in several intermediates was determined.
Flux control coefficients were estimated using the connec-
tivity (Eqn 1) and summation theorems (Eqn 2) [24],
C
J
E1
e
E1
m
þ C
J
E2
e
E2
m
¼ 0 ð1Þ
C
J
E1
þ C
J
E2
¼ 1 ð2Þ
in which J is the glycolytic flux (rate of lactate formation),
E1 is the enzyme block that produces the intermediate (m)
and E2 is the enzyme block that consumes m.
Acknowledgements
This work was partially supported by grant no. 43811-Q
from CONACyT-Me
´
xico.
References
1 Warburg O (1956) On respiratory impairment in cancer
cells. Science 124, 269–270.
2 Zu XL & Guppy M (2004) Cancer metabolism: facts,
fantasy, and fiction. Biochem Biophys Res Commun 313,
459–465.
3 Dang C & Semenza GL (1999) Oncogenic alterations of
metabolism. Trends Biochem Sci 24, 68–72.
4 Lu H, Forbes RA & Verma A (2002) Hypoxia-inducible
factor 1 activation by aerobic glycolysis implicates the
Warburg effect in carcinogenesis. J Biol Chem 277,
23111–23115.
5 Osthus RC, Shim H, Kim S, Li Q, Reddy R, Mukherjee
M, Xu Y, Wonsey D, Lee LA & Dang C (2000) Dereg-
ulation of glucose transporter 1 and glycolytic gene
expression by c-Myc. J Biol Chem 275, 21797–21800.
6 Gillies RJ, Martinez-Zaguillan R, Martinez GM, Serr-
ano R & Perona R (1990) Tumorigenic 3T3 cells main-
tain an alkaline intracellular pH under physiological
conditions. Proc Natl Acad Sci USA 87, 7414–7418.
7 Nakashima R, Paggi M, Scott LJ & Pedersen PL (1988)
Purification and characterization of a bindable form of
mitochondrial bound hexokinase from the highly glyco-
lytic AS-30D rat hepatoma cell line. Cancer Res 48,
913–919.
8 Pedersen PL, Mathupala S, Rempel A, Geschwind JF &
Hee Ko Y (2002) Mitochondrial bound type II
Control of glycolysis in tumor cells A. Marı
´
n-Herna
´
ndez et al.
1986 FEBS Journal 273 (2006) 1975–1988 ª 2006 The Authors Journal compilation ª 2006 FEBS
hexokinase: a key player in the growth and survival of
many cancers and an ideal prospect for therapeutic
intervention. Biochim Biophys Acta 1555, 14–20.
9 Goel A, Mathupala SP & Pedersen PL (2003) Glucose
metabolism in cancer. Evidence that demethylation
events play a role in activating type II hexokinase gene
expression. J Biol Chem 278, 15333–15340.
10 Mathupala SP, Heese C & Pedersen PL (1997) Glucose
catabolism in cancer cells. The type II hexokinase promo-
ter contains functionally active response elements for the
tumor suppressor p53. J Biol Chem 272, 22776–22780.
11 Pastorino JG, Shulga N & Hoek JB (2002) Mitochon-
drial binding of hexokinase II inhibits Bax-induced
cytochrome c release and apoptosis. J Biol Chem 277,
7610–7618.
12 Depre
´
C, Rider MH & Hue L (1998) Mechanisms of
control of heart glycolysis. Eur J Biochem 258, 277–290.
13 Staal GEJ, Kalff A, Heesbeen EC, Van Veelen CWM &
Rijksen G (1987) Subunit composition, regulatory prop-
erties, and phosphorylation of phosphofructokinase,
from human gliomas. Cancer Res 47, 5047–5051.
14 Meldolesi MF, Macchia V & Lacceti P (1976) Differ-
ences in phosphofructokinase regulation in normal and
tumor rat thyroid cells. J Biol Chem 251, 6244–6251.
15 Oskam R, Rijksen G, Staal GEJ & Vora S (1985) Isozy-
mic composition and regulatory properties of phospho-
fructokinase from well-differentiated and anaplastic
medullary thyroid carcinomas of the rat. Cancer Res 45,
135–142.
16 Vora S, Halper JP & Knowles DM (1985) Alterations
in the activity and isozymic profile of human phospho-
fructokinase during malignant transformation in vivo
and in vitro: transformation-and progression-linked dis-
criminants of malignancy. Cancer Res 45, 2993–3001.
17 Sa
´
nchez-Martı
´
nez C & Arago
´
n JJ (1997) Analysis of
phosphofructokinase subunits and isozymes in ascites
tumor cells and its original tissue, murine mammary
gland. FEBS Lett 409, 86–90.
18 Denis C, Paris H & Murat JC (1986) Hormonal control
of fructose-2,6-bisphosphate concentration in the HT29
human colon adenocarcinoma cell line. Biochem J 239,
531–536.
19 Mojeda M, Bosca L & Hue L (1985) Effect of gluta-
mine on fructose-2,6-biphosphate and on glucose meta-
bolism in HeLa cells and in chick-embryo fibroblasts.
Biochem J 232, 521–527.
20 Loiseau AM, Rousseau GG & Hue L (1985) Fructose-
2,6-bisphosphate and the control of glycolysis by gluco-
corticoids and by other agents in rat hepatoma cells.
Cancer Res 45, 4263–4269.
21 Nissler K, Petermann H, Wenz I & Brox D (1995) Fruc-
tose-2,6-bisphosphate metabolism in Ehrlich ascites
tumour cells. J Cancer Res Clin Oncol 121, 739–745.
22 Rapoport T, Heinrich R, Jacobasch G & Rapoport S
(1974) A linear steady-state treatment of enzymatic
chains. A mathematical model of glycolysis of human
erytrocytes. Eur J Biochem 42, 107–120.
23 Kashiwaya Y, Sato K, Tsuchiya N, Thomas S, Fell
DA, Veech RL & Passonneau JV (1994) Control of glu-
cose utilization in working perfused rat heart. J Biol
Chem 269, 25502–25514.
24 Fell D (1997) Understanding the Control of Metabolism.
Plenum Press, London.
25 Wu R (1959) Regulatory mechanisms in carbohydrate
metabolism. V. Limiting factors of glycolysis in HeLa
cells. J Biol Chem 234, 2806–2810.
26 Harding JW, Pyeritz EA, Morris HP & White HB
(1975) Proportional activities of glycerol kinase and
glycerol 3-phosphate dehydrogenase in rat hepatomas.
Biochem J 148, 545–550.
27 Pedersen PL (1978) Tumor mitochondria and the bioener-
getics of cancer cells. Prog Exp Tumor Res 22, 190–274.
28 Traut TW (1994) Physiological concentrations of
purines and pyrimidines. Mol Cell Biochem 140, 1–22.
29 Moreno-Sa
´
nchez R & Torres-Ma
´
rquez ME (1991) Con-
trol of oxidative phosphorylation in mitochondria, cells
and tissues. Int J Biochem 23, 1163–1174.
30 Groen AK, Wanders RJ, Westerhoff HV, van der Meer
R & Tager JM (1982) Quantification of the contribution
of various steps to the control of mitochondrial respira-
tion. J Biol Chem 257, 2754–2757.
31 Kacser H (1983) The control of enzyme systems in vivo:
elasticity analysis of the steady state. Biochem Soc Trans
11, 35–40.
32 Moreno-Sa
´
nchez R, Bravo C & Westerhoff HV (1999)
Determining and understanding the control of flux. An
illustration in submitochondrial particles of how to vali-
date schemes or metabolic control. Eur J Biochem 264,
427–433.
33 Groen AK, van Roermund CW, Vervoom RC & Tager
JM (1986) Control of gluconeogenesis in rat liver cells.
Flux control coefficients of the enzymes in the gluconeo-
genic pathway in the absence and presence of glucagon.
Biochem J 237, 379–389.
34 Hafner RP, Brown GC & Brand MD (1990) Analysis of
the control of respiration rate, phosphorylation rate,
proton leak rate and protonmotive force in isolated
mitochondria using the ‘top-down’ approach of meta-
bolic control theory. Eur J Biochem 188, 313–319.
35 Thomas S, Mooney PJ, Burrell MM & Fell DA (1997)
Metabolic control analysis of glycolysis in tuber tissue
of potato (Solanum tuberosum): explanation for the low
control coefficient of phosphofructokinase over respira-
tory flux. Biochem J 322, 119–127.
36 Ainscow EK & Brand MD (1999) Top-down control ana-
lysis of ATP turnover, glycolysis and oxidative phospho-
rylation in rat hepatocytes. Eur J Biochem 263, 671–685.
37 Wilson JE (2003) Isozymes of mammalian hexokinase:
structure, subcellular localization and metabolic func-
tion. J Exp Biol 206, 2049–2057.
A. Marı
´
n-Herna
´
ndez et al. Control of glycolysis in tumor cells
FEBS Journal 273 (2006) 1975–1988 ª 2006 The Authors Journal compilation ª 2006 FEBS 1987
38 Jannaschk KD, Burgos M, Centerlles JJ, Ovadi J &
Cascante M (1999) Application of metabolic control
analysis to the study of toxic effects of copper in muscle
glycolysis. FEBS Lett 445, 144–148.
39 Eigenbrodt E, Fister P & Reinacher M (1985) New per-
spectives in carbohydrate metabolism in tumor cells.
In. Regulation of Carbohydrate Metabolism (Reitner, R,
ed.), vol. 2, pp 141–179. CRC Press, Boca Raton, FL.
40 Rodrı
´
guez-Enrı
´
quez S & Moreno-Sa
´
nchez R (1998)
Intermediary metabolism of fast-growth tumor cells.
Arch Med Res 29, 1–12.
41 Mazuret S, Eigenbrodt E, Failing K & Steinberg P
(1999) Alterations in the glycolytic and glutaminolytic
pathways after malignant transformation of rat liver
oval cells. J Cell Physiol 181, 136–146.
42 Mazuret S, Michel A & Eigenbrod E (1997) Effect of
extracellular AMP on cell proliferation and metabolism
of breast cancer cell lines with high and low glycolytic
rates. J Biol Chem 272, 4941–4952.
43 Shuster S, Kahn D & Westerhoff HV (1993) Modular
analysis of control of complex metabolic pathways.
Biophys Chem 48, 1–17.
44 Ainscow EK & Brand MD (1998) Control analysis of
systems with reaction blocks that ‘cross-talk’. Biochim
Biophys Acta 1366, 284–290.
45 Brown GC, Lakin-Tomas L & Brand MD (1990) Con-
trol of respiration and oxidative phosphorylation in
isolated rat liver cells. Eur J Biochem 192, 355–362.
46 Kitagawa T, Tsuruhara Y, Hayashi M, Endo T &
Stanbridge EJ (1995) A tumor-associated glycosylation
change in the glucose transporter GLUT1 controlled by
tumor suppressor function in human cell hybrids. J Cell
Sci 108, 3735–3743.
47 Macheda ML, Rogers S & Best JD (2005) Molecular
and cellular regulation of glucose transporter (GLUT)
proteins in cancer. J Cell Physiol 202, 654–662.
48 Colville C, Seatter MJ, Jess TJ, Gould GW & Thomas
HM (1993) Kinetic analysis of the liver-type (GLUT2)
and brain-type (GLUT3) glucose transporters in
Xenopus oocytes: substrate specificities and effects of
transport inhibitors. Biochem J 290, 701–706.
49 Rodrı
´
guez-Enrı
´
quez S, Jua
´
rez O, Rodrı
´
guez-Zavala JS
& Moreno-Sa
´
nchez R (2001) Multisite control of the
Crabtree effect in ascites hepatoma cells. Eur J Biochem
268, 2512–2519.
50 Houstek J, Cannon B & Lindberg O (1975) Glycerol-3-
phosphate shuttle and its funtion in intermediary meta-
bolism of hamster brow-adipose tissue. Eur J Biochem
54, 11–18.
51 Hajra AK (1997) Dihydroxyacetone phosphate acyl-
transferase. Biochim Biophys Acta 1348, 27–34.
52 Mendoza-Cozatl DG & Moreno-Sanchez R (2006) Con-
trol of glutathione and phytochelatin synthesis under
cadmium stress. Pathway modeling for plants. J Theor
Biol 238, 919–936.
53 Bustamante E & Pedersen PL (1977) High aerobic gly-
colysis of rat hepatoma cells in culture: role of mito-
chondrial hexokinase. Proc Natl Acad Sci USA 74,
3735–3739.
54 Smith TAD (2000) Mammalian hexokinases and their
abnormal expression in cancer. Br J Biomed Sci 57,
170–178.
55 Arora KK & Pedersen PL (1988) Functional signifi-
cance of mitochondrial bound hexokinase in tumor cell
metabolism. J Biol Chem 263, 17422–17428.
56 Parry DM & Pedersen PL (1983) Intracellular localiza-
tion and properties of particulate hexokinase in the
Novikoff ascites tumor. J Biol Chem 258, 10904–10912.
57 Atsumi T, Chesney J, Metz C, Leng L, Donnelly S,
Makita Z, Mitchell R & Bucala R (2002) High
expression of inducible 6-phosphofructo-2-kinase ⁄ fruc-
tose-2,6-bisphosphatase (iPFK-2; PFKFB3) in human
cancers. Cancer Res 62, 5881–5887.
58 Chesney J, Mitchell R, Benigni F, Bacher M, Spiegel
L, Al-Abed Y, Han JH, Metz C & Bucala R (1999) An
inducible gene product for 6-phosphofructo-2-kinase
with an AU-rich instability element: role in tumor cell
glycolysis and the Warburg effect. Proc Natl Acad Sci
USA 96, 3047–3052.
59 Lo
´
pez-Go
´
mez F & Torres-Ma
´
rquez & Moreno-Sa
´
nchez
R (1993) Control of oxidative phosphorylation in
AS-30D hepatoma mitochondria. Int J Biochem 25,
373–377.
60 Berry MN & Friend DS (1969) High-yield preparation
of isolated rat liver parenchymal cells. A biochemical
and fine structural study. J Cell Biol 43, 506–520.
61 Bergmeyer HU (ed.) (1974) Methods of Enzymatic Ana-
lysis. Verlag Chemie, Weinheim.
62 Gornall AG, Bardwill CJ & David MM (1949) Determi-
nation of serum proteins by means of biuret reaction.
J Biol Chem 177, 751–766.
63 Bergmeyer HU (ed.) (1983) Methods of Enzymatic Ana-
lysis. Verlag Chemie, Weinheim.
64 Saavedra E, Encalada R, Pineda E, Jasso-Cha
´
vez R &
Moreno-Sa
´
nchez R (2005) Glycolysis in Entamoeba his-
tolytica. Biochemical characterization of recombinant
glycolytic enzymes and flux control analysis. FEBS J
272, 1767–1783.
65 Tager JM, Wanders JA, Groen AK, Kunz W, Bohnen-
sack R, Ku
¨
ster U, Letko G, Bo
¨
hme G, Duszynski J &
Wojtczak L (1983) Control of mitochondrial respiration.
FEBS Lett 151, 1–9.
66 Simpson RJ, Brindle KM, Brown FF, Campbell ID &
Foxall DL (1982) Studies of lactate dehydrogenase in
the purified state and in intact erythrocytes. Biochem J
202, 581–587.
67 Meunier JC & Dalziel K (1978) Kinetics studies of gly-
ceraldehyde-3-phosphate dehydrogenase from rabbit
muscle. Eur J Biochem 82, 483–492.
Control of glycolysis in tumor cells A. Marı
´
n-Herna
´
ndez et al.
1988 FEBS Journal 273 (2006) 1975–1988 ª 2006 The Authors Journal compilation ª 2006 FEBS