Exploring short k mer profiles in cells and mobile elements from archaea highlights the major influence of both the ecological niche and evolutionary history
Bạn đang xem bản rút gọn của tài liệu. Xem và tải ngay bản đầy đủ của tài liệu tại đây (1.68 MB, 10 trang )
Bize et al. BMC Genomics
(2021) 22:186
/>
RESEARCH ARTICLE
Open Access
Exploring short k-mer profiles in cells and
mobile elements from Archaea highlights
the major influence of both the ecological
niche and evolutionary history
Ariane Bize1* , Cédric Midoux1,2,3, Mahendra Mariadassou2,3, Sophie Schbath2,3, Patrick Forterre4,5* and
Violette Da Cunha5
Abstract
Background: K-mer-based methods have greatly advanced in recent years, largely driven by the realization of their
biological significance and by the advent of next-generation sequencing. Their speed and their independence from
the annotation process are major advantages. Their utility in the study of the mobilome has recently emerged and
they seem a priori adapted to the patchy gene distribution and the lack of universal marker genes of viruses and
plasmids.
To provide a framework for the interpretation of results from k-mer based methods applied to archaea or their
mobilome, we analyzed the 5-mer DNA profiles of close to 600 archaeal cells, viruses and plasmids. Archaea is one
of the three domains of life. Archaea seem enriched in extremophiles and are associated with a high diversity of
viral and plasmid families, many of which are specific to this domain. We explored the dataset structure by
multivariate and statistical analyses, seeking to identify the underlying factors.
Results: For cells, the 5-mer profiles were inconsistent with the phylogeny of archaea. At a finer taxonomic level,
the influence of the taxonomy and the environmental constraints on 5-mer profiles was very strong. These two
factors were interdependent to a significant extent, and the respective weights of their contributions varied
according to the clade. A convergent adaptation was observed for the class Halobacteria, for which a strong 5-mer
signature was identified. For mobile elements, coevolution with the host had a clear influence on their 5-mer
profile. This enabled us to identify one previously known and one new case of recent host transfer based on the
atypical composition of the mobile elements involved. Beyond the effect of coevolution, extrachromosomal
elements strikingly retain the specific imprint of their own viral or plasmid taxonomic family in their 5-mer profile.
(Continued on next page)
* Correspondence: ;
1
Université Paris-Saclay, INRAE, PROSE, F-92761 Antony, France
4
Institut Pasteur, Unité de Virologie des Archées, Département de
Microbiologie, 25 Rue du Docteur Roux, 75015 Paris, France
Full list of author information is available at the end of the article
© The Author(s). 2021 Open Access This article is licensed under a Creative Commons Attribution 4.0 International License,
which permits use, sharing, adaptation, distribution and reproduction in any medium or format, as long as you give
appropriate credit to the original author(s) and the source, provide a link to the Creative Commons licence, and indicate if
changes were made. The images or other third party material in this article are included in the article's Creative Commons
licence, unless indicated otherwise in a credit line to the material. If material is not included in the article's Creative Commons
licence and your intended use is not permitted by statutory regulation or exceeds the permitted use, you will need to obtain
permission directly from the copyright holder. To view a copy of this licence, visit />The Creative Commons Public Domain Dedication waiver ( applies to the
data made available in this article, unless otherwise stated in a credit line to the data.
Bize et al. BMC Genomics
(2021) 22:186
Page 2 of 22
(Continued from previous page)
Conclusion: This specific imprint confirms that the evolution of extrachromosomal elements is driven by multiple
parameters and is not restricted to host adaptation. In addition, we detected only recent host transfer events,
suggesting the fast evolution of short k-mer profiles. This calls for caution when using k-mers for host prediction,
metagenomic binning or phylogenetic reconstruction.
Keywords: Extrachromosomal element, Virus, Plasmid, 5-mer, Codon composition, Multivariate analysis, Signature,
Halophily, Hyperthermophily, Host transfer
Background
In the field of nucleic acid sequence analysis, k-mer based
methods have greatly advanced in recent years, supported
by the advent of next-generation sequencing (reviewed in
[1]). As the main advantages, they usually provide reasonable computation durations compared to most traditional
alignment-based tools; they are also annotationindependent, and they enable the comparison of incomplete or nonhomologous sequences on a common basis.
While they first emerged for practical purposes, their biological significance was subsequently established (reviewed
in [2]). In particular, it appeared that the composition of
short k-mers is conserved throughout the genome sequence, giving rise to the concept of a k-mer signature,
originally based on dinucleotide composition [3]. This
finding raised questions regarding the evolutionary significance of this concept and of the underlying mechanisms
[4]. Meanwhile, a variety of k-mer-based applications
started to proliferate. In the field of environmental microbiology, many k-mer-based tools are dedicated to metagenomic analysis. The k-mer composition of contigs can be
used for binning, an important step in the reconstruction
of metagenome-assembled genomes (MAGs) (e.g. [5, 6]).
It is also used for the taxonomic assignation of sequences
(e.g. [7–9]) and to compare different metagenomes by
examining distances between k-mer profiles (e.g. [10, 11]).
Quite recently, tools specifically dedicated to mobile elements have been developed, that seem a priori adapted to
the patchy gene distribution and to the lack of universal
marker genes of viruses and plasmids. They enable, for instance, the prediction of viral [12] or plasmid [13] sequences from metagenomes, the assignment of hosts to
viruses [14] or plasmids [13], or the classification of viruses [15]. For the study of microbial diversity and evolution, the possibility of using k-mers for phylogenetic [16–
19] or evolutionary network [20, 21] reconstruction is also
being explored; its application to the detection of horizontal gene transfer (HGT) was proposed more than 10 years
ago [22], and a tool for HGT detection within metagenomic data has been recently published [23].
Since these tools are generally based on statistical
methods, the results may inevitably contain false or true
positives. It is thus necessary to continue exploring kmer signatures across the genomosphere to establish a
framework for interpretation of results obtained with kmer-based tools. In the present work, we focused specifically on the cells and mobile elements from Archaea,
one of the three domains of life.
The diversity of viruses and plasmids in Archaea is
high, with a great number of approved families compared to the relatively low number of isolated elements
[24–26]. This provides an interesting case for comparing
k-mer composition among hosts and viruses. In particular, viruses of extreme thermophilic crenarchaea are
highly diverse. They often belong to Archaea-specific
viral families, with unusual morphotypes. In the class
Halobacteria, head-and-tail viruses belonging to Caudovirales are abundant and are predominant in hypersaline
environments, which are dominated by haloarchaea [27].
While Caudovirales is a cosmopolitan order of viruses
(the most abundant order infecting Bacteria [28]), Halobacteria members are also infected by Archaea-specific
viral families, such as Pleioipoviridae. Many archaeal
plasmids have not yet been classified into well-defined
families; however, several families of plasmids have been
defined according to plasmid size, replication mode, and
genomic content (reviewed in [25]).
Among archaea, there are no known pathogens for
humans, plants or animals, so there is no overrepresentation bias linked to pathogens in the databases. Other
biases are, however, present: the mobile elements from
several archaeal taxonomic groups (orders or even phyla,
) are very poorly represented in public databases, so the
view on global diversity remains incomplete. In addition
to the diversity of their mobile elements, archaea constitute an interesting case in terms of adaptation or loss of
adaptation to extreme environments, which has played
an important role in their evolutionary history [29].
Several studies on k-mer signatures previously included archaeal genomes. For instance, in 1999, Campbell et al. [30] studied genome signatures across a wide
phylogenetic range, encompassing bacteria, archaea,
plasmids and mitochondrial DNA. This work highlighted
the similarity of signatures between hosts and plasmids,
the lack of consistent signatures among thermophiles
and, finally, the high signature divergence among five archaeal genomes available at that time. In 2006, van Passel et al. [31] showed the difference in dinucleotide
Bize et al. BMC Genomics
(2021) 22:186
composition between hosts and plasmids in Archaea and
Bacteria. In 2008, Bohlin et al. [32] obtained a similar
trend by using 4-mers and zero-order Markov models.
The same authors studied the composition of bacterial
and archaeal genomes in 2- to 8-mers, with 44 archaeal
genomes among the 581 analyzed genomes. They observed a higher variability in AT-rich and hostassociated genomes compared to GC rich or free-living
archaea and bacteria [33].
Currently, the number of publicly available genomes
has greatly increased, warranting a new study of signatures across the domain Archaea. Selecting close to 600
cellular, viral and plasmid genomes, we applied metrics
based on short k-mer profiles to understand how mobile
elements are distributed with respect to their hosts in
the profile landscape. We used multivariate and statistical analyses to explore the dataset structure and identify some key structuring factors, namely, the taxonomic
classification, the genomic GC content, the ecological
niche and, for mobile elements, the taxonomy of the
host. Moreover, we examined whether 5-mer profiles enable the detection of singular evolutionary trajectories,
such as host transfers, among mobile elements. We also
searched for 5-mer signatures for halophily and
hyperthermophily in Archaea.
Results
The 5-mer profiles of archaeal genomes are influenced by
the taxonomy and GC content
Before focusing on extrachromosomal elements, we first
analyzed the 5-mer profile distribution of archaeal cellular genomes. We selected 239 archaeal genomes, focusing mainly on taxonomic groups for which many
plasmids and/or viruses have already been classified into
distinct families: Halobacteria, Sulfolobales, Thermococcales and a few other groups of Euryarchaeota and
Crenarchaeota.
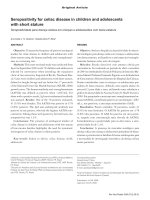
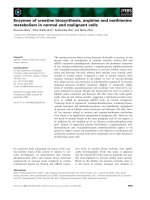
We first noticed from the dendrogram obtained by hierarchical clustering that the sequences were distributed
into two main clusters according to GC content values,
suggesting a major influence of the GC content on the kmer distribution (Fig. 1a). The most GC-rich cluster (Fig.
1a, letter c) exclusively included Halobacteria members,
consistent with the fact that Halobacteria have a high genomic GC-content, 63.28% ± 4.29 SD on average in our
dataset. At the other extreme, the less GC-rich cluster
(Fig. 1a, letter b) comprised only Group I methanogens
(Methanococcales and Methanobacteriales), except for
one Group II Methanosarcinales genome.
We also identified taxonomy as an important factor,
and many clusters were dominated by a single taxonomic group (Fig. 1a). In particular, all members of the
class Halobacteria were located in a single cluster (Fig.
1a, letters c) with only two exceptions, corresponding to
Page 3 of 22
the two Haloquadratum walsbyi genomes (order Haloferacales). Similarly, 33 out of 37 members of the order
Methanosarcinales were gathered in a single cluster (Fig.
1a, letter d). Members of the order Sulfolobales were divided into a major cluster (31 genomes out of 39) and a
minor cluster (8 genomes out of 39) (Fig. 1a, letters e
and f, respectively). The latter corresponded to the
Metallosphaera genomes, which have a higher GC content than the other Sulfolobales genomes. The 17 members of the order Methanococcales were divided into two
neighboingr clusters (Fig. 1a, within cluster b), which
also included several Methanobacteriales members,
which are Group I methanogens, similar to Methanococcales members.
We did not observe similar clustering for Methanobacteriales, Thermococcales, Thermoproteales and Desulfurococcales. In such cases, archaea belonging to the same
order were distributed into several clusters, sometimes
distant across the dendrogram. However, at the local
scale, small- to medium-sized clusters enriched in one of
these orders were still visible, such as a medium-sized
cluster comprising exclusively Thermococcales members
(23 genomes out of 39) (Fig. 1a, letter g).
To quantify the relative contribution of the taxonomy and of the GC content to the 5-mer composition, we performed a permutational multivariate
analysis of variance (PERMANOVA) (Additional file 1).
We applied PERMANOVA to the pairwise Euclidian
distance matrix computed from the 5-mer profiles,
which we will denote as D5_cells hereafter. Among the
three considered taxonomic levels (phylum, order,
genus), order had the strongest influence; it alone explained 75.94% of the cell profile dissimilarity variance (model: D5_cells ~ Genus), compared to 7.06% for
phylum (D5_cells ~ Phylum) and 17.74% for genus,
when the effect of the phylum and order was first removed (D5_cells ~ Phylum*Order*Genus).
Notably, the GC content alone contributed almost as
much to the variance (69.10%, D5_cells ~ GC%) as the
taxonomic rank of the order (D5_cells ~ order). These last
two factors appeared to be highly dependent, explaining
56.71% of the cell dissimilarity variance (D5_cells ~
order*GC%) in an indistinguishable manner.
Despite the strong influence of the taxonomy, the global topology of the dendrogram obtained by hierarchical
clustering was inconsistent with the phylogeny of archaea. While Sulfolobales belongs to the Crenarchaeota
phylum, its main cluster grouped with a cluster dominated by Group I methanogens from the Euryarchaeota
phylum. Moreover, within the major Halobacteria cluster, archaea from the three orders Haloferacales, Halobacteriales and Natrialbales were interconnected
(especially due to Halobacteriales), showing the blurring
of phylogenetic information.
Bize et al. BMC Genomics
(2021) 22:186
Page 4 of 22
Fig. 1 Dendrograms based on 5-mer frequencies for archaeal cells and mobile elements. a. Archaeal cells. b. Archaeal viruses and plasmids
Bize et al. BMC Genomics
(2021) 22:186
A strong link between the ecological niche and the 5-mer
composition of archaeal cellular genomes
Many archaea thrive in extreme conditions, and adaptation to such specific environments has played an important role in their evolution [34, 35]. We therefore
assumed that major properties of the environmental
niches could be another important factor underlying the
5-mer composition among archaea. We focused on salinity and temperature and defined 8 “Niche” categories.
All Halobacteria members were categorized as “halophile”. The remaining archaea were labeled according to
7 qualitative growth temperature categories, ranging
from “weak mesophile” to “extreme hyperthermophile”
(Additional File 2), based on the BacDive database [36]
and on the literature, e.g. [37].
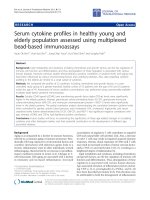
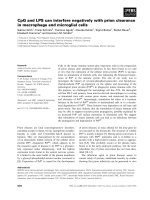
The clustering pattern was clearly influenced by the
“Niche” categories (Fig. 2 a). Among the 6 main clusters
of the dendrogram for cells (Fig. 2 a, clusters a to f),
cluster b was largely dominated by thermophiles to extreme hyperthermophiles. Cluster c was dominated by
extreme thermophiles, corresponding mostly to Sulfolobales members. Cluster d comprised exclusively thermophiles to extreme hyperthermophiles. Finally, clusters e
and f were dominated by weak mesophiles and mesophiles, although a small patch of hyperthermophiles was
visible in cluster e. Sulfolobales comprises exclusively
acidophilic members, which could explain their specific
signature compared to other thermophilic/hyperthermophilic extrachromosomal elements. Indeed, cytoplasmic
pH regulation does not fully compensate for the decrease in intracellular pH in acidic environments: the
intracellular pH in acidophiles is higher by approximately 3 to 4 points than that of the surrounding acidic
environment, but on the whole, it is still lower than that
in neutrophiles [38]. It has previously been suggested
that acidophilic archaea and bacteria have purine-poor
codons in their long genes [39]; however, the effects of
acidophily on compositional features seem to have been
studied less than the adaptation to high temperatures.
Based on PERMANOVA, the “Niche” categories explained 64.17% of the dataset variance (D5_cells ~ Niche).
Although this percentage is lower than that explained by
the taxonomic rank of order (namely, 75.94%), it is still
very high. As anticipated, the GC content, taxonomic
rank and “Niche” had a high level of dependency (Additional file 1, D5_cells ~ Niche*Order*GC%). In particular,
the last two factors explained 60.56% of the cell profile
dissimilarity variance in an indistinguishable manner
(D5_cells ~ Order*Niche), consistent with the strong links
between the ecological niche and the evolutionary history in Archaea. Finally, we noticed that a model combining the genomic GC content, ecological niche and
taxonomy (order rank) explained almost all the cell dataset variance, namely, 95.48% (Additional file 1, D5_cells ~
Page 5 of 22
Niche*Order*GC%). Overall, a limited number of factors
are therefore sufficient to explain the differences in 5mer composition of the archaeal cell genomes included
in our study.
The extrachromosomal element profiles are also
influenced by the GC content and host taxonomy, with
higher profile dispersion
We analyzed the 5-mer composition of archaeal plasmids and viruses (extrachromosomal elements) with a
similar approach. The obtained dendrogram was divided
into two major clusters. One of them (Fig. 1b, letter a),
corresponded to elements with the highest GC contents,
including nearly all 154 Halobacteria mobile elements,
except for 9. The second cluster, with the lowest GC
content, was divided into two subclusters (Fig. 1b, letters
b and c). Subcluster b was dominated by Sulfolobales
extrachromosomal elements but also included a significant number of extrachromosomal elements from
Methanococcales, Methanosarcinales and Marine Group
II. Subcluster c was dominated by Thermococcales extrachromosomal elements but also comprised significant
numbers of extrachromosomal elements from Marine
Group II, Desulfurococcales, Thermoproteales and
Methanobacteriales.
Compared to the pattern obtained for cells, visual inspection showed that the extrachromosomal elements,
categorized according to the taxonomy of their host, had
a more intertwined distribution, except for viruses and
plasmids of Halobacteria. Consistent with this observation, the taxonomy of the host at the order level explained only 57.36% of the extrachromosomal element
dissimilarity variance (Additional File 3, D5_mobile ~ Host
order), compared to 75.94% for the cells. As in the case
of cellular genomes, the rank of their hosts appeared
more informative at the order level than at the phylum
or genus level (Additional File 3, D5_mobile ~ Host Phylum*Host Order*Host Genus).
The less consistent pattern obtained for extrachromosomal elements compared to cells could theoretically reflect more frequent genetic exchanges between
extrachromosomal elements present in hosts belonging to
different taxonomic groups. However, this does not seem
to be the case. For instance, while several cases of host
transfers between Thermococcales and Methanococccales
plasmids have been previously documented [25], Methanococcales extrachromosomal elements clustered mostly
with those of Sulfolobales rather than with those of Thermococcales in our analysis. Another hypothesis to explain
such a complex pattern for extrachromosomal elements
could be the influence of their GC content. Indeed, extrachromosomal element genomes harbor, in many cases, a
distinct average GC content compared to their hosts
(Additional File 4). We noticed that the extent and even
Bize et al. BMC Genomics
(2021) 22:186
Page 6 of 22
Fig. 2 Mapping of temperature and salinity-related growth conditions on the archaeal cell and mobile element dendrograms. a. Archaeal cells. b.
Archaeal viruses and plasmids
Bize et al. BMC Genomics
(2021) 22:186
the direction of these shifts in GC content varied greatly
according to the host’s taxonomy (at the order level) and
to the type of extrachromosomal element (Additional File 4). Since the GC content had a strong global
influence on the obtained pattern (45.13% of the variance,
Additional File 3, D5_mobile ~ GC%), these shifts in GC
content could greatly contribute to the more complex pattern obtained for archaeal extrachromosomal elements
compared to that obtained for archaeal cells.
Similar to cells, the host taxonomy (at the order level)
and the genomic GC-content were highly interdependent factors for extrachromosomal elements (Additional File 3): 39.71% of the dissimilarity variance was
explained indistinguishably by these two factors (D5_mobile ~ Host Order*GC% and D5_mobile ~ GC% * Host
Order). Interestingly, the taxonomic classification of viruses and plasmids was by far the most influential factor,
alone explaining 68.30% of the extrachromosomal element dissimilarity variance (Additional File 3, D5_mobile ~
Family). This could be due partly to the high number of
viral and plasmid families in the dataset (60 compared to
only 11 different host orders), which must support a better fit of the model. However, this finding also suggests
that individual viral and plasmid families could have a
specific 5-mer composition.
The extrachromosomal element family and the taxonomy of their hosts at the order level were strongly
dependent, since 51.90% of the extrachromosomal element dissimilarity variance was explained indistinguishably
by one of the factors (Additional File 3, D5_mobile ~ Host
Order*Family and D5_mobile ~ Family*Host Order). This
could reflect the fact that the host range of a given plasmid or viral family is limited. The fact that viruses and
plasmids coevolved with their hosts and that they were
not frequently transferred to new hosts from other orders could explain this limitation.
A significant but weaker influence of the ecological niche
on the 5-mer composition of archaeal extrachromosomal
elements
We used the same “Niche” categories and method to
analyze plasmids and viruses of archaea (Fig. 2 b). As
already identified above (Fig. 2 b), extrachromosomal elements from halophiles grouped together (cluster a),
with a very limited number of exceptions. The viruses
and plasmids from extreme thermophiles, corresponding
mostly to Sulfolobales, tended to group with mesophilic
extrachromosomal elements, in cluster b. By contrast,
most other thermophilic to extremely hyperthermophilic
extrachromosomal elements were in a separate group
(cluster c).
The consistency of the 5-mer profile distribution with
the “Niche” was lower than that for cells: the “Niche” explained 50.12% of the dissimilarity variance from the
Page 7 of 22
extrachromosomal element profiles (Additional File 3,
D5_mobile ~ Niche). As we observed for cells, the information about the “Niche” was almost fully included in
the host taxonomic classification, since the “Niche” explained only 1.16% of the extrachromosomal element
dataset variance when the influence of host taxonomy
was first removed (Additional File 3, D5_mobile ~ Host
Order*Niche). A statistical model combining the genomic GC content, the ecological niche and the taxonomy
of the host explained 70.85% of the profile dissimilarity
variance (Additional File 3, D5_mobile ~ Niche*Host
Order*GC%); adding the extrachromosomal element
family as a variable to the model enabled us to reach
89.29% of explained variance (Additional File 3, D5_mobile ~ Niche*Host Order*GC% and D5_mobile ~ Niche*Host Order*Family*GC%).
A clear 5-mer signature for halophily and a weaker
signature for hyperthermophily
Considering the strong association between the ecological niche and the 5-mer profile distribution, we decided to identify some of the most discriminant 5-mers
between halophilic and nonhalophilic entities on the one
hand, and between hyperthermophilic versus nonhyperthermophilic entities on the other. For this purpose,
in each case, we applied partial least square discriminant
analysis (PLS-DA) to archaeal cells and extrachromosomal element profiles separately. In each situation, we
retained the ten most discriminant 5-mers (Table 1,
Additional file 5).
For both cells and extrachromosomal elements, the
separation according to the salinity-related growth properties was very strong, consistent with the hierarchical
clustering results (principal component analysis (PCA)
and PLS-DA, Additional files 6, 7, 8, 9). Consistent with
this, the average frequency of the ten most discriminant
5-mers was significantly different between halophiles
and nonhalophiles (Mann-Whitney-Wilcoxon test, p <
0.01, Additional files 10 and 11). Considering the
marked separation between halophilic and nonhalophilic
entities (Fig. 3, Additional Files 6, 7, 8, 9), many additional 5-mers likely have significantly different frequencies between both groups. The ten most discriminant 5mers were more abundant in halophilic archaea or in
their extrachromosomal elements, except for one 5-mer,
which was more abundant in nonhalophilic archaea.
The signatures of halophilic cells and extrachromosomal elements were expected to be similar, since most
Halobacteria extrachromosomal elements grouped with
Halobacteria cells in a joint dendrogram (Fig. 3). Indeed,
each of the ten discriminant 5-mers identified for the
cells also had significantly different frequencies within
extrachromosomal elements (Mann-Whitney-Wilcoxon
test, p < 0.01). However, only 4 out of the 10 most
Bize et al. BMC Genomics
(2021) 22:186
Page 8 of 22
Table 1 Sets of 10 most discriminant 5-mers identified by PLS-DA
Archaeal cells
Archaeal mobile elements
Halophiles
high frequency 5mers
CGAAC, GTTCG, ACCGA, GACCG, CGGTC, TCGGT, GTGAC,
GTCAC, TCGAC
GTTCG, ACCGA, TTCGA, CGAAC TCGAA, TCGGT, TCGGA, CGAG
T, TCCGA, ATCGA
Halophiles
low frequency 5mers
TGAAG
–
Hyperthermophiles TCAAC, GTTGA, AGCTT, AAGCT
high frequency 5mers
TTTGG, GAGCT, AGCTC, AAGCT, AGCTT, TTGAG, (TTGGA),
GCCAA, (TCCAA)
NonTCAGA, TCTGA, TCAGT, ACTGA, CAGAT, ATCTG
hyperthermophiles
low frequency 5mers
CGAAT
Bold characters: in each table line, most discriminant 5-mers shared between cells and mobile elements, for a considered niche category. In parenthesis:
statistically non-significant frequency differences based on a t-test (p ≥ 0.01), in a considered niche category
discriminant 5-mers identified for halophiles were common between cells and mobile elements (Table 1, Additional file 5). The 10 most discriminant preferred 5mers in haloarchaea were GC-rich, as expected (Table 1,
Additional file 4).
To identify discriminant 5-mers according to the growth
temperature, we removed all Halobacteria representatives
from the dataset and classified the remaining elements
into two categories: elements with growth temperatures
below 80 °C (weak mesophiles to extreme thermophiles)
and those with growth temperatures above 80 °C
(hyperthermophiles to extreme hyperthermophiles).
For archaeal cells, hyperthermophiles and nonhyperthermophiles separated quite well based on PCA and
PLS-DA (Additional files 12 and 13). The 10 most discriminant 5-mers identified by PLS-DA all had significantly different frequencies between the two groups
(Mann-Whitney-Wilcoxon test, p < 0.01, Additional file 14). However, the differences were less pronounced than those for halophiles.
For the extrachromosomal elements, with the same
defined categories, the separation between the two
temperature groups was less clear, as assessed by
PCA (Additional file 15); but the barycenters were
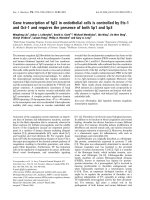
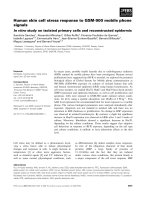
Fig. 3 Dendrogram based on 5-mer frequencies for a subset of archaeal cells and mobile elements
Bize et al. BMC Genomics
(2021) 22:186
still quite distant from each other. Eight of the 10
most discriminant 5-mers identified by PLS-DA (Additional file 16) had significantly different frequencies
between the two groups (Mann-Whitney-Wilcoxon
test, p < 0.01, Additional File 17). Only two of them
were shared with those identified for cells, with
higher frequencies in hyperthermophiles than in the
lower growth temperature group. Seven of the 10
most discriminant 5-mers identified for the cells also
had significantly different levels in extrachromosomal
elements (Additional file 18), indicating that the signatures of archaeal cells and extrachromosomal elements with respect to hyperthermophily are similar
without being strictly identical.
The signal for hyperthermophily was much weaker
overall than that for halophily. In addition, most
hyperthermophiles in our dataset were from the orders Desulfurococcales, Thermoproteales and Thermococcales. The few others (e.g., some Sulfolobales and
Methanococcales members) tended to be located
within the lower-temperature group, as assessed by
PCA. It is therefore not clear whether the identified
discriminant 5-mers constitute a general signature for
hyperthermophilic archaea.
Page 9 of 22
Codon frequencies influence 3-mer and 5-mer profile
distributions
It has been previously shown that amino acid usage
and codon frequencies vary according to environmental conditions, particularly for archaea and extreme
environments [29, 35, 40, 41]. Since the proportion of
coding regions is high in archaeal genomes, it is likely
that their 5-mer composition is somehow correlated
with the codon frequencies. To evaluate this hypothesis, we focused only on the genomes for which the
positions of coding regions were available in public
databases, namely 238 out of 239 archaea and 288
out of 345 archaeal viruses and plasmids, in our dataset (Additional file 2).
We first compared, for halophiles and hyperthermophiles, the 10 most discriminant 3-mers of the wholegenome sequences to their 10 most discriminant codons (Table 2). In each case, several of the most discriminant codons were also present among the most
discriminant 3-mers of the whole genome sequences
(Table 2, underlined words), which supported, as expected, the link between codon frequencies and 3mer composition in archaea and their extrachromosomal elements.
Table 2 Sets of 10 most discriminant codons and 3-mers identified by PLS-DA
Underlined: most discriminant words shared between codons and 3-mers in whole genomes, for a considered niche category. Bold characters: most discriminant
words shared between cells and mobile elements, for a considered niche category. In parenthesis: statistically non-significant frequency differences based on a ttest (p ≥ 0.01), in a considered niche category
Bize et al. BMC Genomics
(2021) 22:186
The 10 most discriminant preferred codons in
haloarchaea were GC rich, as expected (Table 2, Additional file 4). They encoded arginine (R) (through 4 different codons), aspartic acid (D), valine (V), histidine
(H), alanine (A), serine (S) and proline (P). Contrary to
previous results on amino acid composition [35, 41, 42],
we did not detect preferred codons for glutamic acid (E)
[35, 42, 43] and threonine (T) [35]. D and V have been
repeatedly identified as preferred amino acids in halophiles [35, 41, 42]. A higher abundance of R in halophiles has been reported when comparing halophiles to
thermophiles [42] or in specific cases [35, 43]; an increase in H has also been documented [41]. The enrichment in R probably compensates for the avoidance of K
[35, 41–43]: this latter amino acid is similar to R, a basic,
polar and positively charged amino acid; however, the
side chains of R can bind more water molecules than
those of K. In our study, the identification of 4 preferred
codons coding for R could therefore partly result from a
selection process operating at the protein level.
Our results on the most discriminant codons for hyperthermophilic archaea can be compared with those
from [44], for the identification of differentially abundant
codons between thermophilic and mesophilic archaea
and bacteria. A limited number of codons identified in
[44] were also retrieved in our analysis (Table 2): GAG
(E), AGA (R) and AGG (R), which were more frequent
in hyperthermophilic archaea or in their extrachromosomal elements; CAG (glutamine, Q), which was less frequent in both hyperthermophilic archaea and their
extrachromosomal elements; and finally CAT (H), which
was less frequent in hyperthermophilic extrachromosomal elements. However, the majority of the most discriminant codons for hyperthermophily that we
identified (Table 2) were not detected as differentially
abundant in [44]. In archaea and bacteria, the nature of
the discriminant codons is likely influenced by proteomic adaptation to temperature [45]. In 2007, the amino
acids isoleucine (I), V, tyrosine (Y), tryptophan (W), R, E
and leucine (L) were proposed as universal markers for
the optimal growth temperature in prokaryotes (IVYW
REL) [45]. These amino acids were already identified to
some extent prior to 2007 [44, 46, 47] . Although not
present in the IVYWREL set, K was identified by other
authors as a preferred amino acid [44, 47]. By contrast,
thermophiles tend to be impoverished in at least Q, T
and H [44, 46]. Our results on most discriminant codons
showed a certain consistency with these established
amino acid signatures, since 6 of them translated to one
of these amino acids (Table 2, preferred codons translating to E or L and avoided codons translating to Q or H).
In our analysis, some codons translating to S, R, and A
appeared to be preferred in both hyperthermophilic archaea and their extrachromosomal elements. Finally, 3
Page 10 of 22
avoided codons corresponded to the preferred amino
acids I, L, and Y (Table 2), showing the difficulty of fully
reconciling the signature at the codon level from this
study to the amino acid signature from previous studies.
Examining the influence of codon frequency on the 5mer profiles is less straightforward, since each 5-mer includes three overlapping 3-mers. We thus implemented
a different approach to obtain a global estimate of this
influence. We first established another type of 5-merbased profile, taking into account the codon composition. For each element, this new profile was based on
the concatenated coding regions. For each 5-mer, the
profile value consisted of an exceptionality score, reflecting how unexpectedly frequent or rare this 5-mer is,
considering the codon composition of the sequence.
This other type of profile therefore does not necessarily
highlight frequent 5-mers. Rather, it highlights 5-mers
that have an unexpected frequency in the studied sequence, given the codon frequencies. After obtaining the
profiles, we calculated the distance matrices (D5_cells_e
and D5_mobile_e) before applying PERMANOVA. The influence of the niche was much lower on this new type of
profile, decreasing from 64.22 to 41.75% for archaeal
cells (D5_cells ~ Niche and D5_cells_e ~ Niche) and from
51.35 to 17.81% for mobile elements (D5_mobile ~ Niche
and D5_mobile_e ~ Niche). The strong influence of the
ecological niche on the 5-mer profiles is thus significantly but not exclusively explained by codon
frequencies.
Joint analysis of plasmid, viral and cellular genomes from
Archaea highlights the influence of coevolution and of
the extrachromosomal element families on 5-mer profiles
To visualize a dendrogram encompassing both archaeal
cells and their extrachromosomal elements, we created a
smaller subset by randomly selecting approximately half
of the sequences in each category (cell, virus and plasmid) and we jointly analyzed the corresponding 5-mer
profiles. This subset comprised a total of 296 genome sequences, of which 119 were from cells, 106 were from
plasmids and 71 were from viruses.
Based on hierarchical clustering (Fig. 3) and at the global scale, viruses and plasmids did not form a separate
cluster. Rather, they tended to group with archaea sharing the same taxonomy as their hosts. This was best evidenced by the class Halobacteria, for which most
members and their associated extrachromosomal elements were grouped in a single specific cluster (Fig. 3,
letter a). This trend was also visible for the orders Sulfolobales, Thermococcales, and Methanococcales (Fig. 3,
clusters b, c, d, respectively). It was less clear for the orders Methanobacteriales, Thermoproteales and Desulfurococcales, as well as Marine Group II, which were more
dispersed at various locations of the dendrogram.