Transcriptomic and metabolomic characterization of post hatch metabolic reprogramming during hepatic development in the chicken
Bạn đang xem bản rút gọn của tài liệu. Xem và tải ngay bản đầy đủ của tài liệu tại đây (1.33 MB, 10 trang )
Van Every and Schmidt BMC Genomics
(2021) 22:380
/>
RESEARCH
Open Access
Transcriptomic and metabolomic
characterization of post-hatch metabolic
reprogramming during hepatic
development in the chicken
Heidi A. Van Every1* and Carl J. Schmidt2
Abstract
Background: Artificial selection of modern meat-producing chickens (broilers) for production characteristics has led
to dramatic changes in phenotype, yet the impact of this selection on metabolic and molecular mechanisms is
poorly understood. The first 3 weeks post-hatch represent a critical period of adjustment, during which the yolk
lipid is depleted and the bird transitions to reliance on a carbohydrate-rich diet. As the liver is the major organ
involved in macronutrient metabolism and nutrient allocatytion, a combined transcriptomics and metabolomics
approach has been used to evaluate hepatic metabolic reprogramming between Day 4 (D4) and Day 20 (D20)
post-hatch.
Results: Many transcripts and metabolites involved in metabolic pathways differed in their abundance between D4
and D20, representing different stages of metabolism that are enhanced or diminished. For example, at D20 the
first stage of glycolysis that utilizes ATP to store or release glucose is enhanced, while at D4, the ATP-generating
phase is enhanced to provide energy for rapid cellular proliferation at this time point. This work has also identified
several metabolites, including citrate, phosphoenolpyruvate, and glycerol, that appear to play pivotal roles in this
reprogramming.
Conclusions: At Day 4, metabolic flexibility allows for efficiency to meet the demands of rapid liver growth under
oxygen-limiting conditions. At Day 20, the liver’s metabolism has shifted to process a carbohydrate-rich diet that
supports the rapid overall growth of the modern broiler. Characterizing these metabolic changes associated with
normal post-hatch hepatic development has generated testable hypotheses about the involvement of specific
genes and metabolites, clarified the importance of hypoxia to rapid organ growth, and contributed to our
understanding of the molecular changes affected by decades of artificial selection.
Keywords: High-throughput, Cell proliferation, Metabolic reprogramming, Organ growth, Pathway, Hypoxia,
Glycolysis, Lipogenesis, Regulation
* Correspondence:
1
Center for Bioinformatics and Computational Biology, University of
Delaware, Newark, Delaware, USA
Full list of author information is available at the end of the article
© The Author(s). 2021 Open Access This article is licensed under a Creative Commons Attribution 4.0 International License,
which permits use, sharing, adaptation, distribution and reproduction in any medium or format, as long as you give
appropriate credit to the original author(s) and the source, provide a link to the Creative Commons licence, and indicate if
changes were made. The images or other third party material in this article are included in the article's Creative Commons
licence, unless indicated otherwise in a credit line to the material. If material is not included in the article's Creative Commons
licence and your intended use is not permitted by statutory regulation or exceeds the permitted use, you will need to obtain
permission directly from the copyright holder. To view a copy of this licence, visit />The Creative Commons Public Domain Dedication waiver ( applies to the
data made available in this article, unless otherwise stated in a credit line to the data.
Van Every and Schmidt BMC Genomics
(2021) 22:380
Background
The modern broiler (meat) chicken is the product of
more than 60 years of artificial selection for commercially desirable traits, resulting in both improved feed efficiency and breast muscle yield. Currently, broilers
reach market weight in ¾ the time it took in the 1950s,
yet they weigh nearly twice as much as the 1950s breeds,
with the breast muscle representing a greater component of the overall bird mass [1]. Several studies have
compared modern lines with unselected lines in terms of
growth rate and feed efficiency [2, 3]. In one such study
comparing growth of a modern broiler line (Ross 708)
with a legacy line of commercial general-purpose birds
unselected since the 1950s (UIUC) over the first 5 weeks
post hatch, the breast muscle was found to comprise 18
and 9% of total body mass, respectively [4]. Additional
changes in growth pattern manifest in liver allometry. In
both lines, the relative liver mass reached a similar maximum of approximately 3.8% of body mass and then
began declining. However, this peak occurred a week
earlier in the modern broiler. This finding provided part
of the basis for this study, including selection of the liver
and first 3 weeks post hatch, as it was hypothesized the
earlier onset of this peak arose due to selection for rapid
growth and the liver’s important role in nutrient
metabolism.
Chicks undergo drastic physiological changes as a consequence of hatching. The developing embryo relies entirely on nutrients from the yolk [5–7]. During late
embryonic development, much of the yolk lipid is
absorbed and stored in the liver, predominately as cholesteryl esters [8]. At day 18 of incubation, 3 days prior
to hatch, lipids make up 10% of the liver’s mass due to
absorption and storage of yolk nutrients [9]. This stored
lipid, along with the yolk remnant, provides the chick
with a nutrients following hatch, but by day 5 post-hatch
90% of the yolk lipid has been absorbed [10]. Chicks are
provided with a carbohydrate-rich diet at hatch because
fasting during this period stunts the early muscle growth
potential of chicks [11]. These early changes in nutrient
source, coupled with rapid growth, mean maintaining
metabolic homeorhesis is a major challenge facing the
liver in the early weeks following hatch.
High-throughput transcriptome analyses provide snapshots of transcribed RNAs at any given time and are
useful to identify differentially regulated genes between
conditions or time points. Combining transcriptomics
with untargeted metabolomics is a powerful means to
infer hypotheses about the interactions between the
transcriptome and metabolome. For example, integrating
these two high throughput methods identified metabolic
and signaling pathways responding to heat stress in the
liver of modern broilers [12]. Previous studies have described the hepatic transcriptome of the modern broiler
Page 2 of 21
[13–16]. One study compared the hepatic transcriptome
over six time points during the embryo to hatchling
transition, from 16-day embryos to 9-day old chicks
[17]. They identified many metabolic pathways consistent with the nutrient source transition the chicks
undergo in the first week post hatch, especially some affecting lipid metabolism. Another recent study examined
changes in the hepatic transcriptome resulting from immediate post-hatch fasting and re-feeding, identifying
genes regulated by lipogenic transcription factor
THRSPA and switching between lipolytic and lipogenic
states [18].
There have been no integrated high-throughput studies of the modern broiler liver under normal conditions
in the critical first 3 weeks post-hatch. Thus, the molecular changes that are occurring during this time
period – the metabolic drivers of rapid muscle growth
and feed efficiency – are poorly understood. Exploring
these in a data-driven fashion can elucidate new knowledge about the liver’s functions during early post-hatch
growth of the chick, and also how the liver itself is developing. In this work, by integrating the hepatic transcriptome and metabolome, we compare the core metabolic
pathways of the liver at two time points: Day 4 (D4) and
Day 20 (D20) post-hatch. These were selected to capture
the metabolic reprogramming required to support the
transition from relying on stored yolk to orally consumed feed that underlies the growth rate and phenotype of the modern broiler.
Results
Phenotypic measurements and i-STAT blood chemistry
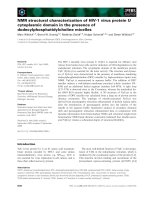
At D4 post-hatch, the liver was noticeably yellow in
color, gradually changing to deep red by D20 (Fig. 1).
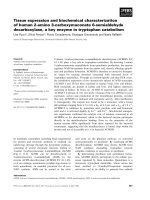
Mean phenotypic measurements of bird growth, liver allometry, and i-STAT blood chemistry values are shown
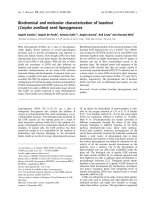
in Table 1; Fig. 2 shows hierarchical clustering of this
data, which separates the two groups by age. Body mass
and liver mass showed the largest difference between
days and were positively correlated with bird age (PCC
0.98 and 0.97, respectively). Relative liver mass was negatively correlated with bird age (PCC − 0.51). The top
blood chemistry values positively correlated with bird
age were sodium (Na, PCC 0.89), bicarbonate (HCO3,
PCC 0.79), total carbon dioxide (TCO2, PCC 0.77), and
pH (PCC 0.75). Partial oxygen (PO2, PCC − 0.70) and
oxygen saturation (sO2, − 0.56) were negatively correlated with bird age.
TCO2, PCO2, HCO3, and pH are used to assess blood
acid-base balance, which is maintained by the kidneys
and lungs and affected by both metabolism and respiration. TCO2 is a measure of total blood carbon dioxide
while PCO2 measures the difference between CO2 produced by the cells and removed through respiration.
Van Every and Schmidt BMC Genomics
(2021) 22:380
Page 3 of 21
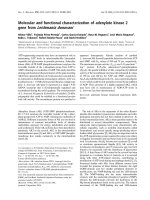
Fig. 1 Contrast in liver color at D4 and D20 post-hatch. The yellow color at hatch is indicative of the absorption and storage of yolk lipid and
nutrients that occurs during late embryonic development. The liver gradually changes to deep red as the chick grows, concurrent with the
depletion of the liver’s stores. Tissue was routinely sampled from the lower left lobe, as indicated by the red boxes. Note: Liver sizes are not on
the same scale
HCO3 is a blood buffer produced by the kidneys,
representing the metabolic component of acid-base
balance. Given a change in blood pH due to any of
these values, BE can help to differentiate between
respiratory or metabolic causes. It is calculated as
the difference between titratable base and titratable
acid, and not susceptible to respiratory factors such
as changes in PCO 2. An increase in pH was observed from D4 to D20, indicating a shift in acidbase balance as the birds age. The metabolic measures of acid-base balance (buffer HCO3 and BE)
were increased from D4 to D20, while the respiratory component was unchanged (PCO2), indicating
the shift in acid-base balance is largely due to
metabolic factors.
Transcriptome analysis: top 100 abundant transcripts
from each day
Examination of the 100 most abundant transcripts
expressed in either the D4 or D20 liver (total of 200)
identify important similarities in functions at these two
time points. Of these genes, 88 were common between
both D4 and D20. Enriched Gene Ontology (GO) terms
among these common genes included Translation,
encompassing 14 ribosomal proteins and Secretory
Vesicle, which included albumin along with proteins involved in lipid transport, complement and coagulation.
Two other enriched GO terms shared by both days were
Mitochondria and Oxidative Phosphorylation. These
terms were enriched by genes encoding mitochondrial
rRNAs and tRNAs along with NADH dehydrogenases,
Table 1 Summary of phenotypic trait and blood gas values by day, along with published references for comparison
Median
Mean + _ Standard Deviation
D4
p value
D20
Variable
trend
with age
Adult Breeder Values [19]
D4
D20
Range
Mean
Body Mass (g)
112.25
987.50
110.75 ± 5.54
912.64 ± 134.37
< 0.0001
+
NA
NA
Liver Mass (g)
3.77
23.35
4.29 ± 1.43
25.01 ± 4.28
< 0.0001
+
NA
NA
Normalized Liver Mass (%)
0.034
0.027
0.039 ± 0.012
0.028 ± 0.004
0.0214
–
NA
NA
pH
6.88
7.08
6.83 ± 0.13
7.05 ± 0.06
0.0034
+
7.28–7.57
7.42
PCO2 (mm Hg)
87.70
84.40
87.47 ± 23.51
91.03 ± 16.91
0.7513
NA
25.9–49.5
37.7
PO2 (mm Hg)a
82.00
61.00
88.29 ± 23.45
55.71 ± 9.16
0.0021
–
32.0–60.5
46.2
HCO3 (mmol/L)
17.90
24.80
15.39 ± 5.49
24.77 ± 1.05
0.0037
+
18.9–30.3
24.6
Base Excess (BE)a
−14.50
−6.00
−16.17 ± 3.82
− 5.86 ± 0.9
0.0031
+
−6.8 - 7.2
0.2
sO2 (%)
78.00
70.00
81.14 ± 7.73
70.29 ± 9.67
0.0398
–
70.6–93.3
82
Glu (mg/dL)
206.00
230.00
208.57 ± 18.79
238.86 ± 19.04
0.0112
+
207.2–260.7
234
TCO2
20.00
28.00
17.71 ± 6.02
27.57 ± 1.51
0.0044
+
19.9–31.5
25.7
Na (mmol/L)a
130.00
140.00
130.14 ± 2.54
139.14 ± 2.41
0.0025
+
141.6–152.6
147.1
a
Denotes Wilcoxon test was used instead of t-test
Van Every and Schmidt BMC Genomics
(2021) 22:380
Page 4 of 21
Fig. 2 Hierarchical clustering of morphometric and blood chemistry measurements from all birds. There were no i-STAT readings from three D4
birds, and all D20 birds are included regardless of quality elimination from transcriptome analysis
cytochrome oxidases and ATP synthase subunits. One
gene product unique to D20 encodes glucose 6phosphatase (G6PC) an enzyme critical to gluconeogenesis. Several transcripts encoding genes affecting additional processes were found in the D4 top 100 list that
were not in that D20 list (Tables S1A & S1B). These include proteins involved in lipid metabolism and transport, amino acid catabolism, peptidase inhibitors, a
sulfotransferase and hemoglobin A. These results indicate that, despite the changes undergone by the liver
from D4 to D20 the major hepatic functions such as
production of complement proteins, or secretion of albumin, are preserved between time points.
Transcriptome ontology analysis by day
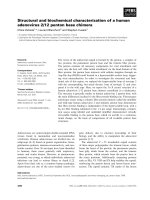
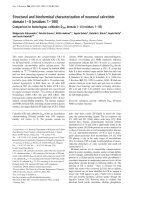
Ontology enrichment analysis using DAVID [20, 21]
showed distinct differences between time points (Fig. 3).
At D4, top Functional Annotation Clusters were related
to a variety of cell cycle elements including mitosis, cell
division, centromeric chromosome condensation & segregation, DNA replication, and transitions between cell
cycle phases. Other clusters contained terms involved in
ribonucleotide binding, kinase activity, amino-acid modification, vasculature development, and migration and
motility of epithelial cells. At D4, the top enriched
KEGG pathway from STRING [22, 23] was “Cell Cycle,”
with 36 out of 123 proteins represented. DNA replication and cellular senescence were also among the top
ten. Purine and Pyrimidine metabolism was the only
metabolic pathway enriched by the transcriptome at
D4. At D20, top Functional Annotation Clusters were
related to immune response, including T cell and B
cell receptor signaling pathways, toll-like receptor signaling pathway, immune cell aggregation, activation,
proliferation, and differentiation. One cluster contained terms related to oxidoreductase activity including heme binding and cytochrome P450. The top
enriched KEGG pathway at D20 was “Metabolic Pathways,” with 162 out of 1250 proteins represented.
Other enriched pathways were related to carbohydrate
metabolism, including fructose and mannose, and galactose, and immune-related pathway Th17 cell differentiation. Ontology and pathway analysis of the
transcriptome gave the first glimpse of the major processes important to the liver at each time point: rapid
organ growth and vasculature development at D4;
carbohydrate metabolism and immune cell population
expansion at D20.
Van Every and Schmidt BMC Genomics
(2021) 22:380
Page 5 of 21
Fig. 3 Gene Ontology Biological Process Terms enriched at either Day 4 (blue) or Day 20 (gold)
Hypoxic environment at D4
Early in the process of investigating the data, it was
noticed that HIF1A transcripts were elevated in the
D4 liver (log2 fold change 0.56, adjusted p-value
0.03), suggesting the tissue is under hypoxic conditions. To further evaluate this possibility, a list of human genes induced under hypoxic conditions was
downloaded from the Gene Set Enrichment Analysis
resource [24, 25] and used to extract the orthologs
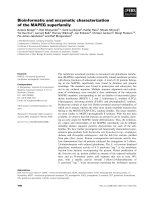
from the D4 and D20 expression data. Principal component analysis revealed that 43% of the variance was
associated with the day post-hatch; with the D4 samples showing elevated levels of many of the transcripts associated with hypoxia (Fig. 4, Table S2).
Fig. 4 PCA of hypoxia genes showing clear separation by day along
Dimension 1
Metabolome analysis: PCA, random forest, and top
significant metabolites
Principal component analysis of metabolites separated
D4 birds from D20 birds (Fig. 5a), and random forest
also correctly classified birds by age group. The top
compounds contributing to random forest classification
are shown in Fig. 5b. The top identified compounds contributing to random forest classification included two
more abundant at D4 (lysine, glutaric acid) and seven
more abundant at D20 (CMP, fumaric acid, fructose-6phosphate, fucose, malic acid, glucose-6-phosphate, succinic acid). Lysine is an essential amino acid important
for growth, and glutaric acid is a byproduct of amino
acid metabolism. Fumaric acid, malic acid, and succinic
acid are TCA cycle intermediates, while fructose-6phosphate, glucose-6-phosphate, and fucose are sugars
involved in glycolysis and other carbohydrate metabolic
pathways. CMP (Cytidine monophosphate), is a
pyrimidine-derived nucleotide.
By t-test, 90 compounds were more abundant at D4
and 112 at D20. Some of the top most significant compounds by log2 fold change and p-value are detailed in
Table 2. At D4, several of the top significant metabolites
were yolk-derived nutrients and fatty acids including retinal, oleic acid, palmitoleic acid, and gamma-tocopherol
(Vitamin E). Retinal, a retinoid derived from known egg
yolk nutrient Vitamin A, is critical in numerous processes including growth regulation and lipid metabolism
[26]. The second most significant compound, 2hydroxybutanoic acid, can be produced as a byproduct
of threonine catabolism and glutathione synthesis, and is
also part of propanoate metabolism [27]. Lactobiose (lactose), while most commonly known as a milk sugar, is a
common chicken feed additive. It is a disaccharide
Van Every and Schmidt BMC Genomics
(2021) 22:380
Page 6 of 21
Fig. 5 a PCA showing clear separation of individuals by top metabolites. D4 = green, D20 = red. b Top metabolites contributing to random forest
classification that correctly separated D4 and D20. Compound 84,922 was identified by PubChem ID as cytidylic acid (CMP)
Table 2 Top significant identified metabolites with pathway membership or role in metabolism. Lipid and amino acid metabolismrelated compounds predominated in D4, while many of those present in D20 were involved in carbohydrate metabolism
Compound
Fold-change
(Log2)
Adjusted p-value
Day
Pathway
Retinal
4.42
2.22E-10
D4
Vitamin A
2-Hydroxybutanoic Acid
3.34
4.25E-03
D4
Amino Acid-Glutathione Metabolism
Oleic acid
3.12
2.41E-3
D4
Lipid metabolism
Palmitoleic acid
2.87
5.98E-9
D4
Lipid metabolism
Lactobiose (lactose)
2.60
3.11E-5
D4
Carbohydrate metabolism
Phosphoserine
1.99
6.92E-5
D4
Serine metabolism
Uric Acid
1.79
1.03E-6
D4
Nitrogen metabolism
Phosphoenolpyruvate
1.77
1.11E-4
D4
Glycolysis (ATP synthesis phase)
Gamma-Tocopherol
1.73
2.73E-4
D4
Vitamin E metabolism
Uracil
1.66
1.59E-6
D4
Pyrimidine metabolism
3-Phosphoglycerate
1.63
3.67E-3
D4
Glycolysis (ATP synthesis phase)
Aspartate
−1.57
1.6E-4
D20
Amino acid metabolism
Adenosine
−1.64
5.7E-3
D20
Purine metabolism
Guanosine
−1.65
4.3E-3
D20
Purine metabolism
Hypoxanthine
−1.74
3.13E-4
D20
Purine metabolism
Creatinine
−1.82
7.65E-3
D20
Creatine metabolism
Citrate
−2.00
3.41E-5
D20
TCA cycle
Fructose-6-Phosphate
−2.15
4.86E-7
D20
Gluconeogenesis or Glycolysis (ATP incorporating phase)
CMP
−2.42
2.53E-7
D20
Pyrimidine metabolism, TAG, lipid & sialic acid synthesis
Inosine
−2.66
1.21E-5
D20
Nucleoside metabolism
5-Methoxytryptamine
−2.81
9.43E-7
D20
Tryptophan metabolism
Hexose-6-Phosphate
−3.25
5.51E-8
D20
Carbohydrate metabolism
Succinate
−3.35
2.64E-9
D20
TCA cycle
Glucose-6-Phosphate
−3.48
1.44E-6
D20
Gluconeogenesis or Glycolysis (ATP incorporating phase)
Fumarate
−4.87
1.9E-9
D20
TCA cycle
Malate
−5.32
9.28E-12
D20
TCA cycle
Van Every and Schmidt BMC Genomics
(2021) 22:380
comprised of glucose and galactose, and can serve as a
source of glucose. Phosphoserine is an intermediate of
amino acid metabolism, and uric acid is the major waste
product of protein catabolism in birds. Phosphoenolpyruvate and 3-phosphoglycerate are intermediates of glycolysis that are also involved in several other metabolic
pathways including the TCA cycle and lipid metabolism.
Phosphoenolpyruvate can be generated from TCA cycle
intermediate oxaloacetate and may reflect utilization of
alternative carbon sources. Uracil is an RNA pyrimidine
nucleobase. In the liver, as UDP-glucose, it has roles in
carbohydrate metabolism where it regulates the conversion of glucose to galactose [28].
In D20, several of the most significant identified metabolites were intermediates of the TCA cycle (malic
acid, fumaric acid, succinic acid, citric acid), or sugars
involved in carbohydrate metabolism (glucose-6-phosphate, hexose-6-phosphate, fructose-6-phosphate). Adenosine, guanosine, and inosine are nucleosides. CMP
and hypoxanthine are also part of purine and pyrimidine
metabolism. 5-methoxytryptamine is derived from serotonin, a neurotransmitter derived from tryptophan. Creatinine is a waste product of amino acid catabolism in
muscle. Aspartate is a non-essential amino acid.
Metabolome results show enrichment in lipids, vitamin A, vitamin E, carbohydrate, serine, cysteine, uric
acid and uracil metabolism as metabolic characteristics
of D4 post-hatch liver. In contrast, D20 metabolome
data show enrichment of the TCA cycle, gluconeogenesis (or glycolysis) pathways along with aspartate, tryptophan, creatine, purine, pyrimidine, and inosine
metabolism.
Metabolic pathway-level integration of transcriptome and
metabolome
Carbohydrate metabolism
Central carbohydrate metabolism consists of glycolysis,
gluconeogenesis, the tricarboxylic acid (TCA) cycle, and
the pentose phosphate pathway (PPP) (Fig. 6). Glycolysis
consists of two stages: 1) Conversion of free glucose to
two triose phosphates, 2) energy generation through
production of pyruvate. The integrated data suggests
that, at D4, the glycolysis pathway is enriched at the second, ATP-generating stage. The transcript encoding one
isoform of PFKP, the rate limiting enzyme responsible
for conversion of fructose-6-phosphate to fructose-1,6bisphosphate, was more abundant at D4. This may reflect isozyme selection by HIF1A to increase efficiency
of this pathway under hypoxic conditions. Furthermore,
two intermediate metabolites (3-PG, PEP), and transcripts encoding two enzymes from the second stage of
glycolysis (BPGM, PDHA1) were also enriched in the D4
samples. The enzyme BPGM and metabolite 3-PG represents a branching point in glycolysis. In the glycolysis
Page 7 of 21
pathway BPGM acts as a mutase, and regulates the entry
of 3-PG into either glycolysis or serine biosynthesis
through its effects on PGAM1. The product of BPGM
enzymatic activity, 2,3 bisphosphoglycerate (2,3 BPG)
serves as a phosphate donor to activate PGAM and promote glycolysis. LDHA, an enzyme involved in anaerobic
ATP production, was upregulated at D4, in addition to
transporters responsible for both import and export of
lactate (SLC16A3, SLC5A12). LDHA favors the conversion of pyruvate to lactate and regenerates the NAD+ required by the glycolytic glyceraldehyde-3-phosphate
dehydrogenase (GAPDH). All of these D4 enriched molecules may be critical to supporting production of liver
ATP via glycolysis under hypoxic conditions during this
early stage post-hatch.
The pyruvate dehydrogenase complex controls the link
between glycolysis and the TCA cycle. Transcripts encoding two of the three components of pyruvate dehydrogenase, the
E1 subunit
(PDHA1)
and
Dihydrolipoyl dehydrogenase (DLD) were enriched in
the D4 liver. In addition, the regulatory kinase PDK1,
which inactivates pyruvate dehydrogenase, was also elevated in the D4 samples. The increased abundance of
the pyruvate dehydrogenase subunit along with the
negative regulatory PDK1 suggests that metabolism at
D4 may be primed to respond rapidly to changes in
ATP levels and oxygen availability.
Several transcripts encoding rate-limiting sugar kinases
involved in the early steps of glycolysis were more abundant at D20 compared with D4 (HK3, GCK, PFKM,
PFKL). Corresponding first stage glycolytic metabolites
were also more abundant in D20 (glucose, G-6P, F-6P),
with G-6P having one of the highest fold changes when
compared with D4 (log2FC 3.48). HK3 and GCK have
key differences in their regulation. GCK specifically acts
on glucose, while HK will phosphorylate multiple types
of hexoses. GCK also has much lower affinity for glucose
than HK, and, unlike HK, GCK is not inhibited by its
product, G-6P. Thus, while HK maintains basal glucose
metabolism, GCK is responsible for phosphorylating excess glucose for other fates, such as glycogen synthesis
or diversion to the pentose phosphate pathway. Phosphofructokinase (PFK) controls glycolytic rate and is
under tight control, although there is evidence that isozymes differ in their regulation. Two isoforms of PFK
were more abundant at D20 than D4, one of which (liver
isoform PFKL) was upregulated in broiler chickens with
high growth potential when compared to crosses and
layer birds, suggesting that this isoform may contribute
to rapid growth rate of maturing birds [29]. The increased abundance of these enzymes and metabolites at
D20 suggests surplus of free glucose that can be diverted
to other metabolic fates or exported from the liver for
use by other tissues.
Van Every and Schmidt BMC Genomics
Fig. 6 (See legend on next page.)
(2021) 22:380
Page 8 of 21
Van Every and Schmidt BMC Genomics
(2021) 22:380
Page 9 of 21
(See figure on previous page.)
Fig. 6 Core carbohydrate metabolism including glycolysis & gluconeogenesis, the TCA cycle, and the pentose phosphate pathway. Genes and
metabolites that differed in abundance between days are highlighted, with abbreviations as follows: 1,3-BPG – 1,3-bisphosphoglycerate; 2-PG – 2phosphoglycerate; 3-PG – 3-phosphoglycerate; 6-PhGluLac – 6-phosphogluconolactone; 6-PhGlu – 6-phosphogluconate; α-KG – α-ketoglutarate;
BPGM – bisphosphoglycerate mutase; Cit – citrate; CS – citrate synthase; DHAP –dihydroxyacetone phosphate; DLD - dihydrolipoamide
dehydrogenase; Eryth-4P – erythrose-4-phosphate; F-6P – fructose-6-phosphate; F 1,6-BP – fructose-1,6-bisphosphate; Fum – fumarate; G-1P –
glucose-1-phosphate; GA3P – glyceraldehyde-3-phosphate; GCK – glucokinase; G6PC – glucose-6-phosphatase catalytic; G6PC3 – glucose-6phosphatase catalytic subunit 3; G-6P – glucose-6-phosphate; HK3 – hexokinase 3; IDH3A – isocitrate dehydrogenase 3 alpha; Isocit – isocitrate;
LDHA – lactate dehydrogenase A; Mal – malate; OAA – oxaloacetate; PDHA1 – pyruvate dehydrogenase E1 subunit alpha 1; PEP –
phosphoenolpyruvate; PFKM – phosphofructokinase, muscle; PFKL – phosphofructokinase, liver; PFKP – phosphofructokinase, platelet; PGLS – 6phosphogluconolactonase; PRPP – phosphoribosyl pyrophosphate; PRPS2 – phosphoribosyl pyrophosphate synthetase 2; Pyr – pyruvate; Ribl-5P –
ribulose-5-phosphate; RPEL1 – ribulose-5-phosphate-3-epimerase like 1; Sedohep-7P – sedoheptulose-7-phosphate; SDHC – succinate
dehydrogenase complex subunit C; Succ – succinate; Succ-CoA – succinyl-coA; TKTL1 - transketolase like 1; Xyl-5P – xylulose-5-phosphate
Glycogen metabolism and gluconeogenesis are two
pathways the liver uses to provide glucose to other organs during fasting. Typically, the first resource
exploited is glycogen. Glycogen can be synthesized by
the enzyme glycogen synthase from glucose-1-phosphate
(G-1P) and broken down by glycogen phosphorylase to
yield G-1P. Glycogen synthase transcripts along with
two isoforms of glycogen phosphorylase (PYGL, PYGB),
are enriched in the D20 liver. This, combined with the
observation that G-1P is also elevated in the D20 liver,
suggests that the D20 liver is capable of rapid response
to demands for either glycogen synthesis or phosphorolysis. In addition, the D20 liver is enriched for two
glucose-6-phosphatase mRNAs (G6PC, G6PC3), which
catalyze the last step of gluconeogenesis. As with glycogen metabolism, it appears that glucose metabolism in
the D20 liver is capable of rapid responses to the
demands of the body for glucose.
The TCA cycle is an aerobic pathway that continues
the oxidation of pyruvate, producing electron donors
NADH and FADH2 which will go on to oxidative phosphorylation. Multiple components of the TCA cycle are
upregulated at D20, indicating greater oxygen availability
and abundance of nutrients. At D20, several intermediate metabolites in the TCA cycle were more abundant
(citrate, α-ketoglutarate (α-KG), succinate, fumarate,
malate), along with mRNAs encoding three enzymes
(CS, ODGH, SDHC). All metabolites but α-KG were also
among the top most significant compounds at D20, in
terms of both log2 fold change and significance (see
Table 2). α-KG, fumarate, and succinate all serve as
entry points for catabolized glucogenic amino acids. CS
is the rate-limiting enzyme of the TCA cycle. Elevated
citrate is an important regulator of metabolism, with
high levels signaling abundant energy. Citrate inhibits
glycolysis through its action on phosphofructokinase and
stimulates fatty acid synthesis.
Components of the TCA cycle are reduced at D4 compared with D20 livers, consistent with response to hypoxic
conditions. Regulation of the pyruvate dehydrogenase
complex also suggests metabolic flexibility allowing for
rapid response to energy and oxygen levels and utilization
of alternative carbon sources for critical metabolites. At
D4, four TCA-related transcripts were more abundant
(PDHA1, DLD, IDH3A, FH). The rate-limiting pyruvate
dehydrogenase complex controls entry of pyruvate into
the TCA cycle, and is regulated by several enzymes whose
transcripts were also more abundant at D4 (PDP1, PDP2,
PDK1). This could represent increased responsiveness of
the pyruvate dehydrogenase complex to changes in ATP
and oxygen levels. One isozyme of isocitrate dehydrogenase, which interconverts isocitrate and α-KG, was upregulated at D4 (IDH3A). IDH1 and IDH2 can catalyze in
both oxidative and reductive directions and are involved
in hypoxia response when downregulation of the TCA
cycle requires alternate means to synthesize acetyl-CoA
and citrate. IDH3A, however, is irreversible and only converts isocitrate to α-KG. IDH3A is also localized to the
mitochondria, relies on NAD+ as a cofactor instead of
NADP+, and is allosterically regulated by a number of factors. Although hypoxic conditions typically favor conversion of α-KG to isocitrate as an alternative way to
generate acetyl-CoA and citrate [30], IDH3A still appears
to have a critical role in response to hypoxia. In cancer
cells, elevated levels of IDH3A ultimately lead to decreased levels of α-KG. In turn, reduced α-KG levels
stabilize the HIF1A protein thereby promoting angiogenesis [31]. Conceivably, the IDH3A mechanism documented in cancer cells may play an important role in the
normal development of the early post-hatch liver.
The pentose phosphate pathway utilizes glycolytic intermediates to produce NADPH for reducing power and
supplies pentoses for nucleotide synthesis. The nonoxidative branch of the PPP is upregulated at D4, consistent with rapid cell proliferation, while the oxidative
branch is upregulated at D20, perhaps to meet increased
demand for reducing power. At D4, two transcripts encoding enzymes in the non-oxidative branch of the PPP
were upregulated (TKTL1, PRPS2). TKT is the ratelimiting enzyme reversibly linking the PPP with glycolysis. Elevated levels of TKT could indicate intermediates
are being exchanged between pathways. The
Van Every and Schmidt BMC Genomics
(2021) 22:380
upregulation of PRPS2 suggests that ribose-5-phosphate
generated through the non-oxidative branch is going on
to purine and pyrimidine metabolism at D4. In contrast
at D20, enzymes (PGLS, RPEL1) and metabolites (ribulose-5P, xylulose-5P) involved in the oxidative phase of
the PPP were more abundant. Increased levels of RPEL1
suggests that ribulose-5-phosphate is also being recycled
back into glycolysis, prioritizing energy production
through complete oxidation of G-6P while concurrently
producing NADPH to provide the reducing agent
needed for lipid synthesis at D20.
Amino acid metabolism
Amino acids are the building blocks of proteins and also
serve many important metabolic functions. Several
amino acids, their derivatives, and waste products differed in their abundance between days, including nine
more abundant at D4 (arginine, lysine, threonine, cysteine, proline, ornithine, phosphoserine, urea, uric acid)
and three more abundant at D20 (aspartate, glutamine,
creatinine). Of the amino acids more abundant at D4,
three were essential (arginine, lysine, threonine) and
three non-essential (cysteine, proline, ornithine). Metabolite data was not able to differentiate ornithine from arginine, so we assume that one or both of them were
more abundant at D4. Arginine, ornithine, and proline
are glucogenic, typically being converted to glutamate
that is readily converted to TCA cycle intermediate αKG. However, an alternative pathway allows glutamate
to be converted to succinate. Cysteine is glucogenic and
can be converted to pyruvate. Lysine was one of the top
most significant metabolites more abundant at D4 and is
ketogenic through acetyl-CoA. Threonine is both glucogenic, through succinyl-CoA, and ketogenic, through
acetyl-CoA. Phosphoserine is an intermediate between
glycolysis and serine production. Urea and uric acid are
both nitrogenous waste products. At D20, both amino
acids that were more abundant were non-essential and
glucogenic (glutamine, aspartate). Glutamine is converted to glutamate, while aspartate is converted to oxaloacetate. These differences in abundance may reflect
increased catabolism of amino acids at D20, or differences in utilization of amino acids between days (Fig. 7).
As discussed above, at D4, the transcriptome data indicates that BPGM is shunting the intermediate 3-PG is
towards glycolysis. In contrast at D20, the downregulation of BPGM suggests glycolytic intermediates are being
directed towards serine biosynthesis. Two other transcripts encoding enzymes related to serine biosynthesis
from glycolytic intermediates were upregulated at D20
(PHGDH, GLYCTK). PHGDH directs 3-PG towards
serine biosynthesis, while GLYCTK converts glycerate to
glycolytic intermediate 2-PG, a precursor of 3-PG. Several transcripts encoding enzymes involved in serine and
Page 10 of 21
glycine metabolism were also upregulated at D20 (SDSL,
AGXT, PIPOX, SARDH, GNMT, ALAS2, GCAT,
AOC3). AGXT catalyzes a number of reactions, including the interconversion of serine and glycine, interconversion of serine and hydroxypyruvate, and
interconversion of glycine and glyoxylate. Both hydroxypyruvate and glyoxylate can go into glyoxylate metabolism. Although the main enzymes of the glyoxylate cycle
have not been found in chickens, the liver has been observed to have glyoxylate activity [32]. SARDH and
PIPOX generate glycine from sarcosine, while GNMT
interconverts sarcosine and glycine. Sarcosine is an
intermediate between glycine, creatine, and choline metabolism. SDSL catabolizes serine to pyruvate and also
converts threonine to 2-oxobutanoate, an alpha-ketoacid
intermediate of threonine catabolism, to succinyl-CoA.
ALAS2, GCAT, and AOC3 are all involved in generating
different metabolites from glycine.
Proline and lysine metabolism may indicate increased
collagen production and remodeling at D20. Although
both metabolites were more abundant at D4, several enzymes facilitating their incorporation into collagen were
upregulated at D20, (PYCR1, PYCRL, P4HA2,
LOC425607, L3HYPDH, HYKK). PYCR1 and PYCRL
are involved in the interconversion of proline, hydroxyproline, and pyrroline-5-carboxylate. P4HA2 and
LOC425607 are involved in formation of collagen structural components from 4-hydroxyproline or hydroxylysine, respectively. HYKK is a kinase that phosphorylates
hydroxylysine residues. One enzyme involved in collagen
synthesis was upregulated at D4 (PLOD2), which is responsible for hydroxylation of lysine residues, allowing
for cross-linking and stabilization of collagen.
Several transcripts upregulated at D4 encode enzymes
that yield alternative TCA cycle intermediates, while several transcripts upregulated at D20 encode enzymes generating pyruvate from amino acids. In lysine
degradation, two metabolites (lysine, glutarate) and two
enzymes (DLD, DHTKD1) were more abundant at D4.
DLD and DHTKD1 convert 2-oxoadipate to glutarylCoA, which can then be converted to glutarate and enter
the TCA cycle through succinate. In contrast, EHHADH
was upregulated at D20, supporting the canonical pathway of lysine degradation to acetyl-CoA. At D4, mRNAs
encoding enzymes affecting aspartate and glutamate
(ADSSL1, ALDH5A1) were enriched. ADSSL1 converts
aspartate to fumarate while ALDH5A1 metabolizes glutamate to succinate. Under normoxic conditions, aspartate is converted to oxaloacetate and glutamate is
converted to α-KG. Given the TCA cycle is downregulated at D4 due to hypoxia, diverting these amino acids
to different fates may allow them to be utilized more efficiently. Furthermore, this may serve a regulatory role
in controlling levels of α-KG. Hence, the D4 liver may