Báo cáo khoa học: An extension to the metabolic control theory taking into account correlations between enzyme concentrations potx
Bạn đang xem bản rút gọn của tài liệu. Xem và tải ngay bản đầy đủ của tài liệu tại đây (504.77 KB, 17 trang )
An extension to the metabolic control theory taking into account
correlations between enzyme concentrations
Se
´
bastien Lion
1,
*, Fre
´
de
´
ric Gabriel
1
, Bruno Bost
2
, Julie Fie
´
vet
1
, Christine Dillmann
1
and
Dominique de Vienne
1
1
UMR de Ge
´
ne
´
tique Ve
´
ge
´
tale, INRA/UPS/CNRS/INAPG, Ferme du Moulon, Gif-sur-Yvette, France;
2
Institut de Ge
´
ne
´
tique et
Microbiologie, CNRS UMR 8621, Universite
´
Paris Sud, Orsay Cedex, France
The classical metabolic control theory [Kacser, H. &
Burns, J.A . (1973) Symp.Soc.Exp.Biol.27, 65–104;
Heinrich, R. & Rapoport, T. (1974) Eur. J. Biochem. 42,
89–95.] does not take into account experimental evidence
for c orrelations between enzyme concentrations in the
cell. We investigated the implications of two causes of
linear correlations: competition between enzymes, which
is a mere physical adaptation of the cell to the limitation
of resources and space, and regulatory correlations,
which result from the existence of regulato ry networks.
These correlations generate redistribution of enzyme
concentrations when the concentration of an enzyme
varies; this may dramatically alter the flux and m etabolite
concentration curves. In particular, negative correlations
cause the flux to have a maximum value for a defined
distribution of enzyme concentrations. Redistribution
coefficients of enzyme conc entrations allow ed u s to c al-
culate the Ôcombined response coefficientÕ that quantifies
the response of flux or metabolite concentration to a
perturbation of enzyme concentratio n.
Keywords: biochemical modelling; cellular constraint; flux;
metabolite; response coefficient.
The introduction of the m etabolic control theory by Kacser
& Burns [1] and Heinrich & Rapoport [2] was a great
improvement in our understanding of the control of
metabolism (for a review see [3]). Numerous extensions to
the classical t heory have been proposed to get rid of some
restrictive hypotheses of the initial theory. Extensions exist,
for example, for nonproportionality of the rates of reaction
to enz yme co ncentration [ 4], e nzyme–enzyme interac tion
[5,6], time-varying systems [7,8], o r supply–demand analysis
[9]. Nevertheless, most studies have neglected the correla-
tions that exist between enzyme amounts in the cell.
Concentration is a key parameter for enzyme activity.
Changes in e xpression o f enzyme g enes play a central role in
the physiology of the cell, and dramatic modifications of the
cell proteome are consistently observed over development
and differentiation, or in response to environmental changes
(see for examples in various species). In
addition, genetic s tudies have revealed natural variability for
enzyme concentration, for i nstance f or alcohol dehydro-
genase in Drosophila [10] or lactate dehydrogenase in
Fundulus heteroclitus [11]. Other examples can a lso be
found [12,13]. Quantitative proteomic approaches have
confirmed that a majority of proteins/enzymes can d isplay
a large range o f variation within species [14–19]. Those
physiological or genetic variations are e xpected t o be
interdependent. T here is evidence for cellular constraints
that induce a variation of c oncentration of some enzymes
in response to a variation of others. These correlations
between enzyme concentrations undoubtedly have an
impact on the behaviour of metabolic systems, and hence
on their evolution. Two kinds of correlations will be studied
in this paper. The first one will be referred to as competition.
It is a mere physical adaptation o f the cell t o energetic or
steric constraints. The second one results from regulatory
networks. It will be referred to as regulation.
Competitive c onstraints o n the variation of enzyme
concentrations have already been pointed out. Such
constraints have the effect of avoiding macromolecular
crowding, which can result in a modification of catalytic
and/or thermodynamic properties of enzymes [20], i n a
limitation o f solubility leading to partial protein crystalliza-
tion or aggregation [21,22], or a decrease in the diffusion of
essential metabolites ([23], for a re view see [24]). Other
arguments include the limitation o f resources, the energetic
cost of maintaining the cellular concentrations of enzymes
[25–27], and the availability of amino ac ids or elements o f
the transcription and translation machinery, which has been
shown to b e a limiting factor o f protein synthesis in
Escherichia coli [28] and Saccharomyces cerevisiae [29].
Kacser & Beeby [30] were among the first to suggest that
the hyperbolic flux–activity relationship must ultimately
decline, for n o more profound reason than that the cell or
organism must eventually reach a point at which the cost of
producing excess enzyme outweighs the benefit in fitness
that can be derived from possessing the excess [31,32].
It is clear that such competitive constraints imply that
variations of enzyme concentrations are negatively correla-
ted: an increase in the concentration of some enzymes
Correspondence to D. de Vienne, UMR de Ge
´
ne
´
tique Ve
´
ge
´
tale,
INRA/UPS/CNRS/INAPG, Ferme du Moulon, 91190 Gif-sur-
Yvette, France. Fax: +33 1 69 33 23 40, Tel.: +33 1 69 33 23 60,
E-mail:
*Present address : Laboratoire d’e
´
cologie, E
´
cole normale supe
´
rieure,
46, rue d’Ulm, 75005 Paris, France.
(Received 1 9 July 2004, revised 20 September 2004,
accepted 22 September 2004)
Eur. J. Biochem. 271, 4375–4391 (2004) Ó FEBS 2004 doi:10.1111/j.1432-1033.2004.04375.x
causes a decrease in the concentration of other enzymes,
which can lead to important metabolic perturbations, i.e.
to the so -called protein burden effect [33]. For instance,
overexpression of b-galactosidase in E. coli was found to
reduce the synthesis of the other proteins [34] and over-
expression of glycolysis enzymes in Zymomonas m obilis has
been shown to reduce glycolytic flux [35]: therefore, for large
enzyme concentrations, the classical hyperbolic shape o f the
flux curve, as predicted by the metabolic control theory,
does not describe in a satisfactory way the behaviour of the
metabolic pathway. Flux can be expected to decrease when
enzyme con centration becomes too high, a nd it may be
interesting to model such behaviour.
Regulatory correlations can b e positive or negative. The
production and degradation of enzymes, which determines
their c oncentration, is related to the structure of the genetic
regulatory network [36]. The lactose operon in E. coli [37] is
a w ell known example of a regulatory s ystem that induces
correlations between the concentrations of the enzymes
involved in lactose metabolism. Several experimental and
theoretical studies have been devoted to the understanding
of the mechanisms of regulatory networks [38–41]. Meta-
bolic engineering makes an important use o f regulation of
metabolic pathways to achieve overexpression of the
products of interest. For instance, Prati et al. [42] reported
a way to ach ieve simultaneous inhibition and activation of
two glycosyltransferases of t he O-glycosylation pathway in
Chinese hamster ovary cells. In Lactococcus lactis, several
genes o f g lycolysis have been shown to b e e xpressed at
higher levels on glucose than on galactose [43]. The authors
interpreted this as a result of two different regulatory
networks. With the growing use of quantitative proteomics
methods, we can expect to find many more examples of
correlations between enzymes, even if we still lack the tools
to determine whether regulatory networks actually underlie
these correlations.
The existence of these competitive and regulatory corre-
lations between enzymes is assumed to constrain the
response of the metabolic systems. Here, we p resent an
extension of the metabolic control theory in w hich response
coefficients allow us to quantify the change of a metabolic
variable (flux or metabolite c oncentration) in response t o a
perturbation of a parameter (enzyme concentration) and to
the variations of other parameters r esulting from that
perturbation. We apply the general c oncept of a Ôcombined
response coefficientÕ to a linear model of redistribution of
enzyme concentrations in order to stu dy the systemic
consequences of enzyme correlations.
Control of metabolic pathways and
redistribution of enzyme concentrations
Control of metabolic variables
Let us consider a m etabolic pathway w ith n enzymes
E
1
,E
2
, …,E
n
catalyzing reversible reactions between s ub-
strates S
1
, …,S
m
(m metabolites).
To quantify the response of a systemic variable y,suchas
the flux in the pathway or the concentration of a metabolite, to
an infinitesimal change in the activity (concentration) of
enzyme E
k
, Kacser & Burns [1] and Heinrich & Rapoport [2]
introduced the control coefficient. In the revised nomen-
clature fo r metabolic control analysis, the control coefficient
C
y
k
is defined as the steady-state response in y to a change in
the local rate of step k, v
k
, with no reference to enzyme con-
centration ( />In particular, the control coefficient of flux J with respec t
to step k is:
C
J
k
¼
v
k
J
@J
@v
k
and the control coefficient of metabolite concentration S
i
with respect to step k is:
C
S
i
k
¼
v
k
S
i
@S
i
@v
k
Summation theorems can be derived for metabolite and
flux control coefficients. Summing over all reactions, we
have [1]:
X
n
j¼1
C
J
j
¼ 1and
X
n
j¼1
C
S
i
j
¼ 0
These relationships show that the control of flux (or
metabolite concentration) is shared among all enzymes in
the pathway.
Control coefficients are systemic p roperties. We can also
define local properties such as the elasticity, wh ich quantifies
theeffectofanyparameterp that affects the local rate of an
individual (isolated) step. The e lasticity coefficient e
k
p
for
step k is written a s [1]:
e
k
p
¼
p
v
k
@v
k
@p
Introducing correlations between enzyme concentrations
The classical form of metabolic control t heory implicitly
considers that enzyme concentration can increase towards
infinity, which is biologically inconsistent. Competitive and
regulatory constraints o n enzyme c oncentrations exist, that
can be described with a model of redistribution of enzyme
concentrations.
Weconsideredasystemstartinginastatedefinedbythe
concentrations
E
0
¼ðE
01
; E
02
; :::; E
0k
; :::; E
0n
Þ
of the n enzymes, and s upposed that a variation of the
concentration of a target enzyme E
k
results in a variation of
the concentrations of other enzymes.
Redistribution coefficient. In order to quantify the impact
of variation of enzyme E
k
on enzyme E
j
, we defined the
redistribution coefficient (a
kj
) as the ratio of an infinitesimal
change in the concentration E
j
to an infinitesimal change in
the concentration E
k
:
a
kj
¼
@E
j
@E
k
ð1Þ
In this framework, the enzyme concentrations become
interdependent parameters.
Combined response coefficient of the flux. If an effector p
acts on the flux through its effect on enzyme j, the response
4376 S. Lion et al.(Eur. J. Biochem. 271) Ó FEBS 2004
coefficient R
J
p
is the product of t he fl ux response coefficient
with respect to enzyme j and the elasticity of enzyme j with
respect to p [1]:
R
J
p
¼ C
J
j
e
j
p
Let us now assume that the effector p acts on more than
one enzyme in a m etabolic pathway. We c an define the
overall, multisite response obtained from the n enzymes of
the system as [44,45]:
R
J
p
¼
X
n
j¼1
C
J
j
e
j
p
This is only true for very small changes in p because the
response coefficient is defined as a first order approxima-
tion. For a large change in p, we should add correction
terms to account for nonlinearities.
Considering an effector p causing the redistribution of
enzyme concentr ations through the modification o f con-
centration E
k
of the enzyme E
k
(e.g. p is a mutation causing
an increase of E
k
and consequently modification of other
enzyme concentrations), we can write, replacing p by E
k
:
R
J
E
k
¼
X
n
j¼1
C
J
j
e
j
k
Assuming that the response of an isolated reaction i s
directly proportional to change in enzyme c oncentration, we
have:
e
j
k
¼
E
k
E
j
a
kj
so that
R
J
E
k
¼ E
k
X
n
j¼1
C
J
j
a
kj
E
j
ð2Þ
We call R
J
E
k
the combined response coefficient [46]. We
will show later (in the case of a linear metabolic pathway)
that the combined response coefficient can be e quivalently
written as:
R
J
E
k
¼
E
k
J
@J
@E
k
where the partial derivative is taken on a set of enzyme
concentrations that describes the correlations between
enzymes.
Biologically speaking, this m eans that the combined
response coefficient contains information about the corre-
lations between the enzyme concentrations, hence the term
ÔcombinedÕ. We can see the combined response coefficient
as a Ôresponse coefficient under constraintÕ. We can split
Eqn 2 into two t erms:
R
J
E
k
¼ C
J
k
a
kk
þ E
k
X
j6¼k
C
J
j
a
kj
E
j
Note that a
kk
¼ 1 (Eqn 1), so that
R
J
E
k
¼ C
J
k
þ E
k
X
j6¼k
C
J
j
a
kj
E
j
ð3Þ
TheeffectofavariationofenzymeE
k
on the flux appears
then to bedependent on two factors: (a) the control exerted by
enzyme E
k
on the flux, and (b) t he effect of enzyme E
k
on the
others, through the redistribution rules, which is modulated
by the control exerted by those enzymes on the flux. Thus,
even if enzyme E
k
has a high control coefficient on the flux, an
increase of E
k
should cause a decrease of the flux if E
k
is
negatively correlated with the concentrations of other
enzymes. We can also note that the response co efficient of
enzyme E
k
will be higher than its control coefficient i n cases
where enzyme E
k
is positively correlated with at least one
other enzyme of the pathway, and notcorrelatedtotheothers.
Thus, we have given a general expression for the
combined response coefficient of the flux, valid for a
networkofanycomplexity,withnoassumptionontherules
of redistribution of enzyme concentrations. In the next
paragraph, we will present the theoretical framework that
allowed us to describe the linear correlations between
enzyme concentrations, and in the second part of the
paper we will analyse in detail the particular case of a linear
pathway of enzymes far from saturation, considering the
response of both flux and metabolite concentrations.
Linear models of redistribution of enzyme
concentrations
We assumed linear redistribution, which means that a
kj
is
considered to be constant.
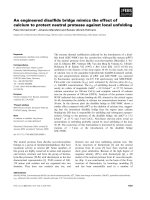
Figure 1 shows how enzyme co ncentrations are redis-
tributed due to their correlation s. Figure 1A corresponds to
the case o f independent enzyme concentrations that was
studied i n the founding papers of the m etabolic control
theory [1,2]. Figure 1B–G corresponds to various con-
straints that result in a redistribution of enzyme concentra-
tions over the variation of a particular enzyme.
Let us examine these constraints, the mathematical
expressions of which are summarized in Table 1 . We focus
on a linear model of redistribution of enzyme concentra-
tions but other models are possible. Let us further introduce
the normalized concentration e
j
defined as:
e
j
¼
E
j
E
tot
where
E
tot
¼
X
n
j¼1
E
j
Competitive correlations. In order to take into account the
fact that enzyme concentrations are likely to be bounded,
Heinrich et al. [47–49], and de Vienne et al . [46], have
proposed to put a constraint on the total concentration E
tot
of the enzymes in the p athway. In this paper, t his is designed
as competition and we limit the study to the quite rigid
constraint where E
tot
is a constant. We have:
X
n
j¼1
E
j
¼ E
tot
¼ const
Using the normalized concentration e
j
, the competitive
constraint on the metabolic pathway reads
X
n
j¼1
e
j
¼ 1 ð4Þ
Ó FEBS 2004 An extension to the metabolic control theory (Eur. J. Biochem. 271) 4377
In systems with o nly competitive constraints, the con-
centrations of enzymes E
j
("j „ k) d ecrease whe n the
concentration of enzyme E
k
increases and the proportions
of enzymes E
j
remain constant. So we can define the
competition coefficient c
kj
between enzymes E
k
and E
j
(i.e.
the constant proportion between these enzymes) as
A
B
C
D
E
F
G
Fig. 1. Redistribution of enzyme concentrations when the concentration of the target enzyme changes. We considered a six-enzyme pathway. E
3
is the
concentration of the target enzyme. The y-axis shows the concentrations o f enzymes E
1
, E
2
, E
4
, E
5
and E
6
. Unless otherwise stated , the starting
distribution of e nzyme concentrations is the vector E
0
¼ (0.04,0.02,0.04,0.37,0.44,0.09), i ndicated with dots on the figures. The concentration of
the ta rget enzyme var ies either between 0 and E
tot
¼ 1, or between E
3,min
and E
3,max
, depe nding on the c onstraints imposed on the system.
(A) Independence between enzyme concentrations. (B) Pure regulation with positive correlations. The redistribution coefficients are a
3
¼ b
3
¼
(0.99,0.63,1,0.94,0.43,0.29). (C) Pure regulation with one enzyme be ing n egatively c orrelated. a
34
¼ )0.94, th e o ther red istribution co efficien ts b eing
the same as in (B). (D) Co mpetition when the starting distribution of enzyme concentrations is the optimal one, which maximizes the flux. (E)
Competition when the starting distribution of enzyme concentrations is E
0
. (F) Regulation with com petition. T he starting distribu tion of enzym e
concentration s is E
1
¼ (0.13,0.13,0.31,0.04,0.02,0.37) and the redistribution coefficients are a
3
¼ (0.05,0.05,1,0.5,0.5,-2.1). (G) Regulation with
competition when the starting distribution of enzyme concentrations is E
0
and coregulation coefficients b (Eqn 6) are as in (B).
4378 S. Lion et al.(Eur. J. Biochem. 271) Ó FEBS 2004
8j 6¼ k c
kj
¼À
e
j
1 Àe
k
ð5Þ
Thus partial derivation of Eqn 5 with r espect to e
k
leads t o
@e
j
@e
k
¼ c
kj
and we have c
kk
¼ 1. As by definition a
kj
¼
@e
j
@e
k
,wehave
for pure competitive systems, a simple relationship between
competition and redistr ibution coefficients ( Table 1,
Appendix A):
8j 6¼ k a
kj
¼ c
kj
¼À
e
j
1 Àe
k
a
kk
¼ c
kk
¼ 1
which can also be derived from summation of Eqn 5.
Regulatory correlations. When redistribution of e nzyme
concentrations is only due to regulatory mechanisms, total
enzyme content has no upper limit, but enzyme concen-
trations are correlated. Variation of the concentration of
enzyme E
k
from E
k
to E
00
k
drives the system to a new state
E
00
1
; :::; E
00
j
; :::; E
00
n
,where
8jE
00
j
¼ E
j
þ b
kj
ðE
00
k
À E
k
Þð6Þ
where E
j
is the concentration of enzyme E
j
before the
variation of enzyme E
k
,andb
kj
is the coregulation
coefficient between enzymes E
j
and E
k
. The coefficients
can be positive, negative or null, but at least one is different
from 0. It is worth noting that b
kk
¼ 1.
In systems with only regulatory constraints, the coregu-
lation coefficient corresponds to the redistribution coeffi-
cient, i.e. a
kj
¼ b
kj
, as shown i n Appendix A (also Table 1).
Redistribution coefficients in competitive-regulatory path-
ways. When both competition and regulation are present in
a pathway, it is interesting to note that a simple relationship
exists between the redistribution coefficient a
kj
and the
coregulation coefficients b
kj
(Appendix A):
a
kj
¼
b
kj
À e
j
B
k
1 Àe
k
B
k
ð7Þ
where
B
k
¼
X
n
j¼1
b
kj
:
This relationship does not involve explicitly the competi-
tion coefficient c
kj
. But when there is no coregulation in the
system, we have "j „ k b
kj
¼ 0andB
k
¼ b
kk
¼ 1, so that:
a
kj
¼À
e
j
1 Àe
k
¼ c
kj
Application: the case of a linear pathway
of enzymes
We applied our model of redistribution o f enzyme con-
centrations to the linear pathway of enzymes far from
saturation studied by Kacser & Burns [1].
Flux and metabolite concentrations in a linear pathway
Let us consider a linear metabolic pathway, with n enzymes
E
1
,E
2
, …,E
n
converting a substrate X
0
into a final product
X
n
by a series of unimolecular reversible reactions:
X
0
¢
E
1
S
1
¢
E
2
S
2
¢
E
3
¢
E
nÀ2
S
nÀ2
¢
E
nÀ1
S
nÀ1
¢
E
n
X
n
The enzymes are supposed to be Mich aelian a nd far f rom
saturation. The s teady-state flux through t he pathway is
[1,2]:
J ¼
X
P
n
j¼1
1
V
j
M
j
K
0;jÀ1
ð8Þ
and the steady-state concentration of metabolite S
i
is
S
i
¼
J
X
K
0;i
X
0
X
j>i
1
V
j
M
j
K
0;jÀ1
þ
X
n
K
0;n
X
j i
1
V
j
M
j
K
0;jÀ1
0
@
1
A
ð9Þ
where X
0
and X
n
are the concentrations of substrate X
0
and
product X
n
, respectively, and X ¼ X
0
) X
n
/K
0,n
. X
0
and X
n
are c onsidered as fixed parameters of the systems, while the
intermediate metabolite concentrations S
i
(1 £ i £ n ) 1)
are variables. V
k
is the m aximum ve locity of enzyme E
k
, M
k
is its Michaelis constant, and K
0;k
¼
Q
k
j¼1
K
jÀ1;j
is the
product of the equilibrium constants of reactions 1, 2,…, k.
To make apparent the concentration of enzymes, E
k
,in
Eqns 8 an d 9, we used the relationship:
V
k
¼ k
cat;k
E
k
where k
cat,k
is the turnover number of enzyme E
k
.
We can then define the a ctivity parameter A
k
of enzyme
E
k
by:
A
k
¼
k
cat;k
M
k
K
0;kÀ1
with K
0,0
¼ 1 by convention.
Table 1. Mathematical expressions of the r edistribution coefficients of
enzyme concentrations a
kj
when introducing competitive and/or regula-
tory constraints. a
kj
is the ratio of a change in t he concentration E
j
to a
change in t he con centration E
k
. Note that values of a
kj
are only true f or
j „ k because a
kk
is always eq ual to unity. The subscript k refers in this
table to the enzyme whose concentration we want to vary, for instance
through experimental or g enetic means (see Appendices A to D for
more details).
No competition
(E
tot
is not constant)
Competition
(E
tot
is constant)
No regulation
8j 6¼ k a
kj
¼ 0
a
kk
¼ 1
8j 6¼ k a
kj
¼ c
kj
¼À
e
j
1 À e
k
a
kk
¼ c
kk
¼ 1
X
n
j¼1
c
kj
¼ 0
Regulation
8j 6¼ k a
kj
¼ b
kj
b
kk
¼ 1
8j 6¼ k a
kj
¼
b
kj
À e
j
B
k
1 À e
k
B
k
a
kk
¼ 1
X
n
j¼1
a
kj
¼ 0
Ó FEBS 2004 An extension to the metabolic control theory (Eur. J. Biochem. 271) 4379
The steady-state flux through the pathway is thus
J ¼
X
P
n
j¼1
1
A
j
E
j
ð10Þ
and the steady-state concentration of metabolite S
i
is
S
i
¼
J
X
K
0;i
X
0
X
j>i
1
A
j
E
j
þ
X
n
K
0;n
X
j i
1
A
j
E
j
!
ð11Þ
Below, we will consider the catalytic component A
k
is
constant and only consider variations of enzyme concen-
trations, in order to study how biological constraints on
these concentrations can modify the behaviour of metabolic
pathways.
Variation of flux and metabolite concentrations
in unconstrained pathways
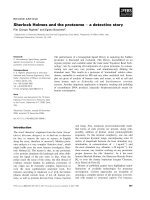
When enzyme concentrations are not correlated, i.e. when
there are no competitive or regulatory constraints, both flux
and metabolite concentrations reach a plateau when the
concentration of a particular enzyme E
k
increases (Fig. 2).
Considering the concentrations of the other enzymes as
constants, the maximum flux value is (Eqn 10 a nd a general
theoretical background in Appendix B):
J
max
¼
X
P
j6¼k
1
A
j
E
j
The concentration of a metabolite located downstream of
the variable enzyme increases until it reaches a plateau
(Appendix C):
S
down
i
¼
K
0;i
P
j6¼k
1
A
j
E
j
X
0
X
j>i
1
A
j
E
j
þ
X
n
K
0;n
X
j i
j6¼k
1
A
j
E
j
0
B
@
1
C
A
The concentration of a metabolite l ocated upstream of the
variable enzyme decreases until it reaches a minimum value:
S
up
i
¼
K
0;i
P
j6¼k
1
A
j
E
j
X
0
X
j>i
j6¼k
1
A
j
E
j
þ
X
n
K
0;n
X
j i
1
A
j
E
j
0
B
@
1
C
A
It is clear that the level o f the asymptotes depends on the
concentrations of the other enzymes.
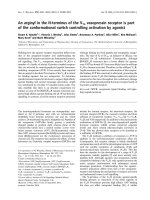
Consequences of enzyme redistribution on the flux
Figure 3 describes the change in flux that results from
different types of correlations and corresponds to various
constraints that result in a redistribution of enzyme
concentrations over the variation of a particular enzyme.
Competitive-regulatory pathways. Introducing both com-
petitive and regulatory c orrelations in the system will alter
the flux curve with respect to enzyme concentration. These
constraints result in a limited range of variation for enzyme
concentrations, a nd in the variation of concentration of
an enzyme being limited by that of the others. If the
concentration of a given enzyme b ecomes high, the
concentration of another is likely to vanish, therefore
bringing the value of the flux to zero. Therefore, in this
model, each en zyme has a range of variation [e
min
,e
max
]in
which the flux is positive.
Over the range of variation of the concentration of
an enzyme, t he flux increases to a maximal value, t hen
decreases when the concentration is lower or higher. This is
due to the fact that at least one redistribution coefficient
must be negative when competition is introduced.
Moreover, everything else being equal, each set of
redistribution c oefficients results in a particular flux curve.
As will be mentioned later, all the possible curves are
restricted by an envelope curve.
Relationship between redistribution and combined res-
ponse coefficients. In order t o analyse the response of t he
flux to the variation of enzyme concentration in constrained
pathways, we used the combined response coefficient we
have defined previously. A ll the results in this section depend
on the assumption that the pathway is linear with mass-
action kinetics, which ensures analytical tractability.
Replacing C
J
j
by its expression in Eqn 2, we easily find an
analytical expression for the combined response coefficient:
0.0040.0030.002
Flux
0.0010.0002.01.81.61.41.21.0
Metabolite concentration
0.0
A
B
0.2 0.4 0.6 0.8 1.0
Concentration of enzyme 3
0.0 0.2 0.4 0.6 0.8 1.0
Concentration of enzyme 3
Fig. 2. Variation of metabolic variables in a linear unconstrained path-
way with respect to concentration of one enzyme. Unless stated other-
wise, all plots describe a six -enzyme pathway with activities A
1
¼ 0.32,
A
2
¼ 0.83, A
3
¼ 0.72, A
4
¼ 0.04, A
5
¼ 0.40, A
6
¼ 0.16. The x-axis
is the concentration of enzyme 3. The concentrations of enzyme are
(0.04,0.02,E
3
,0.37,0.44,0.09). Furthermore, we choose X
0
¼ 2and
X
n
/K
0,n
¼ 1 (therefore, X ¼ 1). (A) Variation of fl ux in a linear
unconstrained pathway with respect to concentration of one enzyme.
The fi gure shows the classical hyperbo lic flux curve. (B) Variation of
metabolite concentration in a l inear unconstrained pathway with
respect to concentration of one enzyme. The figure shows the variation
of concentration of a metabolite upstream (solid line) and a m etabolite
downstream (dashed line) the variable enzyme.
4380 S. Lion et al.(Eur. J. Biochem. 271) Ó FEBS 2004
R
J
e
k
¼
J
XE
tot
e
k
X
n
j¼1
a
kj
A
j
e
2
j
ð12Þ
In Ap pendix D we present another derivation using the
fact that R
J
e
k
¼
e
k
J
@J
@e
k
.
Unlike t he control coefficient, th e flux combined response
coefficient can become negative, as a consequence of
competition and/or negative coregulation (Fig. 4). Limits
of flux combined response coefficient are +1 for the
minimal value of e
k
and – 1for the maximal value (Appendix
D). Flux reaches an absolute maximal value for a vector of
enzyme concentrations ( e
1
,…, e
n
) defined by [47,50] such t hat
e
Ã
k
¼
1
ffiffiffiffi
A
k
p
P
n
j¼1
1
ffiffiffiffi
A
j
p
ð13Þ
and t he flux combined response coefficient is null when
e
k
¼ e
Ã
k
.
The envelope curve. For each value of e
k
,wecandetermine
a maximum value for the flux (Appendix E) a nd consider
the curve that passes through all these points. This curve will
be called the envelope curve.
Does this envelope curve correspond to a peculiar
redistribution system o r t o a mere mathematical construc-
tion? In Appendix E , w e used the optimization method
proposed by Heinrich et al. [47,50] t o show that the envelope
curve corresponds to a pure competitive model. It passes
through the absolute maximum of flux under the constraint
of Eqn 4, which is reached for a vector of concentrations
(e
Ã
1
; :::; e
Ã
n
) as defined in Eqn 13. For a ll values of e
k
,wehave:
8i; j 6¼ k
e
i
e
j
¼
ffiffiffiffiffi
A
j
A
i
r
AB
CD
Fig. 3. Relationship between flux and enzyme concentration for different models of enzyme redistribution. We consider a six-enzyme linear pathway
with activities as in Fig. 2. The other p arameters are the same as in Fig. 1. The vertical dashed line indicates the point corresponding to reference
distribution E
0
. ( A) Pure regulation with positive or null correlations. Solid line: all the a
i
’s are positive. Dashed line: a
36
¼ 0. Dotted line: a
36
¼ 0
and a
35
¼ 0. Dash ed-do tted line: all the a
i
’s are zero. (B) Pure regulation with one negative correlation. D ashed line: wit h one enzyme being
negatively correlated. Solid line: pure regulation with positive correlations [compare w ith (A)]. (C) Competition. Solid line corresponds to the
redistribution coefficients in Fig. 1D, and dashed lin e t o those in Fig. 1E. (D) Regu lation with competition. Solid l ine is competition as sh own in
(C); dashed and dotted lines describe regulation with competition (dotted line corresponds to the redistribution coefficients in Fig. 1F, dashed line to
those in Fig. 1G).
100
500–50–100
Flux combined response coefficient
Concentration of enzyme 3
0.2 0.3 0.4 0.5 0.6
Fig. 4. Variation o f flux combined response coefficient with respect
to the concentration of one enzyme, under the constraint of Eqn 4
(competition). Flux combined response coefficient is positive for
e < e*, null for e ¼ e* and negative for e > e*, where e*isthe
concentration leading to the optimal value of flux, as defined by
[47] (Appendix E).
Ó FEBS 2004 An extension to the metabolic control theory (Eur. J. Biochem. 271) 4381
Moreover, we show that the redistribution c oefficients of
the envelope curve are given by:
a
kj
¼À
e
Ã
j
1 Àe
Ã
k
Therefore, whatever the redistribution rules, for a given
set of fixed activities, all flux curves will be bounded by t he
envelope curve we have defined.
Pure regulatory pathways. When only regulatory con-
straints are present, two subcases of interest should be
mentioned: positive and negative correlations.
Positive correlation is presented in Fig. 3A.
When all coregulation coefficients are positive, the flux
asymptotically tends towards a straight line, as the c oncen-
tration of e nzyme E
k
increases. The coefficients of this line
are g iven in Ap pendix B. If, starting from the situation
where all the enzymes are positively coregulated, we choose
to set p coregulation coefficients to z ero, the flux curve will
reach a plateau, which is characterized by the following flux
value (Appendix B):
J
ðpÞ
max
¼
X
P
j2I
p
1
A
j
E
j0
with i 2 I
p
if a
ki
¼ 0 (i.e. enzymes E
i
are independent from
enzyme E
k
).
The higher the number of coregulation coefficients (i.e.
the less t he enzymes are coregulated ), the lower t he plateau,
and when no enzymes are coregulated with enzyme E
k
,the
maximum flux value J
ðnÀ1Þ
max
is the one found by Kacser &
Burns [1]:
J
ðnÀ1Þ
max
¼
X
P
j6¼k
1
A
j
E
j0
Negative correlation is presented in Fig. 3 B.
When at least one redistribution coefficient is negative,
the flux curve reaches a maximum beyond which it declines
towards zero (Appendix B).
Pure competitive pathways. Here, we c onsider that the
total concentration of the enzymes is constant (Eqn 4) and
that only proportional redistribution occurs between the
enzymes of the pathway (a
kj
¼ c
kj
¼À
e
j
1Àe
k
). This means
that an increase in the concentration of a given e nzyme E
k
causes a decrease in the concentrations of the others, in
proportions remaining c onstant. Mathematically speaking,
this is equivalent to setting "
j
„ k, b
kj
¼ 0 in the expression
of a
kj
(Eqn 7).
Therefore, in this particular model the flux response
coefficient reads (Appendix D):
R
J
e
k
¼
e
k
1 Àe
k
J
XE
tot
1
A
k
e
2
k
À 1
for the enzyme E
k
that causes the redistribution of the other
concentrations, and:
8
j
6¼ k R
J
e
j
¼ 1 À
J
XE
tot
1
A
k
e
2
k
for the other enzymes.
Thus it must be stressed t hat because of the abs ence of
coregulation, the limit of the combined response coeffi-
cients for e
k
¼ 0 is not +1 anymore, but is now 1
(Appendix D).
As in the competitive-regulatory model, the shape of the
flux-activity curve is altered and points out that enzymes
should possess an optimal concentration beyond which the
flux decreases (Fig. 3C), as it had been predicted previously
[30,49,51].
When concentration of enzyme E
k
varies from 0 t o E
tot
,
we only need to know the proportional redistribution
coefficients in order to determine the concentrations of the
other enzymes. Therefore, we can draw several flux curves,
each one determined by a set of proportional redistribution
rules. When e
k
¼ 0ore
k
¼ 1, the flux is null. The
maximum value of the flux curve depends on the
redistribution coefficients for this curve. These d ifferent
curves correspond to unoptimized distributions of the
concentrations, i.e. distributions where a
kj
6¼Àe
Ã
j
ð1 Àe
Ã
k
Þ,
e
Ã
k
being defined by Eqn 13 (the optimum distribution). As
the optimum distribution co rresponds to the e nvelope
curve (see above), all the curves corresponding to unop-
timized distributions have flux values less than those of the
envelope curve.
Consequences of enzyme redistribution on metabolite
concentrations
When the metabolite concentrations are considered as
systemic variables, similar t reatment applies be cause the
results on redistribution, competition and coregulatio n
coefficients between enzyme concentrations are still valid.
Metabolite concentrations are a lways bounded. For a
linear pathway with a positive flux, the metabolite concen-
tration w ill have a lower limit corresponding to the w eighted
concentration o f t he input substrate of t he system (X
0
K
0,i
)
and an upper limit corresponding to X
n
K
0,i
/K
0,n
(Eqn 11).
The range of variation of the concentration of metabolite S
i
is therefore equal to K
0,i
G,whereG is the equilibrium ratio
X
0
K
0,n
/X
n
. This means that the f urther the system is from
equilibrium, the more the metabolites are free to vary.
Interestingly, this also implies that the variation of metabo-
lite concentrations is constrained by environmental param-
eters, independently of the catalytic properties of the
enzymes. It is important to note that this feature only
results from the particular expression of S
i
in a linear
pathway and not from the introduction of redistribution
rules.
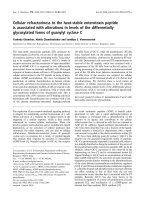
As for the flux, we summarize in Fig. 5 the change in
metabolite concentrations (actually S
i
/K
0,i
and not S
i
)asa
result of various correlations between enzyme concentra-
tions.
Relationship between redistribution and metabolite com-
bined response coefficients. As in the case of t he flux, we
can define a combined response coefficient for the concen-
tration of metabolite S
i
, with respect to enzyme E
k
:
R
S
i
e
k
¼
X
n
j¼1
C
S
i
k
e
j
e
k
¼
X
n
j¼1
C
S
i
k
a
kj
e
k
e
j
We can show that it is equivalent to calculate:
4382 S. Lion et al.(Eur. J. Biochem. 271) Ó FEBS 2004
R
S
i
e
k
¼
e
k
S
i
@S
i
@e
k
on a suitable set of enzyme concentrations describing the
constraints.
In competitive-regulatory systems, we have the followin g
relationship between the metabolite combined response
coefficient an d the redistribution coefficients (Appendix F):
R
S
i
e
k
¼
e
k
S
i
J
2
K
0;i
XE
2
tot
X
j i
a
kj
A
j
e
2
j
X
j>i
1
A
j
e
j
À
X
j<i
a
kj
A
j
e
2
j
X
j i
1
A
j
e
j
!
ð14Þ
It is easy to show that the value of metabolite c ombined
response coefficient is 0 for e
k
¼ e
min
andthatitcanbe
positive or negative, but is always bounded.
It is wort h noting that in the absence of any regulatory
constraint in the system, we get two relationships between
metabolite combined response coefficient and redistribution
coefficients, depending on the position of t he variable
enzyme E
k
with respect to the metabolite S
i
(downstream or
upstream), as shown in Appendix F:
k i R
S
i
e
k
¼
J
2
XE
2
tot
K
0;i
S
i
X
j>i
1
A
j
e
j
!
1
A
k
e
k
1
1 Àe
k
k>i R
S
i
e
k
¼À
J
2
XE
2
tot
K
0;i
S
i
X
j i
1
A
j
e
j
!
1
A
k
e
k
1
1 Àe
k
8
>
>
>
>
>
<
>
>
>
>
>
:
Competitive-regulatory pathways. The competitive and
regulatory constraints also change the pattern of variation
of metabolites concentrations when enzyme concentration
becomes too high. The global behaviour of metabolite
concentration w ith r espect to enzyme concentration is
dramatically altered for large enzyme concentrations.
As we take into account competition in this section, there
is at least one negative redistribution coefficient, which
means that t he concentration o f at least one enzyme ‘
vanishes for e
k
¼ e
max
. Therefore, metabolite concentration
will be minimal when e
k
¼ e
max
if ‘ > k and maximal if
‘ £ k (Appendix C).
The behaviour of the system is fully determined by the
sign and the magnitude of the redistribution coefficients
between enzymes. Therefore, three kinds of behaviour can
be distinguished in this system (Fig. 5D): (a) a ÔU-shapedÕ
variation whereby the upstream m etabolite decreases f rom
X
n
K
0,i
/K
0,n
to a m inimum value and then increases until the
maximal concentration is reached again; (b) a monotonous
variation allowing the metabolite concentration to describe
the whole range of variation; (c) a Ôhump-shapedÕ variation
whereby the downstream m etabolite concentration increa-
ses from X
0
K
0,i
to a maximum value, and then decreases
towards X
0
K
0,i
.
Hence, the model can account for a variety of behaviours
of the metabolite concentrations. We can say that the
behaviour of the system depends on the position in the
pathway o f t he e nzyme whose concentration becomes 0
when the target enz yme reaches its maximal value. The key
point is to know whether the enzyme is located upstream o r
downstream t he metabolite (Appendix C). Thus, an increase
in the concentration of a n enzyme can induce e ither an
increase or a decrease in the concentration of a metabolite.
This can be related to what is observed in many human
metabolic diseases, which can be caused either by a n e xcess
AB
CD
Fig. 5. Relationship between metabolite c oncentrations and enzyme concentration for different models of enzyme redistribution. The parameters are
thesameasinFig.1.NotethatplotsareS
i
/K
0,i
and n ot S
i
alone. (A) Indep endent enzymes. (B) Pure regulation with positive correlations.
(C) Competition. (D ) Regulation with competition. The two up per curves represent metabolites u pstream of the variable enzyme; the t hree oth er
are downstream metabolites.
Ó FEBS 2004 An extension to the metabolic control theory (Eur. J. Biochem. 271) 4383
or by a lack in a given metabolite. By extending our model
to nonlinear correlations and pathways, we can expect
to o bserve s imilar patterns with nonbounded metabolite
concentrations.
Pure regulatory pathways. In this case, the total enzyme
concentration is not constant but at least one regulation
coefficient is non-zero. As for flux, two subcases of interest
should be mentioned.
If there a re positive correlations (Fig. 5B), i.e. a ll the
redistribution coefficients are positive, the metabolite con-
centration curve reaches a plateau whatever the position of
the metabolite in the pathway with r espect to the enzyme:
downstream or upstream. The l evel of the p lateau is
different from that of the unconstrained case a nd is given in
Appendix C.
With negative correlations, i.e. when at least one redis-
tribution coefficient is negative, the concentration of meta-
bolite S
i
is seen to increase or decrease towards the upper or
the lower limits of metabolite concentrations (Appendix C).
This is due to the fact that, when two enzymes are negat-
ively correlated, an increase in the first one ultimately causes
the second one to vanish.
Pure competitive pathways. In a pure competitive pathway
(Fig. 5 C), the behaviour of metabolite concentrations is not
affected by the introduction of proportional redistribution
and the general behaviour of the system i s the same as the
one predicted by the classical metabolic control theory
(Fig. 5 A). Upstream m etabolites are found to decrease until
a plateau is reached (when all enzyme concentrations are
null e xcept t he varying enzyme), whereas downstream
metabolites are found to increase until a plateau is reached.
The values of t he plateau for both an upstream and a
downstream e nzyme are different from those of a n
unconstrained pathway (Appendix C).
The pure competitive model shows therefore that taking
into account proportional redistribution between enzymes
can dramatically modify the flux through the pathway
without altering the qualitative behaviour of metabolite
concentrations.
Discussion
We develop ed a n extension to the metabolic control t heory
that takes into account the existence of correlations
between enzyme concentrations in the cell. In our model,
enzyme concentrations are linked by so-called redistribu-
tion coefficients, which account for the effect of the
variation of one enzyme concentration onto the concen-
tration of other enzymes. We have distin guished two kinds
of correlations: competition and regulation. This distinc-
tion is not a mere artifice. In the literature, there are
multiple examples of correlations due to regulatory m ech-
anisms, at the transcriptional a nd/or (post) translational
levels. Competition is less popular, but is also documented.
For instance Snoep et al. [35] showed experimentally that
overexpression of plasmid-encoded protein in Z. mobilis
could lead to the dilution of other enzymes and therefore
cause a r eduction in the glycolytic flux. This protein burden
effect is likely to be more critical in organisms like
Z. mobilis , where 50% of the cytoplasmic proteins are
reserved for glycolytic enzymes [52], than in E. coli where
these enzymes are present at low concentration. In the same
line, Parsch et al. [53] showed in Dr osophila that t he
deletion of a conserved regulatory element in the Adh gene
resulted in increased ADH overexpression and activity, but
delayed development.
As enzyme con centrations are not independent, the
control of flux or metabolite concentrations cannot be
quantified with the classical control coefficient a nymore.
Using the concept of response coefficients, we have showed
how correlations between enzyme concentrations can affect
flux and metabolite concentrations in a pathway, and how
this effect can be quantitatively measured. For the flux, we
gave a general expression (Eqn 3) showing how the
interplay of the redistribution of enzyme concentrations
and of the control of enzymes on the flux determine the
response of any metabolic pathway to a variation of enzyme
concentration. A similar treatment can be applied to
metabolite concentrations. The combined response coeffi-
cient can take any positive or negative value, while the
control coefficient varies between 0 and 1 (at least in simple
linear pathways). As a major and general c onclusion of the
model, we showed that, if t he concentration of a n enzyme is
negatively correlated with the concentrations of other
enzymes, increasing the concentration of that enzyme will
cause the flux to have a maximum, even if the control of this
enzyme on the flux is strong.
The influence of t he redistribution c oefficients on the
combined response coefficient means that the correlations
between enzyme concentrations modify the control distri-
bution pattern within the pathway. However the combined
response c oefficients do not exhibit a simple summation
property, unlike the classical control coefficients. Thus, it
would be hazardous to use control coefficient summation
property in t op-down control a nalysis to e stimate the
control of steps that have not been studied through
modulation of enzyme efficiency, especially in cases where
competition and/or regulation are likely to be present.
Another a pproach to study the distribution of control has
been developed by Westerhoff’s group [54,55], w hich applies
to multilevel networks. These networks are divided into
modules where r eactions are linked by m ass t ransfer,
whereas modules can interact with each other only by
regulatory effects. This approach allows the determination
of the r ole of enzyme level in metabolic control, by
considering that nonmetabolic modules can have a share
of the metabolic control.
For the sake of analytical tractability, we chose to study in
detail a simple linear m etabolic pathway. We showed that
introducing correlations between enzyme concentrations
alters th e shape of the flux and metabo lite c urves. For the
flux, there is indeed a maximum value for any redistribution
rule, provided that at least one coefficient is negative (due to
competition or negative regulation): the enzymes have an
optimal concentration beyond which the flux decreases, as
already predicted or demonstrated [30,47,50,51] in the case of
competition alone. T he only case where there is no maximum
flux value is when all e nzymes are positively correlated. In
metabolic engineering, the only way to have high fluxes is to
increase all enzyme concentrations simultaneously. As it can
be technically difficult, it s hould b e m ore p racticable to
optimize the distribution of enzyme amounts in the system
4384 S. Lion et al.(Eur. J. Biochem. 271) Ó FEBS 2004
with fine regulation of gene expression, with tools such as
synthetic promoter libraries in microorganisms.
Hartl et al . [51] have underlined that in most cases, the
maximum of the flux curve is expected to be broad, which is
consistent with the plateau typically observed when plotting
flux against enzyme concentration . However, in particular
cases, the maximum could be sharply defined. Koehn [31]
has emphasized that the ÔbreadthÕ of the maximum depends
on the enzyme, as a function of the turnover cost. Variation
of the concentrations of enzymes allowed us to obtain flux
curves with sharp or broad maximum. Furthermore, it is
clear that a less rigid constraint on total enzyme amount
would lead to a broader maximum, as an enzyme amount
should increase in a given r ange without limiting the others.
The extension of our model to the metabolite concentra-
tions allowed us to clarify how constraints at the enzyme
amount level c an interfere w ith metabolite pools. In systems
with competition alone, the behaviour of metabolite con-
centrations is qualitatively the same as in systems without
any constraint. Upstream metabolites decrease when the
variable enzyme amount increases, whereas downstream
metabolites increase. C hanges are observed for the asymp-
totic values of the metabolite concentrations when the
variable enzyme amount increases to E
tot
. Thus metabolite
pool sizes are not very affected by competition as compared
to the flux. With only positive regulations, the metabolite
behaviour can be modified, with upstream metabolites
increasing when the variable enzyme amount increases,
which is impossible in systems with no constraint. Intro-
ducing negative regulations leads to a great variety in
metabolite behaviours, with different types of curves
ranging from ÔU-shapedÕ to Ôhump-shaped Õ, with also
monotonous variations. The behaviour of a metabolite
depends both on its position relative to the variable enzyme
(upstream or d ownstream) and on the sign of the correla-
tions in the system. Metabolites displaying ÔU-shapedÕ and
Ôhump-shapedÕ curves have a restricted range of variation as
compared to other metabolites.
Our linear approximation of e nzyme c orrelations is
certainly too naive. It might be more realistic to consider
correlation coefficients that are null for small values of
enzyme concentration and non-null for large concentra-
tions, or to consider coefficients that are a growing function
of enzyme concentration. Experimentally, the parameters of
the constrained model could be estimated, for example
using overexpression libraries in bacteria or yeast [56], or
exploiting natural variability of protein concentration. It is
expected that non-null redistribution parameters would be
observed only for highly expressed proteins. Furthermore
we chose a quite rigid constraint on total e nzyme concen-
tration, because we considered E
tot
as a constant. It would
be more appropriate to consider that the quantity o f protein
the cell allocates to a particular metabolic pathway is
between a lower and an upper bound.
Of course, it would be interesting to investigate the
predictions o f the model fo r more complex pathways
(branched, with feedback inhibition, etc.). However, we
think t he re sults w e obtained from this simplified example
already shed light on some interesting consequences of
correlations between enzymes, or at least on some questions
that should be tackled in future work. A n interesting
extension of the competition model could be to consider
competition between metabolic pathways or networks. For
a given pathway, it is likely that the distribution of total
enzyme amount between the enzymes should be optimized
by evolution with r espect to catalytic properties of the
enzymes. But at the cellular level, there would be compe-
tition betwe en differen t p athways for the allocation of the
total resources in protein. In this case, enzyme concentra-
tions within a given pathway will be positively correlated (as
in Fig. 1B), whereas the total a mount of the pathway will be
negatively correlated with total amounts o f other pathways.
The redistribution between pathways should be influenced
by environmental changes (adaptation) or by specific
induction. When a given pathway is activated by an increase
of total e nzyme amount, the flux responds by a linear
increase only if all enzymes are positively correlated. If at
least one enzyme is not correlated w ith the others, a plateau
will limit the response of the flux to activation. The existence
of operons coding for enzymes of a specific pathway (such
as amino acid biosynthesis in bacteria) makes sense in this
context.
A last, but important po int we need to discuss is the
assumption we make that enzyme concentrations are the
only genetically variable parameters. Indeed, genetic vari-
ability a lso affects the kinetic p arameters M and/or k
cat
([10,57–59] give classical examples. I ntroducing variable A
i
parameters in our models is of course possible a nd would
not modify the theoretical framework. However it is not
clear for us whether c onstraints may exist on the variations
of the A
i
’s, and, if any, how they could result in correlations
between parameters of different enzymes. In any case,
theoretical studies and experimental data suggest that
enzyme concentrations are more likely to vary than their
catalytic properties. Pettersson [60] sho wed f or example that
enzyme catalytic e fficiency has a n upper limit depending on
the diffusion r ate of the molecules in the cell. In addition,
molecular polymorphism of enzymes shows conservation
of sequences required for enzyme functionality [61], while
there is large natural polymorphism in regulatory seq-
uences [12,62,63]. In this connection, studies in quantitative
proteomics have reported high levels of genetic variability i n
protein amounts [14–19]. Therefore, variations in enzyme
concentrations are expected to be more frequent and larger
than variations in catalytic properties.
The classical metabolic control theory has been used for
addressing theoretical questions in evolutionary genetics
[64,65], and to st udy the effect of natural [51,66,67] and
artificial [68,69] selection on the flux considered as model
quantitative traits. The biologically relevant constraints on
enzyme variations we introduced in the metabolic control
theory have noticeable consequences on the behaviour of
flux and metabolites. This opens interesting questions about
the selective pressures on enzyme correlations in the
evolution of metabolic pathways. These features will be
investigated in more detail in other publications.
Acknowledgements
We are very grateful to Marı
´
aLuzCa
´
rdenas-Cerda for helpful
discussions and carefully reading the manuscript. We also want to
thank some anonym ous referees for very u seful comments. J. Fie
´
vet
was supported by a Ph.D. grant from the French Ministe
`
re de la
Jeunesse, de l’E
´
ducation nationale et de la Recherche.
Ó FEBS 2004 An extension to the metabolic control theory (Eur. J. Biochem. 271) 4385
References
1. Kacser, H. & Burns, J.A. (1973) The control of flux. Symp. Soc.
Exp. Biol. 27, 65–104.
2. He inrich, R. & Rapoport, T. (1974) A linear s teady-state treat-
ment of enzymatic chains. General properties, control and effector
strength. Eur. J. Biochem. 42, 89–95.
3. Fell, D.A. (1992) Metabolic control a nalysis: a survey of its the-
oretical and experimental background. Biochem. J. 286, 313–330.
4. Melendez-Hevia, E., Torres, N. & Sicilia, J. (1990) A general-
ization of metabolic control analysis to conditions of no pro-
portionality between activity and concentration of enzymes.
J. Theor. Biol. 142, 443–551.
5. Kacser, H., Sauro, H.M. & Acerenza, L. (1990) Enzyme–enzyme
interactions and control analysis. 1. The case of nonadditivity:
monomeroligomer asso ciations. Eur. J. Biochem. 187, 481–491.
6. Sauro, H.M. & K acser, H . (1 990) E nzyme–enzyme interactions
and control analysis. 2 . The case of nonindependence: heterolo-
gous associations. Eur. J. Biochem. 187, 493–500.
7. Acerenza, L., Sauro, H.M. & Kacser, H. (1989) Control analysis
of time-dependent me tabolic systems. J. Theor. Biol. 137, 423–444.
8. Melendez-Hevia, E., Torres, N.V., Sicilia, J . & Kacser, H. (1990)
Control analysis of transition times in metabolic systems. Biochem.
J. 265, 195–202.
9. Ho fmeyr, J H.S. & Cornish-Bowden, A. (2000) Regulating t he
cellular economy of supply a nd demand. FEBS Lett. 476, 47–51.
10. Chambers, G.K. (1988) The Drosophila alcohol dehydrogenase
gene-enzyme s ystem. Adv. Genet. 25 , 39–107.
11. Powers, D.A., Lauerman, T., Crawford, D. & DiMichele, L.
(1991) Genetic mechanisms for ad apting to a changing environ-
ment. Annu. Rev. Genet. 25, 629–659.
12. Laurie-Ahlberg, C.C. (1985) Genetic variation affecting the
expression of enzyme coding genes in Drosophila: an evolutionary
perspective. Isozymes Curr. Top. Biol. Med. Res. 12, 33–88.
13. Eanes, W.F. (1999) Analysis of selection on enzyme polymor-
phisms. Annu.Rev.Ecol.Syst.30, 301–326.
14. Klose, J. & Feller, M . (1981) Genetic variability o f proteins from
plasma membranes a nd c ytosols of mouse organs. Biochem. Genet.
19, 859–870.
15. Bahrm an, N., de Vienne, D ., Thiellement, H . & Hofmann, J.P.
(1985) Two-dimensional g el electrophoresis of prote ins for g enetic
studies i n Douglas fir (Pseudotsuga menziesii). Biochem. Genet. 23,
247–255.
16. Higginbotham, J.W., Smith, J .S. & Smith, O.S. (1991) Quantita-
tive analysis of two-dimensional protein profiles of inbred lines of
maize (Zea mays L.). Electrophoresis 12, 425–431.
17. de Vienne , D., Bost, B., F ı
´
evet, J., Zivy, M. & Dillmann, C . (2001)
Genetic variability of pro teome expression and metabolic control.
Plant Physiol. Biochem. 39, 271–283.
18. Sh aw, A.C., Gevaert, K., Demol, H., Hoorelbeke, B., Vandek-
erckhove, J ., L arsen, M.R., Roepstorff, P., Holm, A., Christian-
sen, G. & Birkelund, S. ( 2002) C omparative prote ome an alysis o f
Chlamydia trachomatis serovar A, D and L2. Proteomics 2, 164–
186.
19. Ostergaard,O.,Melchior,S.,Roepstorff,P.&Svensson,B.(2002)
Initial proteome analysis of mature barley s eeds and malt. Pro-
teomics 2, 733–739.
20. Ellis, R.J. (2001) Macromolecular crowding: obvious but under-
appreciated. Trends Biochem. Sci. 26, 597–604.
21. Atkinso n, D.E. (1969) Limitation of metabolite concentration and
the conservation o f solvent capacity in living cells. Curr. Top. Cell.
Regul. 1, 29–43.
22. Wai, S.N., Nakayama, K., Takade, A. & Amako, K. (1997)
Overproduction of Campylobacter ferritin in Escherichia coli and
induction of paracrystalline inclusion by ferrous compound.
Microbiol. Immunol. 41 , 461–467.
23. Jo nes, D.P. (1986) Intracellular diffusion gradients of O
2
and
ATP. Am. J . Physiol. 250, C663–C675.
24. Albe,K.R.,Butler,M.H.&Wright, B.E. (1990) Cellular con-
centrations of enzymes and t heir substrates. J. Theor. Biol. 143,
163–195.
25. Welle, S . & Nair, K.S. (1990) Relationship of resting metabolite
rate to body consumption an d prote in t urnover. Am.J.Physiol.
258, E990–E998.
26. Sie ms, W., Dubiel, W., Dumdey, R., M u
¨
ller, M. & Rapoport,
S.M. (1984) Accounting for the A TP-consuming processes in
rabbit reticulocytes. Eur. J. Biochem. 139, 101–107.
27. M u
¨
ller, M., Siems, W., Buttgereit, F., Dumdey, R. & Rapoport, S.M.
(1986) Quantification of AT P-producing and consuming process
of Ehrlich a scites tumour cells. Eur. J. Biochem. 161, 701–705.
28. Do ng, H., Nilsson, L. & Kurland, C.G. (1995) Gratuitous over-
expression of genes i n Escherichia col i leads to growth inhibition
and ribosome destruction. J. Bacteriol. 177, 1497–1504.
29. Ha uf , J., Zimmermann, F.K. & Mu
¨
ller, S . (2000) Simultaneous
genomic overexpression of seven glycolysis enzymes in the yeast
Saccharomyces cerevisiae. Enzyme Microb. Technol. 26, 688–698.
30. Ka cser, H. & Beeby, R. (1984) Evolution o f c atalytic proteins: on
the origin of enzyme species by means of natural selection. J. Mol.
Evol. 20, 38–51.
31. Ko ehn, R.K. (1991) The cost of enzyme synthesis in the genetics of
energy balance and physiological performance. Biol. J. L innean
Soc. Lond. 44, 231–247.
32. Akashi, H. & Gojobori, T. (2002) Metabolic efficiency and amino
acid composition in the proteomes of Esche richia coli and Bacillus
subtilis. Proc. Natl Acad. Sci. USA 99, 3695–3700.
33. Ko ch, A .L. (1983) The protein burden of lac operon products.
J. Mol. Ev ol. 19, 455–462.
34. Vind , J., Sørensen, M.A., Rasmussen, M.D. & Pedersen, S. (1993)
Synthesis of prote ins on Eescherichia coli is limited by the
concentration of free ribosomes. E xpression from reporter genes
does not a lways reflect functional mRNA le vels. J. Mol. Biol. 231,
678–688.
35. Sn oep, J.L., Yomano, L.P., Westerhoff, H.V. & Ingram, L.O.
(1995) Protein burden in Zymomonas mo bilis: negative flux and
growth control due to overproduction of glycolytic en zymes.
Microbiology 141, 2329–2337.
36. Laub, M.T. & McAdams, H.H. (2000) Global analysis of the
genetic network controlling a bacterial cell cycle. Science 290,
2144–2148.
37. Jacob, J. & Monod, J. (1961) Genetic regulatory mechanisms in
the synthesis of proteins. J. Mol. Biol. 3, 318–356.
38. Stephanopoulos, G. & Vallino, J.J. (1991) Network rigidity and
metabolic engineering in metabolite overproduction. Science 252,
1675–1681.
39. Thieffry, D. & Huerta, A.M. (1998) From specific gene regulation
to genomic n etworks: a g lobal analysis o f t ranscriptional regula-
tion in E. coli. Bioessays 20, 433–440.
40. Jeong, H. & Tombor, B. (2000) The large-scale organization of
metabolic networks. Nature 407, 651–654.
41. Ideker, H . & Thorsson, V. (2001) Integrated genomics and pro-
teomic analyses of a systematically perturbed metabolic network.
Science 292, 929–934.
42. Prat i, E.G., Matasci., M., Suter, T.B., Dinter, A ., Sburlati, A.R. &
Bailey, J.E. (2002) Engineering of coordinated up- and down-
regulation of two g lycosyltransferases of the O-glycosylation
pathway in ch inese hamste r ovary (CH O) c ells. Biotechnol. Bioeng.
79, 580–585.
43. Even , S ., Lindley, N.D. & Cocaign-Bousquet, M. (2 001) M ole-
cular physiology of s ugar catabolism in Lactococcus lactis IL1403.
J. Bacteriol. 183, 3817–3824.
44. Fell, D.A. (1997) Understanding the Control of Metabolism.
Portland Press, London.
4386 S. Lion et al.(Eur. J. Biochem. 271) Ó FEBS 2004
45. Hofmeyr, H.S. & Cornish-Bowden, A. (1991) Q uantitative
assessment of regulation in metabolic systems. Eur . J. Biochem.
200, 223–236.
46. de Vienne, D., Bost, B., Fı
´
evet, J. & Dillmann, C. (2001) Opti-
misation of enzyme concentrations for unbranched reaction
chains: the concept of combined respo nse coeffi cient. Acta.
Biotheor. 49, 341–350.
47. He inrich, R., Schuster, S. & Holzhu
¨
tter, H G. (1991) Mathema-
tical a nalysis of enzymic reaction systems using optimization
principles. Eur. J. Biochem. 201, 1–21.
48. Klipp, E. & Heinrich, R. (1999) Competition for enzymes in
metabolic pathways: implications for optimal distri butions of
enzyme conce ntrations and f or the distribution of flux control.
Biosystems 54, 1–14.
49. Ebenho
¨
h, O. & Heinrich, R. (2000) Evolutionary optimization of
metabolism. Bull. Math. Biol. 63, 21–56.
50. Heinrich, R. & Schuster, S. ( 1998) The modelling of metabolic
systems. Structure, control and optimality. Biosystems 47, 61–67.
51. Hartl, D.L., Dykhuizen, D.E. & Dean, A.M. (1985) Limits of
adaptation: the ev olution of s elective n eutrality. Genetics 111,655–
674.
52. An , H., Scopes, R.K., Rodrigue z, M., Keshav, K.F. & Ingram,
L.O. (1991) Gel electrophoresis analysis of Zymomonas mobilis
glycolytic and fermentative enzymes: identification of alcohol de-
shydrogenase II as a stress protein. J. Bacteriol. 173, 7227–7240.
53. Parsch, J., Russell, J.A., Beerman, I., Hartl, D. L. & Stephan, W.
(2000) Deletion of a conserved regulatory element in the Droso-
phila Adh ge ne leads to inc rease d alcohol dehydrogenase activity
but also delays development. Genetics 15 6 , 219–227.
54. Kahn , D. & Westerhoff, H.V. (1991) Control theory of regulatory
cascades. J. Theor. Biol. 153, 255–285.
55. Hofmeyr, J.H.S. & Westerhoff, H .V. (2001) Building the cellular
puzzle – control in multi-level reaction networks. J. Theor. Biol.
208, 261–285.
56. Solem, C. & Jensen, R. (2002) Modulation of gene expression
made easy. Appl. Environ. Microbiol. 68, 2397–2404.
57. de Vienne, D. & Rodolphe, F. (1985) Bioc hemical and ge netic
properties of oligomeric structures: a general approach. J. Theor.
Biol. 116, 527–568.
58. Eanes, W.F., Katona, L. & Longtime, M. (1990) Comparison of
in vitro and in vivo activities associated with the G6PD allozyme
polymorphism in Drosophila melanogaster. Genetics 125 , 845–853.
59. Wang, I.N. & Dykhuizen, D .E. (2001 ) V ariation of enzyme
activities at a branched pathway involved in the utilization of
gluconate in Escherichia coli. Evolution 55, 897–908.
60. Pettersson, G. (1989) Effect of evolution on the kinetic prope rties
of enzymes. Eur. J. Biochem. 184, 561–566.
61. Tarun, A.S., Lee, J.S. & Theologis, A. (1998) Random muta-
genesis of 1-aminocyclopropane-1-carboxylate synthase: a key
enzyme in ethylene biosynthesis. Proc. Natl Acad. Sci. USA 95,
9796–9801.
62. Hanson, M.A., Gaut, B.S., St ec, A.O., Fuerstenberg, S .I.,
Goodman, M.M., Coe, E.H. & Doebley, J.F. (1996) Evolution of
anthocyanin biosynthesis in maize kernels: the role of regulatory
and enzymatic loci. Genetics 143, 1395–1407.
63. Wang, R.L., Stec, A., Hey, J., Lukens, L. & Doebley, J.F. (1999)
The limits o f selection d uring maize domestication. Nature 398,
236–239.
64. Clark, A.G. (1991) M utation-selection balance a nd metabolic
control theory. Genetics 129 , 909–923.
65. H astings, A. (1992) The population genetics of alleles affecting
enzyme activity. J. Theor. Biol. 157, 305–316.
66. Dy khuizen, D.E., D ean, A.M. & Hartl, D.L. (1987) Metabolic
flux and fitness. Genetics 115, 25–31.
67. Beaumont, M.A. ( 1988) Stabilizing selection and metabolism.
Heredity 61, 433–438.
68. Ward, P.J. (1990) The inheritance of metabolic flux – expressions
for t he within-sibship mean and variance given the parental gen-
otypes. Genetics 125, 655–667.
69. Ke ightley, P.D. (1996) Metabolic models of selection response.
J.Theor. Biol. 182, 311–316.
Appendix A
Decomposition of redistribution coefficients
Let us consider that the initial enzyme concentrations are
E
1
, …, E
j
, …, E
n
with
P
n
j¼1
E
j
¼ E
tot
. V ariation of the
concentration of enzyme E
k
from E
k
to E
00
k
drives the
system to a new state E
00
1
; :::; E
00
j
; :::; E
00
n
, d ue to redistribution
between enzymes. In a first step, we consider that the
variations of concentrations are only due to coregulations.
Therefore E
00
j
¼ E
tot
þ E,whereE can be positive or
negative. As defined in Eqn 6 we have
b
kj
¼
E
00
j
À E
j
E
00
k
À E
k
and
X
n
j¼1
b
kj
¼ B
k
¼
E
E
00
k
À E
k
Introducing proportional redistribution in the system,
due to competition, affects all t he concentrations and
drives the s ystem t o the final state E
0
1
; :::; E
0
j
; :::; E
0
n
with
the constraint
P
n
j¼1
E
0
j
¼ E
tot
, as a consequence of
competition-regulation driven redistribution. Following
Eqn 1 , we have
a
kj
¼
E
0
j
À E
j
E
0
k
À E
k
or, using normalized concentrations,
a
kj
¼
e
0
j
À e
j
e
0
k
À e
k
Due to proportional redistribution, the relationship
between E
00
j
and E
0
j
is
E
00
j
E
tot
þ E
¼
E
0
j
E
tot
or
e
00
j
¼ e
0
j
Therefore, and
e
0
k
À e
k
¼
E
00
k
E
tot
þ E
À
E
k
E
tot
As we have
E
00
j
¼ E
j
þ b
kj
E
00
k
À E
k
summing for j ¼ 1ton,weget
E
tot
þ E ¼ E
tot
þ B
k
E
00
k
À E
k
After some rearrangements, we get
Ó FEBS 2004 An extension to the metabolic control theory (Eur. J. Biochem. 271) 4387
a
kj
¼
b
kj
À e
j
B
k
1 Àe
k
B
k
With only competition in the system, we have "j „ k,
b
kj
¼ 0andB
k
¼ b
kk
¼ 1, and thus we come back to the
relationship
a
kj
¼À
e
j
1 Àe
k
¼Àc
kj
With only coregulation in the system, 8j; E
0
j
¼ E
00
j
and
thus we have a correspondance b etween the redistribution
and coregulation coefficients:
a
kj
¼
E
00
j
À E
j
E
00
k
À E
k
¼ b
kj
Appendix B
Asymptotic behaviour of flux curves in pure regulatory
models
Let us consider a pure r egulatory model, i.e. a model w here
variation of the concentration of enzyme k from 0 to E
k
causes the enzyme to vary from E
j0
(concentration when
E
k
¼ 0) to E
j
with a coefficient b
kj
:
8j 6¼ kE
j
¼ E
j0
þ b
kj
E
k
X
n
j¼1
E
j
¼ E
tot
We have
J ¼
X
P
n
j¼1
1
A
j
E
j
¼
XA
k
E
k
P
j6¼k
A
k
A
j
b
kj
þ
E
j0
E
k
þ 1
Let u s further assume that all coefficients b
kj
are strictly
positive. Taking the limit of the precedent expression, we get:
lim
E
k
!1
J ¼þ1
It is easy to calculate that J asymptotically tends towards
a straight line aE
k
+ b where:
a ¼
XA
k
1 þ
P
j6¼k
A
k
A
j
b
kj
b ¼ XA
k
P
j6¼k
A
j
E
j0
A
j
b
2
kj
1 þ
P
j6¼k
A
k
A
j
b
kj
!
2
Let us assume that p enzymes are independent. We note
i 2 I
p
if b
ki
¼ 0. We can write J as follows:
J ¼
XA
k
1
E
k
P
j=2I
p
j6¼k
A
k
A
j
b
kj
þ
E
j0
E
k
0
B
@
1
C
A
þ
P
j2I
p
A
k
A
j
E
j0
þ
1
E
k
Taking the limit of this expression when E
k
fi 1,wesee
that the flux reaches a plateau as soon as at least o ne enzy me
is independent. The value J
ðpÞ
max
of the p lateau when p
enzymes are independent is given by:
J
ðpÞ
max
¼
X
P
j2I
p
1
A
j
E
j0
It is clear that J
ðpÞ
max
gets smaller w hen p increases and that
J
ðnÀ1Þ
max
corresponds to the maximum value of the flux found
by Kacser & Burns [1]. We have:
J
ðnÀ1Þ
max
¼
X
P
j6¼k
1
A
j
E
j0
If we now assume that at least one coefficient b
k‘
is
negative, it is clear that there exists a value of E
k
where
E
‘
¼ 0. This value is E
max
) E
‘0
/b
k‘
. Therefore, we want
to calculate the limit of J when E
k
fi E
max
.Itiseasyto
see that t his limit is zero. This means that one negative
correlation is enough for the flux curve to reach a
maximum.
Appendix C
Asymptotic behaviour of metabolite concentration
curves
We still consider a pure regulatory model (Appendix B),
with p independent enzymes. The coregulation coeffi-
cients are first assumed to be positive. We note i 2 P
p
(resp. i 2 D
p
)ifb
ki
¼ 0andk £ i (resp. b
ki
¼ 0and
k > i). We can write the concentration of metabolite
i ‡ k as follows:
S
i
K
0;i
¼
1
E
k
þ IndðE
k
ÞþCorrðE
k
Þ
1
E
k
þ
P
j=2P
p
[D
p
A
k
=
A
j
E
j0
þb
kj
E
k
þ
P
j2P
p[D
p
A
k
A
j
E
j0
where
IndðE
k
Þ¼X
0
X
j2D
p
A
k
A
j
E
j0
þ
X
n
K
0;n
X
j2P
p
j6¼k
A
k
A
j
E
j0
and
CorrðE
k
Þ¼X
0
X
j=2D
p
A
k
A
j
E
j0
þ b
kj
E
k
þ
X
n
K
0;n
X
j=2P
p
j6¼k
A
k
A
j
E
j0
þ b
kj
E
k
Taking the limit of the expression of S
i
when E
k
fi 1,
we see that the metabolite concentration reaches a plateau
as soon as at least one enzyme is independent of the others.
The value S
ðpÞ
i
of the plateau when p enzymes are
independent is given by:
S
ðpÞ
i
¼ K
0;i
X
0
P
j2D
p
1
A
j
E
j0
þ
X
n
K
0;n
P
j2P
p
j6¼k
1
A
j
E
j0
P
j2P
p[D
p
1
A
j
E
j0
It is clear that S
ðnÀ1Þ
i
corresponds to the level of the
plateau found by Kacser & Burns [1]. In the case where
k > i,wehave:
4388 S. Lion et al.(Eur. J. Biochem. 271) Ó FEBS 2004
S
ðpÞ
i
¼ K
0;i
X
0
P
j2D
p
j6¼k
1
A
j
E
j0
þ
X
n
K
0;n
P
j2P
p
1
A
j
E
j0
P
j2P
p[D
p
1
A
j
E
j0
If we suppose that all enzymes are linked b y positive
correlations (p ¼ 0), the limits for S
i
are given by:
S
ð0Þ
i
K
0;i
¼
1 þX
0
P
j>i
1
A
j
b
kj
þ
X
n
K
0;n
P
j i
j6¼k
1
A
j
b
kj
1 þ
P
j6¼k
1
A
j
b
kj
if k i
S
ð0Þ
i
K
0;i
¼
1 þX
0
P
j>i
j6¼k
1
A
j
b
kj
þ
X
n
K
0;n
P
j i
1
A
j
b
kj
1 þ
P
j6¼k
1
A
j
b
kj
if k>i
If we now assume that at least one coefficient b
k‘
is
negative, it is clear that there exists a value of E
k
where
E
‘
¼ 0. This value is E
max
) E
‘0
/b
k‘
. Therefore, we want
to calculate the limit of when E
k
fi E
max
.Letuswrite
S
i
(‘ £ i) as follows:
S
ð0Þ
i
K
0;i
¼
E
‘
X
0
P
j>i
1
A
j
E
j0
þ
X
n
K
0;n
P
j i
j6¼k
1
A
j
E
j0
0
B
@
1
C
A
þ
X
n
A
‘
K
0;n
E
‘
P
j6¼k
1
A
j
E
j
þ
1
A
‘
Taking the limit, we get:
lim
E
k
!E
max
S
i
¼ K
0;i
X
n
K
0;n
when ‘ i
A similar calculus leads to:
lim
E
k
!E
max
S
i
¼ K
0;i
X
0
when ‘>i
We see that the values of S
i
when one enzyme concen-
tration is null can be K
0,i
X
0
or K
0,i
X
n
/K
0,n
depending on the
position of the enzyme with respect to the metabolite. In
particular, this consideration allows us to derive the value of
S
i
when E
k
¼ 0.
If we now consider a pure competitive linear path way, we
have:
À
e
j
1 Àe
k
¼ a
kj
and
X
n
j¼1
e
j
¼ 1
We can write the metabolite c oncentration as f ollows, if
we assume ‘ £ i:
S
i
K
0;i
¼
X
0
P
j>i
1
A
j
a
kj
þ
X
n
K
0;n
P
j i
j6¼k
1
A
j
a
kj
þ
1Àe
k
A
k
e
k
X
n
K
0;n
P
j6¼k
1
A
j
a
kj
þ
1Àe
k
A
k
e
k
Taking the limit of this expression when e
k
fi 1, we
see that the S
i
reaches a plateau. The value of the
plateau i s:
S
lim
i
¼ K
0;i
X
0
P
j>i
1
A
j
a
kj
þ
X
n
K
0;n
P
j i
j6¼k
1
A
j
a
kj
P
j6¼k
1
A
j
a
kj
Finally,wehavefork > i:
S
lim
i
¼ K
0;i
X
0
P
j>i
j6¼k
1
A
j
a
kj
þ
X
n
K
0;n
P
j i
1
A
j
a
kj
P
j6¼k
1
A
j
a
kj
By definition, we have:
a
kj
¼À
e
j0
1 Àe
k0
¼Àe
j0
because e
k0
¼ 1
Replacing a
kj
by this value in the expressions of S
lim
i
,we
see that the levels of the plateaus are given by:
S
lim
i
K
0;i
¼
X
0
P
j>i
1
A
j
E
j0
þ
X
n
K
0;n
P
j i
j6¼k
1
A
j
E
j0
P
j6¼k
1
A
j
E
j0
if k i
S
lim
i
K
0;i
¼
X
0
P
j>i
j6¼k
1
A
j
E
j0
þ
X
n
K
0;n
P
j i
1
A
j
E
j0
P
j6¼k
1
A
j
E
j0
if k>i
Note that the values f or the plateau s are different from
those i n the unconstr ained p athway, because the values of
the E
j0
are different in both cases.
Appendix D
Relationship between redistribution and flux combined
response coefficients
Competitive-regulatory pathways. Analytical expression
of the flux reads:
J ¼
XE
tot
P
n
j¼1
1
A
j
e
j
Using the fact that :
@e
j
@e
k
¼ a
kj
we get:
@J
@e
k
¼ XE
tot
P
n
j¼1
a
kj
A
j
e
2
j
P
n
j¼1
1
A
j
e
j
!
2
Multiplying this expression by e
k
/J,wegetaftersome
rearrangement:
Ó FEBS 2004 An extension to the metabolic control theory (Eur. J. Biochem. 271) 4389
R
J
e
k
¼
J
XE
tot
e
k
X
n
j¼1
a
kj
A
j
e
2
j
We can now derive the right and left limits of the flux
combined response coefficient. First, let us observe
that these limits a re reached when the concentration o f
aparticularenzymeE
‘
becomes zero. We have therefore:
R
J
e
k
¼
e
k
e
‘
e
2
‘
P
j6¼‘
a
kj
A
j
e
2
j
þ
a
k‘
A
‘
e
‘
P
j6¼‘
1
A
j
e
j
þ
1
A
‘
The limit of the second fraction when e
‘
becomes zero is
a
kj
because the sums are finite. Therefore, we have:
R
J
e
k
/
e
k
e
‘
a
k‘
For a nonpure competitive model, the limit on the
right i s unchanged (–1) but the limit on the left is
generally not 1. Indeed, we have k „ ‘ and a
k‘
>0, so the
limit is +1.
Pure competitive pathways. Replacing a
kj
by its expres-
sion in Eqn 12, we have:
R
J
e
k
¼ e
k
J
XE
tot
1
A
k
e
2
k
À
X
j6¼k
1
A
j
e
2
j
e
j
1 Àe
k
!
This reads:
R
J
e
k
¼ e
k
J
XE
tot
1
A
k
e
2
k
À
1
1 Àe
k
X
j6¼k
1
A
j
e
j
!
¼ e
k
J
XE
tot
1
A
k
e
2
k
À
1
1 Àe
k
XE
tot
J
À
1
A
k
e
k
¼ e
k
J
XE
tot
1
A
k
e
2
k
À
XE
tot
Jð1 Àe
k
Þ
þ
1
A
k
e
k
ð1 Àe
k
Þ
¼ e
k
J
XE
tot
1
A
k
e
2
k
ð1 Àe
k
Þ
À
1
1 Àe
k
XE
tot
J
Finally we get:
R
J
e
j
¼
e
k
1 Àe
k
J
XE
tot
1
A
k
e
2
k
À 1
For the other enzymes j „ k, the redistribution coeffi-
cients are:
i 6¼ k a
ij
¼
e
j
e
i
a
jk
¼À
1 Àe
k
e
j
Replacing t hese values in the expression of combined
response coefficient leads to:
R
J
e
j
¼ 1 À
J
XE
tot
1
A
k
e
2
k
In this case, lim
e
k
!0
R
J
e
k
¼ 1, whereas lim
e
k
!1
R
J
e
k
¼À1
Appendix E
Characterization of flux envelope curve
Heinrich et al. [47,50] h ave used optimization principles to
study the evolution of metabolic systems. For instance,
they showed that under the constraint of Eqn 4, flux
has an optimal value on the range [0, E
tot
]. This value is
reached f or a unique vector of concentrations (e
Ã
1
; :::; e
Ã
n
)
defined as [47]:
e
Ã
j
¼
1
ffiffiffiffi
A
j
p
P
n
k¼1
1
ffiffiffiffi
A
k
p
Let us now consider that the value of e
k
is fixed (e
k
¼ e).
We define for each value of e a n ew constraint that reads:
X
j6¼k
e
j
¼ 1 À e
Using the method of Lagrange multipliers, we calculate
the maximal value of the flux when e
k
¼ e, under the new
constraint. T he optimal vector of concentrations e° is
solution of the following set of equations:
8j 6¼ k
@
@e
j
J Àk
X
j6¼k
e
j
À 1 þ e
! !
¼ 0
This can be simplified as:
8j 6¼ k
@J
@e
j
¼ k
Using the expression of J,weget:
8j 6¼ k
J
2
XE
tot
1
A
j
e
j
2
¼ k
Taking two arbitrary indices i and j and dividing the two
equations, we obtain:
8i; j 6¼ k
e
j
e
i
¼
ffiffiffiffiffi
A
i
A
j
s
Therefore, we have:
8i 6¼ k
X
j6¼k
e
j
¼
ffiffiffiffiffiffiffiffiffi
A
i
e
i
p
X
j6¼k
1
ffiffiffiffiffi
A
j
p
¼ 1 À e
We deduce the expression of the vector e
:
8i 6¼ ke
i
¼ð1 À eÞ
1
ffiffiffiffiffi
A
i
p
P
j6¼k
1
ffiffiffiffi
A
j
p
¼ e
i
ðeÞ
e
k
¼ e ¼ e
k
ðeÞ
We define the function J° as J°(e) ¼ J(e°(e)). J° is clearly
an envelope function. Moreover, we can easily show that:
8i 6¼ k
@e
i
@e
¼À
1
ffiffiffiffiffi
A
i
p
P
j6¼k
1
ffiffiffiffi
A
j
p
¼À
e
Ã
i
1 Àe
Ã
k
4390 S. Lion et al.(Eur. J. Biochem. 271) Ó FEBS 2004
@e
k
@e
¼ 1
where e
Ã
k
is the optimal value o f e
i
found by Heinrich et al.
[47]. Therefore, J° is a pure competitive flux curve, defined
by a particular set of redistribution of coefficients:
j 6¼ k a
kj
¼À
e
Ã
j
1 Àe
Ã
k
Appendix F
Relationship between redistribution and metabolite
concentration combined response coefficients
Competitive-regulatory pathways. The concentration of
metabolite S
i
is
S
i
¼
J
XE
tot
K
0;i
X
0
X
j>i
1
A
j
e
j
þ
X
n
K
0;n
X
j i
1
A
j
e
j
!
Using the fact that
@
P
j i
1
A
j
e
j
!
@e
k
¼À
X
j i
a
kj
A
j
e
2
j
we get:
@S
i
@e
k
¼
K
0;i
XE
tot
@J
@e
k
X
0
X
j>i
1
A
j
e
j
þ
X
n
K
0;n
X
j i
1
A
j
e
j
!"
À JX
0
X
j>i
a
kj
A
j
e
2
j
þ
X
n
K
0;n
X
j i
a
kj
A
j
e
2
j
!#
and
@J
@e
k
¼
J
2
XE
tot
X
n
j¼1
a
kj
A
j
e
2
j
Therefore, we have:
@S
i
@e
k
¼
J
2
K
0;i
X
2
E
2
tot
X
0
P
j>i
1
A
j
e
j
þ
X
n
K
0;n
P
j i
1
A
j
e
j
!
P
n
j¼1
a
kj
A
j
e
2
j
À X
0
P
j>i
a
kj
A
j
e
2
j
þ
X
n
K
0;n
P
j i
a
kj
A
j
e
2
j
!
P
n
j¼1
1
A
j
e
j
2
6
6
6
6
6
4
3
7
7
7
7
7
5
Finally, after some rearrangement we get:
@S
i
@e
k
¼
J
2
K
0;i
XE
2
tot
X
j i
a
kj
A
j
e
2
j
X
j>i
1
A
j
e
j
À
X
j>i
a
kj
A
j
e
2
j
X
j i
1
A
j
e
j
!
Pure competitive pathways. As in appendix D, we replace
a
kj
by its expression in Eqn 14. We have, if k £ i:
X
j i
a
kj
A
j
e
2
j
X
j>i
1
A
j
e
j
À
X
j>i
a
kj
A
j
e
2
j
X
j i
1
A
j
e
j
¼
1
A
k
e
2
k
À
X
j i
j6¼k
1
A
j
e
j
1
1 Àe
k
0
B
@
1
C
A
X
j>i
1
A
j
e
j
þ
X
j>i
e
j
A
j
e
2
j
1
1 Àe
k
X
j i
1
A
j
e
j
¼
X
j>i
1
A
j
e
j
1
A
k
e
2
k
À
1
1 Àe
k
X
j i
j6¼k
1
A
j
e
j
À
X
j i
1
A
j
e
j
0
B
@
1
C
A
2
6
4
3
7
5
¼
X
j>i
1
A
j
e
j
1
A
k
e
2
k
1 þ
e
k
1 Àe
k
Finally, we get for m etabolites S
i
that are downstream of
enzyme E
k
:
k i R
S
i
e
k
¼
J
2
XE
2
tot
K
0;i
S
i
X
j>i
1
A
j
e
j
!
1
A
k
e
k
1
1 Àe
k
Similarly, we have for metabolites S
i
that are upstream of
enzyme E
k
:
k>i R
S
i
e
k
¼À
J
2
XE
2
tot
K
0;i
S
i
X
j i
1
A
j
e
j
!
1
A
k
e
k
1
1 Àe
k
:
Ó FEBS 2004 An extension to the metabolic control theory (Eur. J. Biochem. 271) 4391