Báo cáo khoa học: Protein expressed by the ho2 gene of the cyanobacterium Synechocystis sp. PCC 6803 is a true heme oxygenase pot
Bạn đang xem bản rút gọn của tài liệu. Xem và tải ngay bản đầy đủ của tài liệu tại đây (381.36 KB, 11 trang )
Protein expressed by the ho2 gene of the cyanobacterium
Synechocystis sp. PCC 6803 is a true heme oxygenase
Properties of the heme and enzyme complex
Xuhong Zhang
1
, Catharina T. Migita
2
, Michihiko Sato
3
, Masanao Sasahara
1
and Tadashi Yoshida
1
1 Department of Biochemistry, Yamagata University School of Medicine, Japan
2 Department of Biological Chemistry, Faculty of Agriculture, Yamaguchi University, Japan
3 Central Laboratory for Research and Education, Yamagata University School of Medicine, Japan
Heme oxygenase (HO) was first reported in mamma-
lian systems as a microsomal enzyme [1], in which the
hydrophobic 26 amino acid residues at the C-terminus
anchor the protein to the membrane [2,3]. HO cata-
lyzes the regiospecific oxidative degradation of heme
to biliverdin IX
a
, iron, and CO via a-meso-hydroxy-
hemin, verdoheme, and the iron(III)–biliverdin IX
a
complex at the expense of three molecules of oxygen
and seven electrons (Scheme 1) [4,5]. The electrons are
supplied from NADPH through microsomal NADPH-
cytochrome P450 reductase (CPR). Two isozymes of
HO, denoted as HO-1 and HO-2, have been identified
in mammalian systems [6]. In general, HO-1 is respon-
sible for the excretion of aged ⁄ disused heme as well as
recycling of iron [7,8] and HO-2 is associated with sig-
nal transduction through the production of CO, where
Keywords
biliverdin; cyanobacterium heme oxygenase;
EPR; ferredoxin; heme oxygenase
Correspondence
T. Yoshida, Department of Biochemistry,
Yamagata University School of Medicine,
Iida-nishi 2-2-2, Yamagata 990-9585, Japan
Fax: +81 23 6285225
Tel: +81 23 6285222
E-mail:
(Received 25 August 2004, revised 10
December 2004, accepted 17 December
2004)
doi:10.1111/j.1742-4658.2004.04535.x
Two isoforms of a heme oxygenase gene, ho1 and ho2, with 51% identity
in amino acid sequence have been identified in the cyanobacterium
Synechocystis sp. PCC 6803. Isoform-1, Syn HO-1, has been characterized,
while isoform-2, Syn HO-2, has not. In this study, a full-length ho2 gene
was cloned using synthetic DNA and Syn HO-2 was demonstrated to be
highly expressed in Escherichia coli as a soluble, catalytically active protein.
Like Syn HO-1, the purified Syn HO-2 bound hemin stoichiometrically to
form a heme–enzyme complex and degraded heme to biliverdin IX
a
,CO
and iron in the presence of reducing systems such as NADPH ⁄ ferredoxin
reductase ⁄ ferredoxin and sodium ascorbate. The activity of Syn HO-2 was
found to be comparable to that of Syn HO-1 by measuring the amount of
bilirubin formed. In the reaction with hydrogen peroxide, Syn HO-2 con-
verted heme to verdoheme. This shows that during the conversion of hemin
to a-meso-hydroxyhemin, hydroperoxo species is the activated oxygen spe-
cies as in other heme oxygenase reactions. The absorption spectrum of the
hemin–Syn HO-2 complex at neutral pH showed a Soret band at 412 nm
and two peaks at 540 nm and 575 nm, features observed in the hemin-Syn
HO-1 complex at alkaline pH, suggesting that the major species of iron(III)
heme iron at neutral pH is a hexa-coordinate low spin species. Electron
paramagnetic resonance (EPR) revealed that the iron(III) complex was in
dynamic equilibrium between low spin and high spin states, which might be
caused by the hydrogen bonding interaction between the distal water ligand
and distal helix components. These observations suggest that the structure
of the heme pocket of the Syn HO-2 is different from that of Syn HO-1.
Abbreviations
CPR, cytochrome P450 reductase; HO, heme oxygenase; Fd, ferredoxin; FNR, ferredoxin reductase; KPB, potassium phosphate buffer;
rHO-1, heme oxygenase-1 of Rattus norvegicus; Syn HO-1, heme oxygenase-1 of Synechocistis sp. PCC 6803; Syn HO-2, heme oxygenase-2
of Synechocystis sp. PCC 6803; EPR, electron paramagnetic resonance.
1012 FEBS Journal 272 (2005) 1012–1022 ª 2005 FEBS
CO stimulates the formation of cGMP as a possible
physiological messenger akin to NO [9]. Additionally,
HO plays an important role in the defense against oxi-
dative stress, as lipophilic bilirubin IX
a
, the reduced
form of biliverdin IX
a
, works as a potent endogenous
antioxidant similar to vitamin E [10,11].
HO is also found in some pathogenic bacteria,
where it is essential for the heme-based iron acquisition
needed to survive and produce proteinaceous poisons
[12–14]. In contrast to mammalian HO, bacterial HO
is soluble owing to the lack of a C-terminal hydropho-
bic region. The reaction mechanisms of bacterial HOs
are essentially similar to those of mammalian HOs.
Prokaryotic plant heme oxygenase activity was first
found in a red alga, Cyanidium caldarium, and then in
cyanobacteria, Synechocystis sp. PCC 6701 and PCC
6803, which have now been studied for 20 years [15–
20]. The HO of cyanobacteria and prokaryotic red
algae is responsible for the biosynthesis of photorecep-
tive bilins such as phycocyanobilin and phycoerythro-
bilin, as these bilins are synthesized from biliverdin
IX
a
, a product of the HO reaction [15]. Phytochromo-
bilin, one of the photo-sensing bilins required for the
photomorphogenesis of higher plants, is also consid-
ered to come from biliverdin IX
a
[15,21–23]. Like bac-
terial HOs, the plant HOs are soluble and supposed to
need ferredoxin (Fd) as an electron donor. In 1996,
the entire genome sequence of Synechocystis sp. PCC
6803 was published and two different HO genes, ho1
and ho2, were identified [24]. Next, the molecular clo-
ning of the HY1 gene of Arabidopsis was performed
and the product of this gene expressed in Escherichia
coli showed heme oxygenase activity [25]. More recent
success in decoding the genomes of plants such as
tomato, soybean and pea also suggests the presence of
HOs in these higher plants [26]. Cornejo et al. first
reported a bacterial expression and purification system
for a protein (HO-1) encoded by the ho1 gene [27] and
we also established an efficient E. coli expression sys-
tem to obtain highly purified protein (Syn HO-1) [28].
This success has allowed for molecular-based studies
on Syn HO-1 [28,29].
Bacterial expression of the ho2 gene of Synechocystis
sp. PCC 6803 was also carried out by Cornejo et al.
and yielded a small amount of soluble fraction which
did not show heme oxygenase activity [27]. Neverthe-
less, the expected product of the ho2 gene, Syn HO-2,
is highly homologous in amino acid sequence to Syn
HO-1 (51%) and most of the residues critical for heme
oxygenase activity in mammalian HO-1 are conserved
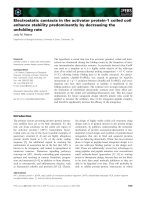
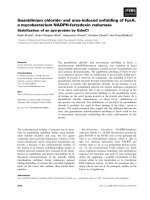
[30–34] (Fig. 1), so that Syn HO-2 is strongly sugges-
ted to be an active enzyme. To obtain the active form
of Syn HO-2 and clarify the enzymatic properties of
this protein, we have constructed a bacterial expression
system for the ho2 gene and successfully obtained puri-
fied Syn HO-2 protein. Accordingly, it has been estab-
lished that Syn HO-2 binds hemin stoichiometrically
and converts it into biliverdin IX
a
, CO and iron in the
presence of oxygen and electrons, demonstrating that
Syn HO-2 is a true heme oxygenase. This is the first
report of the characterization of the cyanobacterial
HO-2 protein and its heme complex.
Results and Discussion
Expression and purification of Syn HO-2
Culturing the cells at two temperatures, first at 37 °C
and then at 20 °C, we could avoid the accumulation of
inclusion bodies of Syn HO-2. The harvested cells were
pale green, indicative of the expression of a catalyti-
cally active Syn HO-2. We purified the Syn HO-2 from
the soluble fraction by ammonium sulfate fractionation
and subsequent column chromatography on Sephadex
G-75, DE-52, and hydroxyapatite. The final prepar-
ation after chromatography on a hydroxyapatite col-
umn was clear and colorless and gave a single band of
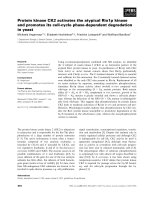
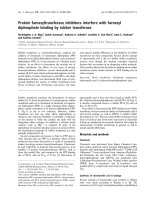
29 kDa with about 97% purity on SDS ⁄ PAGE
(Fig. 2), the size expected from the deduced Syn HO-2
amino acid sequence (28.5 kDa). About 10 mg of pro-
tein was obtained from 1 L of culture.
Catalytic activity of Syn HO-2
First we measured the catalytic activities of Syn HO-2
and compared them with those of Syn HO-1. We used
ferredoxin reductase (FNR) ⁄ Fd equivalent to seven-
tenths of Syn HO-2 or sodium ascorbate as reducing
reagents. We added desferrioxamine and biliverdin
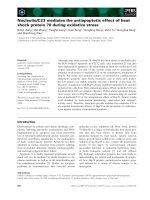
Scheme 1. Heme degradation pathway. Conversion of heme to bili-
verdin IXa catalyzed by HO.
X. Zhang et al. Cyanobacterium heme oxygenase-2
FEBS Journal 272 (2005) 1012–1022 ª 2005 FEBS 1013
reductase to the reaction mixture to facilitate the
release of iron and biliverdin from the enzyme and to
reduce the biliverdin to bilirubin, respectively. Table 1
indicates that Syn HO-2 is enzymatically active. The
specific activity for heme breakdown was comparable
to that of Syn HO-1 in the presence of each of the
reducing systems, although the ascorbate-supported
activity of Syn HO-2 was stronger than that of Syn
HO-1. The activity levels of both enzymes supported
by NADPH⁄ FNR⁄Fd were higher than those with
ascorbate. NADPH ⁄ CPR supported activities of both
HOs were considerably low. Our recent study on Syn
HO-1 crystals indicated that the positively charged sur-
face interacting with an electron donor was narrower
than that of mammalian HO-1 [29]. Then, the elec-
trons from CPR might not be transferred efficiently to
Syn HO-1 or Syn HO-2.
Properties of the heme-Syn HO-2 complex
All HOs studied to date bind heme stoichiometrically
to form a substrate–enzyme complex. Like other
HOs, Syn HO-2 also binds hemin, with a dissociation
constant of about 8.87 ± 2.1 lm to form a 1 : 1 stoi-
chiometric complex (Fig. 3, inset). The complex was
stable and purified as described in Experimental pro-
cedures.
Fig. 1. Amino acid sequence of Syn HO-2 as compared with the sequences of Syn HO-1, rHO-1 and rHO-2. The shaded letters indicate resi-
dues with sequence identity.
Fig. 2. SDS ⁄ PAGE of the purified Syn HO-2 protein. Lane 1,
molecular mass marker; lane 2, 10 lg of purified protein.
Cyanobacterium heme oxygenase-2 X. Zhang et al.
1014 FEBS Journal 272 (2005) 1012–1022 ª 2005 FEBS
Absorption spectra of the complexes of heme and
HOs resemble the spectrum of myoglobin with one
exception, the HO of Drosophila melanogaster. In the
HO of fruit fly, the iron of heme was not involved in
binding to the enzyme, resulting in a different spec-
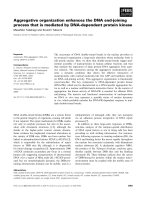
trum from the other HOs [35]. Figure 3 exhibits opti-
cal absorption spectra of the iron(III), iron(II), oxy,
and CO-bound forms of the heme-Syn HO-2 complex
at pH 7.4. Interestingly, the spectrum of the iron(III)
complex has two peaks at 576 and 540 nm besides the
Soret band at 412 nm in the visible region, which
resembles that of the complex of iron(III) heme and
Syn HO-1 at alkaline pH [28], suggesting that the
major species of the iron(III) heme iron of Syn HO-2
at neutral pH is a hexa-coordinate low spin species.
This is quite different from other known HOs. The
Soret peak of the iron(III) complex was slightly red-
shifted at pH 8.0 with a slight decrease in its absorb-
ance and slightly blue-shifted at pH 6.0 with a slight
increase in its absorbance. However, the dependence
on pH was not fully reversible because of denaturation
of the protein. By the pyridine hemochrome method,
the extinction coefficient at 412 nm for the iron(III)
heme–Syn HO-2 complex is calculated to be
110 mm
)1
Æcm
)1
.
The electron paramagnetic resonance (EPR) spec-
trum of the iron(III) resting state of heme-Syn HO-2
in pH 7.4 solution reveals that the heme in Syn HO-2
is in an admixture of high-spin and low-spin states
(Fig. 4A). Though the high spin species exhibits an
apparently axially symmetric type of spectrum with
g
^
¼ 6 and g
II
¼ 2, small rhombicity is observed at
the perpendicular component of the spectrum, which is
not seen in the spectrum of the high-spin heme Syn
Table 1. Activities of the purified Syn HO-2. The HO activity was
determined from the initial rate of bilirubin formation with the
NADPH ⁄ FNR ⁄ Fd, NADPH ⁄ CPR or sodium ascorbate system at
30 °C, pH 7.4. All the measurements were done in triplicate.
Reaction system
Bilirubin formation
(nmolÆmg protein
)1
Æh
)1
)
Syn HO-2 Syn HO-1
NADPH ⁄ FNR ⁄ Fd 622 ± 21 603 ± 27
NADPH ⁄ CPR 81 ± 3 69 ± 8
Sodium ascorbate 424 ± 20 273 ± 23
Fig. 3. Absorption spectra of various forms of the Syn HO-2–heme
complex. The concentration of the complex was 7 lm. The spectra
are the iron(III) (solid line), iron(II) (dotted line), iron(II)-CO (dashed
line), and oxy (dotted-dashed line) complexes. Inset, titration of Syn
HO-2 (9 l m) with hemin as monitored by the increase in absorb-
ance at 412 nm ()). The increase in absorbance because of the
addition of hemin in the absence of Syn HO-2 is indicated (*).
Fig. 4. EPR spectra of the heme–Syn HO-2 complexes. (A) The
iron(III) resting state complex in pH 7.4 solution (solid line) and in
pH 8.0 solution (dotted line). EPR conditions were microwave fre-
quency, 9.35 GHz, microwave power, 1 mW, field modulation fre-
quencies, 100 kHz, field modulation amplitude, 10 G, and sample
temperature, 10 K. (B) The
15
NO bound iron(II) complex measured
with microwave power, 0.2 mW, field modulation amplitude, 2 G,
at 25K, where other conditions are the same as those described
in (A).
X. Zhang et al. Cyanobacterium heme oxygenase-2
FEBS Journal 272 (2005) 1012–1022 ª 2005 FEBS 1015
HO-1 complex. This suggests that the in-plane anisot-
ropy of the ligand field to the heme iron in Syn HO-2
is relatively large. The seating of the heme in the heme
pocket might be less homogeneous than in Syn HO-1.
As the pH of the solution rises from 7.4 to 8.0, the sig-
nal intensity of the high-spin species decreases and
alternatively that of the low-spin species increases
without a change in the g-values. The low-spin compo-
nent of the spectrum shows that there are two kinds of
low-spin species: the major species has g-values of
2.69, 2.20, and 1.79 and the minor species has more
anisotropic g-values (Fig. 4A, asterisks). The g-values
of the major species (2.69, 2.20, 1.79) are very close to
those (2.68, 2.20, 1.80) of the minor alkaline compo-
nent of heme–Syn HO-1 as well as to the values (2.67,
2.21, 1.79) of the alkaline form of heme-rHO-1 [28].
The g-values of the minor component of heme–Syn
HO-2 seem to be similar to those of the major low-
spin component (2.78, 2.14, 1.74) of heme–Syn HO-1
in alkaline solution [28]. The low-spin species of heme–
Syn HO-2 therefore probably is the same species as the
alkaline forms of known heme–HO. The existence of
alkaline forms is evidence that a water molecule is pos-
sessed at the distal site of the heme iron and strongly
interacts with the distal helix main chain or its disso-
ciable residues. The close similarity of the g-values sug-
gests that the heme pocket milieu of heme-Syn HO-2
in alkaline solution more resembles that of rHO-1 than
that of Syn HO-1.
The
15
NO-bound form of heme-Syn HO-2 shows a
typical six-coordinated nitrosyl heme spectrum
(Fig. 4B). The hyperfine splitting pattern at the g
2
component indicates that nitrogen nuclei both of
15
NO
and of
14
N-proximal ligand cause the splitting. The
heme proximal ligand is considered to be His16, which
corresponds to His17 of the proximal ligand of heme-
Syn HO-1. EPR parameters of
15
NO-heme–Syn HO-2
were compared with those of the Syn HO-1 and rHO-
1 complexes (Table 2). Hyperfine coupling constants,
A(
15
N-O) and A(
14
N-His), of the Syn HO-2 complex
are closer to those of the rHO-1 complex than Syn
HO-1 complex, indicating that the axial ligand coordi-
nation structure of heme-Syn HO-2 rather resembles
that of heme-rHO-1. In conclusion, EPR reveals that
the heme-Syn HO-2 complex is in dynamic equilibrium
between high- and low-spin states, which might be
caused by the hydrogen bonding interaction between
the distal water ligand and distal helix components.
Further, part of the heme pocket structure of Syn
HO-2 more resembles that of rHO-1 than that of Syn
HO-1.
Degradation of hemin bound to Syn HO-2 to
biliverdin by the NADPH/FNR/Fd or sodium
ascorbate systems
To reduce FNR-mediated heme degradation leading to
nonbiliverdin products, we used FNR ⁄ Fd equivalent
to one-twenty fourth of Syn HO-2 in this study. With
the addition of NADPH to the reaction mixture, the
absorption showing a peak at 412 nm decreased gradu-
ally until finally, broad absorption bands centered near
380 and 690 nm appeared, indicative of the conversion
of hemin to biliverdin (Fig. 5A). The formation of
biliverdin is supported by the decrease in absorbance
around 690 nm and concomitant increase in absorb-
ance around 450 nm after the addition of biliverdin
reductase, reflecting the conversion of biliverdin to
bilirubin. Similar spectrophotometric changes were
observed in Fig. 5B, where sodium ascorbate was used
as a reductant. The decrease in absorbance at 412 nm
supported by FNR ⁄ Fd was slower than that with
ascorbate. This is because a relatively small amount of
FNR ⁄ Fd compared to Syn HO-2 was added to the
reaction system. Again, the absorption due to biliver-
din was converted to that of bilirubin by the addition
of biliverdin reductase and NADPH.
A previous study on rHO-1 indicated that when
ascorbate was used as a reductant, the final heme deg-
radation product was not biliverdin but iron(III) bili-
verdin bound to the enzyme [36]. Then, we conducted
similar experiments without desferrioxamine. The rates
of heme degradation did not differ in the presence or
absence of desferrioxamine. However, the intensities
of the absorbance around 690 nm in the NADPH ⁄
FNR ⁄ Fd system (Fig. 5C) and ascorbate system
(Fig. 5D) were about two-thirds and one-half of those
observed in the presence of desferrioxamine, respect-
ively. These results suggest that the final product of
the Syn HO-2 reaction supported by both reducing
systems is biliverdin and that the release of iron(III)-
biliverdin from Syn HO-2 is slow.
In independent experiments, we analyzed the stereo-
selectivity of the products of the Syn HO-2 reaction
supported by the NADPH ⁄ FNR ⁄ Fd system and
ascorbate system using HPLC. In both cases, only
Table 2. EPR parameters of the iron(II)
15
NO bound heme com-
plexes of Syn HO-2, Syn HO-1, and rat HO-1. Data from Syn HO-1
and rat HO-1 are taken from reference [28].
Protein g
3
g
2
g
1
A([
15
N]NO) ⁄ GA([
14
N]His) ⁄ G
Syn HO-2 2.082 2.006 1.965 27.2 7.4
Syn HO-1 2.079 2.003 1.962 31.1 7.1
rat HO-1 2.086 2.008 1.986 26.0 7.4
Cyanobacterium heme oxygenase-2 X. Zhang et al.
1016 FEBS Journal 272 (2005) 1012–1022 ª 2005 FEBS
the a-isomer of biliverdin was detected (data not
shown), indicating a-specificity of the Syn HO-2
reaction.
Reaction of hemin bound to Syn HO-2 with
hydrogen peroxide
In the case of mammalian HO, an iron(III) hydroper-
oxide species was speculated to be an intermediate in
the first oxygenation step, as hydrogen peroxide con-
verted hemin to iron(III) verdoheme via a-meso-
hydroxyhemin (Scheme 1) [37]. This was confirmed
experimentally [38–40]. Then, we reacted the hemin–
Syn HO-2 complex with hydrogen peroxide and found
that a iron(III) verdoheme–Syn HO-2 complex was
formed (data not shown). This result shows that a
iron(III) hydroperoxide species must be an active inter-
mediate in the first oxygenation step from hemin to
a-meso-hydroxyhemin in the Syn HO-2 reaction, like
for other HOs studied.
Verdoheme formation during the course
of heme degradation
With rHO-1, hemin bound to the enzyme was conver-
ted into iron(II)-CO form of verdoheme under O
2
and
CO, and the reaction was arrested at this stage because
CO inhibits the further conversion of verdoheme to
iron(III)-biliverdin (Scheme 1) [41]. To detect the
iron(II)–CO form of the verdoheme–Syn HO-2 com-
plex, we carried out similar experiments in an atmo-
sphere of approximately 5% CO, 5% O
2
and 90% N
2
(v ⁄ v ⁄ v). The spectrum (Fig. 6, dotted line) recorded
2 min after the start of the reaction has four peaks at
415, 540, 570, and 637 nm in the visible region. The
first peak is attributable to the iron(III)–Syn HO-2
Fig. 5. Reaction of hemin bound to Syn HO-2 with the NADPH ⁄ FNR ⁄ Fd system or sodium ascorbate in the presence or absence of desfer-
rioxamine (DFO). Spectrum of the hemin–Syn HO-2 complex (solid line); 10 min after the start of the reaction depicted between 350 and
450 nm (dotted line); 50 min after the start of the reaction (dashed line); after the addition of biliverdin reductase (dotted-dashed line). In the
ascorbate system (B and D), NADPH was added together with biliverdin reductase. Inset, five-fold enlarged spectra between 500 and
750 nm.
X. Zhang et al. Cyanobacterium heme oxygenase-2
FEBS Journal 272 (2005) 1012–1022 ª 2005 FEBS 1017
complex and the peaks at 540 and 570 nm are due to
an admixture of the iron(III) and the iron(II)-CO
complexes. The peak at 637 nm is attributable to
the CO-bound verdoheme–Syn HO-2 complex. The
absorption at 637 nm increased with time and reached
a maximum 2 min after the start of the reaction. The
broken line, a spectrum recorded a further 3 min later,
has a decreased absorbance at 637 nm and increased
absorbance around 690 nm, indicative of the conver-
sion of verdoheme to biliverdin. The spectral changes
depicted in Fig. 6 together with the result described in
the preceding section indicate that verdoheme is an
intermediate of the Syn HO-2 reaction, like other HO
reactions.
Detection of CO during the Syn HO-2 reaction
Difference absorption spectroscopy in the presence of
mutated myoglobin, H64L, which has a high affinity
for CO, was used to detect CO formed during the
NADPH ⁄ FNR ⁄ Fd-supported reaction. The Soret band
of myoglobin was monitored at 1-min intervals after
the addition of NADPH to both the sample and the
reference cuvette. As depicted in Fig. 7, the myoglobin
Soret band shifted from 393 to 425 nm with the
appearance of a ⁄ b bands at 568 and 538 nm and
absorbance at 425 nm increased. These results indicate
that the iron(III) form of myoglobin was reduced to
the iron(II) form by the NADPH ⁄ FNR ⁄ Fd system
and this was followed by CO binding to yield the
iron(II)-CO form, the authentic absorption spectrum
of which is depicted in the inset of Fig. 7. This experi-
ment clearly demonstrates the formation of CO during
the degradation of heme by Syn HO-2 in line with the
mechanism shown in Scheme 1.
Conclusive remarks
Although a previous effort to express the ho2 gene
in E. coli cells by Cornejo et al. resulted in mostly
insoluble protein [27], we fortunately obtained soluble
Syn HO-2 protein on a large scale. As the conditions
of cell culture seemed to be similar in both cases,
the difference in the plasmid used might be the cause
of the discrepancy. In spite that an RNA blot ana-
lysis of cyanobacteria grown in light suggested that
ho2 is silent [27], the Syn HO-2 obtained in this
study has shown heme oxygenase activity. Similar to
mammalian HO-1 and HO-2 as well as bacterial
HOs (Hmu O, Hem O, Pig A) and Syn HO-1, Syn
HO-2 binds a stoichiometric amount of heme to
form a stable heme–HO complex. Optical absorption
and EPR spectroscopy reveal that heme–Syn HO-2 is
mostly in the iron(III) low-spin state, which is a
unique feature of this complex. In spite of the low-
spin resting state, the bound heme is converted
to biliverdin IX
a
, CO and free iron in the presence
of reducing equivalents such as ascorbate or
NADPH ⁄ FNR ⁄ Fd and oxygen. The activity of Syn
HO-2 for the catabolism of heme is comparable to
that of Syn HO-1 as determined by the initial rate
Fig. 6. Reaction of hemin bound to Syn HO-2 with the
NADPH ⁄ FNR ⁄ Fd system under O
2
and CO. Spectrum of the
hemin–Syn HO-2 complex with FNR ⁄ Fd (solid line); 2 min after the
addition of NADPH to start the reaction (dotted line); 5 min after
the start of the reaction (dashed line). Inset, fivefold enlarged spec-
tra between 500 and 750 nm.
Fig. 7. Detection of CO produced during the Syn HO-2 reaction. The
sample solution contained the hemin–Syn HO-2 complex, FNR ⁄ Fd
and the H64L mutant of myoglobin. Myoglobin was omitted from
the reference solution. The reaction was started by the addition of
NADPH to both solutions and the difference spectrum was recor-
ded. Difference spectrum before the start of the reaction (dashed
line); 0.5 min (dotted-dashed line); 1.5 min (dotted line); 4.5 min
(solid line) after the start of the reaction. Inset: Absorption spectra
of various forms of the H64L mutant of myoglobin. CO-iron(II) form
(solid line); iron(II) form (dotted line); iron(III) form (dashed line).
Cyanobacterium heme oxygenase-2 X. Zhang et al.
1018 FEBS Journal 272 (2005) 1012–1022 ª 2005 FEBS
of bilirubin formation. The a-selectivity of the prod-
uct is strictly retained. The second intermediate of
the HO reaction, verdoheme, has also been detected
in the Syn HO-2 reaction and hydrogen peroxide has
been ascertained to substitute for O
2
and electrons
in the conversion of hemin to verdoheme, thereby
implying that the chemistry of heme degradation by
Syn HO-2 is similar to that by other HOs. Accord-
ingly, we conclude that Syn HO-2 is a true heme
oxygenase even though the physiological importance
of this isoform is unknown at this stage.
It is noticeable that the EPR spectrum of nitrosyl
heme–Syn HO-2, in which the minute difference in the
ligand field around the heme is saliently represented, is
explicitly different from that of heme–Syn HO-1. As
85% of the amino acids composing of the distal-site
helix in Syn HO-1 are conserved in Syn HO-2, some
factor(s) other than the primary structure, may be
responsible for the difference in the heme-pocket struc-
ture. We are now in the process of analyzing the crys-
tal structure of Syn HO-2.
Experimental procedures
Construction of Synechocystis heme oxygenase-2
expression vector, pMWSynHO2
A 50 base pair double-stranded synthetic oligonucleotide
with unique sites for the restriction enzymes NdeI, Bsu36I,
NheI, EcoRI, XhoI, and HindIII was ligated between NdeI
and HindIII sites of a T7-promotor-based bacterial expres-
sion vector, pMW172, to make a plasmid tentatively
referred to as pMW-A. Ten oligonucleotides and their
complements, 59–88 nucleotides in length, were synthesized
to construct a 752 base pair synthetic gene coding for the
entire Syn HO-2 from the ATG initiation codon to the
TAA stop codon. Each nucleotide was phosphorylated
with T4 polynucleotide kinase, then annealed with its com-
plement to make a double-stranded DNA, e.g. Oligo I to
Oligo X. Oligo I was designed so that the 5¢ end could be
ligated to the Nde I site, whereas its 3¢ cohesive end was
complementary to the 5¢ end of Oligo II. The 3¢ end of
Oligo II could be ligated to the Bsu36I site. Similarly, the
5¢ ends of Oligos III, V, VII and IX were designed to
ligate to the Bsu36I, NheI, EcoRI, and XhoI sites, respect-
ively, and their 3¢ ends had sequences for ligation to the
5¢ ends of Oligo IV, VI, VIII and X. The 3¢ end of Oligo
X had a sequence designed to ligate to the HindIII site.
To complete the Syn HO-2 expression vector
pMWSynHO2, double-stranded Oligo I to Oligo X were
ligated step by step into the restriction enzyme sites of
pMW-A. The nucleotide sequence of the thus constructed
pMWSynHO2 was determined with an Applied Biosystems
373A DNA sequencer.
Syn HO-2 expression and purification
A 5 mL inoculum in Luria–Bertani medium (+ 50 lgÆmL
)1
ampicillin ⁄ 0.1% glucose) was prepared from a plate of trans-
formed E. coli BL21 (DE3) cells carrying pMWSynHO2.
Five-hundred milliliter cultures were inoculated with 300 lL
of the inocula and grown in Luria–Bertani medium (+ 200
lgÆmL
)1
ampicillin) at 37 °C until the D
600
reached 0.8–1.0.
The cells were grown for an additional 24 h at 20 °C, harves-
ted by centrifugation, and stored at )80 °C prior to use. The
typical yield of cells from a 500 mL culture was 2 g.
The E. coli cells (10 g), resuspended in 90 mL of
Tris ⁄ HCl buffer (pH 7.4, +2 mm EDTA), were lysed
(2 mg lysozyme per g cells) with stirring at 4 °C for 30 min.
After sonication (Branson 450 Sonifire) and centrifugation
at 100 000 g for 1 h, the resulting supernatant was covered
with a 20–50% ammonium sulfate fraction and centrifuged.
The subsequent precipitates, containing the Syn HO-2 pro-
tein, were dissolved in 20 mm potassium phosphate buffer
(KPB) (pH 7.4) and applied to a Sephadex G-75 column
(3.6 · 50 cm), pre-equilibrated with the same buffer. The
protein fractions eluted in the KPB, with an intense 29 kDa
band on SDS ⁄ PAGE, were collected and directly loaded
onto a column of DE-52 (2.6 · 28 cm). The column was
washed with 50 mL of 20 mm KPB (pH 7.4)-50 mm KCl,
and the protein was eluted with 400 mL of 20 mm KPB
(pH 7.4) using a linear gradient, 50–400 mm KCl. Collected
fractions with a high protein content were further run
through a column of hydroxyapatite (2.6 · 20 cm). Again
the column was washed with 50 mL of 20 mm KPB
(pH 7.4), and the protein was eluted with 200 mL of
50 mm KPB (pH 7.4). Only fractions with a single band at
29 kDa on SDS ⁄ PAGE were gathered.
Heme binding study
Heme binding of Syn HO-2 was tested by adding hemin to
9 lm Syn HO-2 in 2 mL of 50 mm KPB (pH 7.4). The ref-
erence cuvette contained 2 mL of 50 m m KPB (pH 7.4)
alone. A solution of 1 mm hemin was added in 4 lL aliqu-
ots to both test and reference cuvettes with 5 min equilibra-
tion between additions at 25 °C. The absorbance between
350 and 750 nm was measured on a Beckman DU7400
single-beam spectrophotometer.
Preparation of a complex of Syn HO-2 and hemin
Syn HO-2 in 50 mm KPB (pH 7.4) was added to a 1.2
equivalent excess of hemin. This solution was passed
through a column of Sephadex G-25 equilibrated with
50 mm KPB (pH 7.4). Fractions colored brown were loaded
onto a column of hydroxyapatite equilibrated with 50 mm
KPB (pH 7.4). The passed fraction colored brown was
collected and used as a complex of hemin and Syn HO-2
for spectrophotometric experiments.
X. Zhang et al. Cyanobacterium heme oxygenase-2
FEBS Journal 272 (2005) 1012–1022 ª 2005 FEBS 1019
Optical absorption spectroscopy
Optical absorption spectra were recorded on a Beckmann,
DU7400 spectrophotometer at 25 °C. The iron(II) heme–
Syn HO-2 complex was prepared in a sealed cuvette by
the addition of dithionite to a 0.1 m KPB (pH 7.4) solu-
tion of hemin–Syn HO-2 saturated with argon. The CO
complex of heme–Syn HO-2 was prepared by displacing
the argon in the space of a sealed cuvette containing the
iron(II)–Syn HO-2 solution with CO. The oxy complex
was prepared by introducing air into the anaerobic sample
of iron(II) heme–Syn HO-2 generated by the reduction of
the iron(III) complex with a stoichiometric amount of
sodium dithionite.
Assay of heme oxygenase activity by measuring
bilirubin formation
The catalytic activity of Syn HO-2 and Syn HO-1 was
determined after the conversion of biliverdin IX
a
produced
by the enzyme, to bilirubin by biliverdin reductase. The
reaction mixture of the NADPH ⁄ FNR ⁄ Fd system con-
tained in a final volume of 1.5 mL; 50 mm KPB (pH 7.4),
0.5 mg of bovine serum albumin, 20 lm hemin, 1 lm
enzyme, 0.7 lm maize FNR ⁄ maize Fd III, 140 lm
NADPH, 1 mm desferrioxamine, and 6 lm recombinant rat
biliverdin reductase [42]. NADPH was omitted in the con-
trol system. The reaction was started by the addition of
NADPH after 3-min preincubation at 30 °C, and monit-
ored at 468 nm for 10 min. The value of 43.5 mm
)1
Æcm
)1
was used as the extinction coefficient for bilirubin at
468 nm [43]. Assay in the presence of NADPH ⁄ CPR was
performed by the similar way except that 0.7 lm of rat liver
CPR was used instead of 0.7 l m of FNR ⁄ Fd. The ascor-
bate system contained in a final volume of 1.5 mL; 50 mm
KPB (pH 7.4), 0.5 mg of bovine serum albumin, 20 lm
hemin, 1 lm enzyme, 13.3 mm sodium ascorbate, 70 lm
NADPH, 1 mm desferrioxamine, and 6 lm biliverdin reduc-
tase. Ascorbate was omitted from the control system.
The reaction was initiated by the addition of ascorbate.
Other conditions were the same as those for the
NADPH ⁄ FNR ⁄ Fd system.
Reaction of hemin bound to Syn HO-2 with
NADPH/FNR/Fd, sodium ascorbate, and hydro-
gen peroxide systems in the presence or absence
of desferrioxamine
Spectral changes were recorded at 30 °C between 350
and 750 nm. We used three electron donor systems,
NADPH ⁄ FNR ⁄ Fd, ascorbate, and H
2
O
2
. The standard
reaction mixture for the NADPH ⁄ FNR ⁄ Fd system consis-
ted of 8 lm Syn HO-2–hemin complex and 0.33 lm
FNR ⁄ Fd in a final volume of 1.5 mL of 50 mm KPB
(pH 7.4). After 3 min preincubation, the reaction was
started by the addition of 15 lLof10mm NADPH (final
concentration, 0.1 mm). The reaction mixture for the ascor-
bate system contained 8 lm Syn HO-2–hemin complex in a
final volume of 1.5 mL of 50 mm KPB (pH 7.4). After
3 min preincubation, the reaction was initiated by the
addition of 15 lLof1m sodium ascorbate (final concentra-
tion, 10 mm). When desferrioxamine was added, a final
concentration of 1 mm was used. The H
2
O
2
system consis-
ted of 8 lm Syn HO-2–hemin complex in a final volume of
1.5 mL of 50 mm KPB (pH 7.4). After 3 min preincuba-
tion, the reaction was started by the addition of 15 lLof
1mm H
2
O
2
in water (final concentration, 10 lm). The
concentration of H
2
O
2
in the original aqueous reagent solu-
tion was determined spectroscopically using a value of
43.6 m
)1
Æcm
)1
for the extinction coefficient at 240 nm [44].
EPR spectroscopy
EPR measurements were performed with a Bruker E500
spectrometer, operating at 9.35–9.55 GHz, with an Oxford
ESR 900 liquid helium cryostat. The
15
NO-bound form of
the heme–Syn HO-2 complex was prepared by adding dithio-
nite to the argon-saturated hemin–protein solution, con-
taining Na
15
NO
2
in an EPR tube.
Detection of carbon monoxide
To detect CO produced during the reaction supported by
a system of NADPH ⁄ FNR ⁄ Fd, a myoglobin mutant,
H64L, which has higher affinity for CO than the wild
type [45], was included in the reaction mixture. The reac-
tion solutions contained 8 lm hemin–Syn HO-2 complex,
and 0.67 lm FNR ⁄ Fd in 1.5 mL of 50 mm KPB
(pH 7.4). H64L, at a final concentration of 6.5 lm, was
included in the test solution. After the addition of
NADPH (final concentration, 0.1 mm) to both cuvettes,
the spectrum was recorded 30 s after the start of the
reaction and then recorded at 1-min intervals between
350 and 750 nm.
Other procedures
Sequence translation and sequence alignment were per-
formed using the Wisconsin Package from the Genetic
Computer Group (Madison, WI, USA) and clustalw mul-
tiple sequence alignment program at the EBI (EMBL-EBI).
HPLC analysis of reaction products was done as previously
described [35]. Purified Syn HO-1 was obtained by a pub-
lished method [28]. Maize FNR [46], maize Fd III [47], and
rat liver CPR [3] were purified to the single bands on
SDS ⁄ PAGE by published procedures. The H64L mutant
was purified according to published methods [48]. Hemin
concentrations were measured according to the method of
Cyanobacterium heme oxygenase-2 X. Zhang et al.
1020 FEBS Journal 272 (2005) 1012–1022 ª 2005 FEBS
Paul and Theorell [49]. Protein concentration was measured
by the Lowry method using bovine serum albumin as
standard [50].
Acknowledgements
This work was supported in part by grants-in-aid from
the Ministry of Education, Science, Sports, and Cul-
ture, Japan (14580641 and 16570108).
The bacterial expression vector pMW172 was a gift
from Dr K. Nagai, MRC Laboratory of Molecular
Biology, Cambridge, UK. The expression plasmid for
the myoglobin mutant, H64L was a gift from Professor
J. S. Olson, Rice University. E. coli expression plas-
mids for maize FNR and maize Fd III were gifts from
professor T. Hase, Osaka University.
References
1 Tenhunen R, Marver HS & Schmid R (1969) Microso-
mal heme oxygenase. J Biol Chem 244, 6388–6394.
2 Shibahara S, Muller R, Taguchi H & Yoshida T (1985)
Cloning and expression for rat heme oxygenase. Proc
Natl Acad Sci USA 82, 7865–7869.
3 Yoshida T & Sato M (1989) Posttranslational and direct
integration of heme oxygenase into microsomes. Bio-
chem Biophys Res Commun 163, 1086–1092.
4 Yoshida T & Migita CT (2000) Mechanism of heme
degradation by heme oxygenase. J Inorg Biochem 82,
33–41.
5 Colas C & Ortiz de Montellano PR (2003) Autocatalytic
radical reactions in physiological prosthetic heme modi-
fication. Chem Rev 103, 2305–2332.
6 Maines MD (1988) Heme oxygenase: function, multipli-
city, regulatory mechanisms, and clinical applications.
FASEB J 2, 2557–2568.
7 Poss KD & Tonegawa S (1997) Heme oxygenase 1 is
required for mammalian iron reutilization. Proc Natl
Acad Sci USA 94, 10919–10924.
8 Yachie A, Niida Y, Wada T, Igarashi N, Kaneda H,
Toma T, Ohta K, Kasahara Y & Koizumi S (1999) Oxi-
dative stress causes enhanced endothelial cell injury in
human heme oxygenase-1 deficiency. J Clin Invest 103,
129–135.
9 Snyder SH, Jaffrey SR & Zakhary R (1998) Nitric oxide
and carbon monoxide: parallel roles as neural messen-
gers. Brain Res Brain Res Rev 26, 167–175.
10 Stocker R, Yamamoto Y, McDonagh AF, Glazer AN
& Ames BN (1987) Bilirubin is an antioxidant of
possible physiological importance. Science 235,
1043–1046.
11 Baranano DE, Rao M, Ferris CD & Snyder SH (2002)
Biliverdin reductase: a major physiologic cytoprotectant.
Proc Natl Acad Sci USA 99, 16093–16098.
12 Wilks A & Schmitt MP (1998) Expression and charac-
terization of a heme oxygenase (Hmu O) from
Corynebacterium diphtheriae. J Biol Chem 273, 837–841.
13 Zhu W, Wilks A & Stojiljkovic I (2000) Degradation of
heme in Gram-negative bacteria: the product of the
hemO gene of Neisseriae is a heme oxygenase. J Bacter-
iol 182, 6783–6790.
14 Ratliff M, Zhu W, Deshmukh R, Wilks A & Stojiljko-
vic I (2001) Homologous of Neisserial heme oxygenase
in Gram-negative bacteria: degradation of heme by the
product of the pigA gene of Pseudomonas aeruginosa.
J Bacteriol 183, 6394–6403.
15 Beale SI (1993) Biosynthesis of phycobilins. Chem Rev
93, 785–802.
16 Beale SI & Cornejo J (1984) Enzymatic heme oxygenase
activity in soluble extracts of the unicellular red alga,
Cyanidium caldarium. Arch Biochem Biophys 235, 371–384.
17 Cornejo J & Beale SI (1988) Algal heme oxygenase from
Cyanidium caldarium . J Biol Chem 263, 11915–11921.
18 Rhie G & Beale SI (1992) Biosynthesis of phycobilins.
J Biol Chem 267, 16088–16093.
19 Rhie G & Beale SI (1995) Phycobilin biosynthesis:
reductant requiments and product identification for
heme oxygenase from Cyanidium caldarium. Arch Bio-
chem Biophys 320, 182–194.
20 Cornejo J & Beale SI (1997) Phycobilin biosynthetic
reactions in extracts of cyanobacteria. Photosynth Res
51, 223–230.
21 Terry MJ, Linley PJ & Kochi T (2002) Making light of
it: the role of plant heme oxygenases in phytochrome
chromophore synthesis. Biochem Soc Trans 30, 604–609.
22 Kim J-I, Jozhukh GV & Song P-S (2002) Phytochrome-
mediated signal transduction pathways in plants.
Biochem Biophys Res Commun 298, 457–463.
23 Davis SJ, Kurepa J & Vierstra RD (1999) The Arabidop-
sis thaliana HY1 locus, required for phytochrome-
chromophore biosynthesis, encodes a protein related to
heme oxygenases. Proc Natl Acad Sci USA 96, 6541–
6546.
24 Kaneko T, Tanaka A, Sato S, Kotani H, Sazuka T,
Miyajima N, Sugiura M & Tabata S (1996) Sequence
analysis of the genome of the unicellular cyanobacter-
ium Synechocystis sp. Strain PCC 6803. II. Sequence
determination of the entire genome and assignment
of potential protein-coding regions. DNA Res 3,
109–136.
25 Muramoto T, Kohchi T, Yokota A, Hwang I & Good-
man HM (1999) The Arabidopsis photomorphogenic
mutant hy1 is deficient in phytochrome chromophore
biosynthesis as a result of a mutation in a plastid heme
oxygenase. Plant Cell 11, 335–347.
26 Davis SJ, Bhoo SH, Durski AM, Walker JM & Vierstra
RD (2001) The heme-oxygenase family required for
phytochrome chromophore biosynthesis is necessary for
X. Zhang et al. Cyanobacterium heme oxygenase-2
FEBS Journal 272 (2005) 1012–1022 ª 2005 FEBS 1021
proper photomorphogenesis in higher plants. Plant Phy-
siol 126, 656–669.
27 Cornejo J, Willows RD & Beale SI (1998) Phytobilin
biosynthesis: cloning and expression of a gene encoding
soluble ferredoxin-dependent heme oxygenase from
Synechocystis sp. PCC 6803. Plant J 15, 99–107.
28 Migita CT, Zhang X & Yoshida T (2003) Expression
and characterization of cyanobacterium heme oxyge-
nase, a key enzyme in the phycobilin synthesis: proper-
ties of the heme complex of recombinant active enzyme.
Eur J Biochem 270, 687–698.
29 Sugishima M, Migita CT, Zhang X, Yoshida T &
Fukuyama K (2004) Crystal structure of heme oxyge-
nase-1 from cyanobacterium Synechocystis sp. PCC
6803 in complex with heme. Eur J Biochem 271, 4517–
4525.
30 Ishikawa K, Sato M, Ito M & Yoshida T (1992) Impor-
tance of histidine residue 25 of rat heme oxygenase for
its catalytic activity. Biochem Biophys Res Commun 182,
981–986.
31 Schuller DJ, Wilks A, Ortiz de Montellano PR & Pou-
los TL (1999) Crystal structure of human heme oxyge-
nase-1. Nat Struct Biol 6, 860–867.
32 Sugishima M, Omata Y, Kakuta Y, Sakamoto H,
Noguchi M & Fukuyama K (2000) Crystal structure of
rat heme oxygenase-1 in complex with heme. FEBS Lett
471, 61–66.
33 Fujii H, Zhang X, Tomita T, Ikeda-Saito M & Yoshida
T (2001) A role for highly conserved carboxylate,
aspartate-140, in oxygen activation and heme degra-
dation by heme oxygenase-1. J Am Chem Soc 123,
6475–6484.
34 Lightning LK, Huang H, Moenne-Loccoz P, Loehr
TM, Schuller DJ, Poulos TL & de Montellano PR
(2001) Disruption of an active site hydrogen bond con-
verts human heme oxygenase-1 into a peroxidase. J Biol
Chem 276, 10612–10619.
35 Zhang X, Sato M, Sasahara M, Migita CT & Yoshida
T (2004) Unique features of recombinant heme oxyge-
nase of Drosophila melanogaster compared with those of
other heme oxygenases studied. Eur J Biochem 271,
1713–1724.
36 Yoshida T & Kikuchi G (1978) Features of the reaction
of heme degradation catalyzed by the reconstituted
microsomal heme oxygenase system. J Biol Chem 253,
4230–4236.
37 Wilks A & Ortiz de Montellano PR (1993) Rat liver
heme oxygenase: high level expression of a truncated
soluble form and nature of the meso-hydroxylating spe-
cies. J Biol Chem 268, 22357–22362.
38 Davydov RM, Yoshida T, Ikeda-Saito M & Hoffman
BM (1999) Hydroperoxy-heme oxygenase generated
by cryoreduction catalyzes the formation of
a-meso-hydroxyheme as detected by EPR and
ENDOR. J Am Chem Soc 121, 10656–10657.
39 Davydov R, Kofman V, Fujii H, Yoshida T, Ikeda-
Saito M & Hoffman BM (2002) Catalytic mechanism
of heme oxygenase through EPR and ENDOR of cryo-
reduced oxy-heme oxygenase and its Asp 140 mutants.
J Am Chem Soc 124, 1798–1808.
40 Denisov IG, Ikeda-Saito M, Yoshida T & Sligar SG
(2002) Cryogenic absorption spectra of hydroperoxo-
ferric heme oxygenase, the active intermediate of
enzymatic heme oxygenation. FEBS Lett 532, 203–206.
41 Yoshida T, Noguchi M & Kikuchi G (1982) The step of
carbon monoxide liberation in the sequence of heme
degradation catalyzed by the reconstituted microsomal
heme oxygenase system. J Biol Chem 257, 9345–9348.
42 Kikuchi A, Park SY, Miyatake H, Sun D, Sato M,
Yoshida T & Shiro Y (2001) Crystal structure of rat
biliverdin reductase. Nat Struct Biol 8, 221–225.
43 Yoshida T & Kikuchi G (1978) Purification and proper-
ties of heme oxygenase from pig spleen microsomes.
J Biol Chem 253, 4224–4229.
44 Beers RF Jr & Sizer LW (1952) A spectrophotometric
method for measuring the breakdown of hydrogen per-
oxide by catalase. J Biol Chem 195, 133–140.
45 Rohlfs RJ, Mathews AJ, Carver TE, Olson JS, Springer
BA, Egeberg KD & Sligar SG (1990) The effects of
amino acid substitution at position E7 (residue 64) on
the kinetics of ligand binding to sperm whale myoglo-
bin. J Biol Chem 265, 3168–3176.
46 Onda Y, Matsumura T, Kimata-Ariga Y, Sakakaibara
T, Sugiyama T & Fase T (2000) Differential interaction
of maize root ferredoxin: NADP+ oxidoreductase and
non-photosynthetic ferredoxin isoproteins. Plant Physiol
123, 1037–1045.
47 Hase T, Mizutani S & Mukohata Y (1991) Expression
of maize-ferredoxin cDNA in Escherichia coli. Plant
Physiol 97, 1395–1401.
48 Springer BA & Sligar SG (1987) High-level expression
of sperm whale myoglobin in Escherichia coli. Proc Natl
Acad Sci USA 84, 8961–8965.
49 Paul KG & Theorell H (1953) The molar light absorp-
tion of pyridine ferroprotoporphyrin (pyridine haemo-
chromogen). Acta Chem Scand 7, 1284–1287.
50 Lowry OH, Rosebrough NJ, Farr AL & Randall RJ
(1951) Protein measurement with the folin phenol
reagent. J Biol Chem 193, 265–275.
Cyanobacterium heme oxygenase-2 X. Zhang et al.
1022 FEBS Journal 272 (2005) 1012–1022 ª 2005 FEBS